This is a repository copy of
Optimizing the calculation of energy landscape parameters
from single-molecule protein unfolding experiments
.
White Rose Research Online URL for this paper:
http://eprints.whiterose.ac.uk/84384/
Version: Published Version
Article:
Tych, KM, Hughes, ML, Bourke, J et al. (4 more authors) (2015) Optimizing the calculation
of energy landscape parameters from single-molecule protein unfolding experiments.
Physical Review E: Statistical, Nonlinear, and Soft Matter Physics, 91 (1). 12710 - 12719
(10). ISSN 1539-3755
https://doi.org/10.1103/PhysRevE.91.012710
[email protected] https://eprints.whiterose.ac.uk/ Reuse
Unless indicated otherwise, fulltext items are protected by copyright with all rights reserved. The copyright exception in section 29 of the Copyright, Designs and Patents Act 1988 allows the making of a single copy solely for the purpose of non-commercial research or private study within the limits of fair dealing. The publisher or other rights-holder may allow further reproduction and re-use of this version - refer to the White Rose Research Online record for this item. Where records identify the publisher as the copyright holder, users can verify any specific terms of use on the publisher’s website.
Takedown
If you consider content in White Rose Research Online to be in breach of UK law, please notify us by
Optimizing the calculation of energy landscape parameters from single-molecule
protein unfolding experiments
Katarzyna M. Tych and Megan L. Hughes
Astbury Centre for Structural Molecular Biology and School of Physics and Astronomy, University of Leeds, Leeds LS2 9JT, United Kingdom
James Bourke
School of Physics and Astronomy, University of Leeds, Leeds LS2 9JT, United Kingdom
Yukinori Taniguchi and Masaru Kawakami
School of Materials Science, Japan Advanced Institute of Science and Technology (JAIST), 1-1 Asahidai, Nomi, Ishikawa 923-1292, Japan
David J. Brockwell and Lorna Dougan
Astbury Centre for Structural Molecular Biology and School of Physics and Astronomy, University of Leeds, Leeds LS2 9JT, United Kingdom
(Received 6 August 2014; published 26 January 2015)
Single-molecule force spectroscopy using an atomic force microscope (AFM) can be used to measure the average unfolding force of proteins in a constant velocity experiment. In combination with Monte Carlo simulations and through the application of the Zhurkov-Bell model, information about the parameters describing the underlying unfolding energy landscape of the protein can be obtained. Using this approach, we have completed protein unfolding experiments on the polyprotein (I27)5 over a range of pulling velocities. In agreement with
previous work, we find that the observed number of protein unfolding events observed in each approach-retract cycle varies between one and five, due to the nature of the interactions between the polyprotein, the AFM tip, and the substrate, and there is an unequal unfolding probability distribution. We have developed a Monte Carlo simulation that incorporates the impact of this unequal unfolding probability distribution on the median unfolding force and the calculation of the protein unfolding energy landscape parameters. These results show that while there is a significant, unequal unfolding probability distribution, the unfolding energy landscape parameters obtained from use of the Zhurkov-Bell model are not greatly affected. This result is important because it demonstrates that the minimum acceptance criteria typically used in force extension experiments are justified and do not skew the calculation of the unfolding energy landscape parameters. We further validate this approach by determining the error in the energy landscape parameters for two extreme cases, and we provide suggestions for methods that can be employed to increase the level of accuracy in single-molecule experiments using polyproteins.
DOI:10.1103/PhysRevE.91.012710 PACS number(s): 82.37.Rs,82.37.Gk,87.64.−t,87.15.La
I. INTRODUCTION
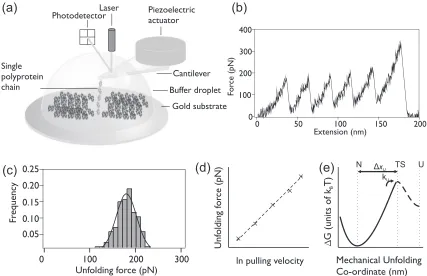
Single-molecule force spectroscopy is a commonly used tool for the mechanical characterization of polymers and biological molecules, such as proteins and DNA [1–10], and ligand-protein interactions [11–19]. These experiments can be performed using a variety of experimental setups, including optical tweezers [3,20], the atomic force microscope (AFM) [1,4], magnetic tweezers [21,22], and the biomembrane force probe [23]. In a typical AFM single-molecule force spectroscopy experiment, protein molecules are immobilized on a surface, and the AFM probe is repeatedly brought into contact with the surface. When the probe successfully picks up a protein molecule through a nonspecific interaction, it extends the tethered protein either at a constant velocity or a constant force before driving it to a fully extended, unfolded state [Fig.1(a)] [4].
Rather than using single protein domains, polyprotein chains (repeats of identical or alternating protein domains joined by amino acid linkers [24,25], pairs of cysteine residues [26], maleimide-thiol coupling [27], or disulfide bridges [28]) are often used. These provide clear fingerprints, such as the recognizable sawtooth pattern seen in the force-extension traces collected in constant velocity measurements [Fig.1(b)]. The use of polyproteins also reduces the dominance
of interactions between the AFM probe and the surface on the measured unfolding force, and it increases the number of data points collected for a given approach and retraction cycle [4,29,30].
In an example force-extension retraction curve, where a single polyprotein is adsorbed onto the cantilever tip, the polyprotein is elongated and the force acting on each protein domain increases as the cantilever is moved away from the substrate [Fig.1(b)]. At a given force, one of the domains will unfold, resulting in a peak in the force-extension trace. This unfolding event releases previously sequestered polypeptide, slackening the chain, which results in a sudden decrease in force seen in the force-extension trace, followed by a gradual increase in force again as the distance between the cantilever and the substrate continually increases. As each domain in the chain unfolds, each unfolding event appears as a peak in the resulting sawtooth pattern. This process is stochastic, and it is not possible to predict the order in which a chain of identical domains will unfold [31].The final peak in every force versus extension trace is the detachment peak, which is not included in the analysis.
KATARZYNA M. TYCHet al. PHYSICAL REVIEW E91, 012710 (2015)
FIG. 1. (a) Schematic of the single-molecule force spectroscopy experimental setup used. A single (I27)5 polyprotein chain is shown,
tethered between the AFM cantilever tip and the gold substrate. (b) An example force-extension trace for a single (I27)5construct, pulled at
2000 nm s−1at room temperature, where each peak in the trace is identified as resulting from the unfolding of a single I27 unfolding domain.
(c) A histogram of unfolding forces of I27 collected over the course of a single experiment at 2000 nm s−1, where forces from sawtooth patterns
containing between two and five unfolding events are pooled. The Gaussian fit (solid line) provides a measure of the spread of the data, with 52 unfolding events. (d) Schematic of the ln of the pulling speed plotted against the median unfolding force of I27. Monte Carlo simulations are used to obtain the best linear fit to the data using the Zhurkov-Bell model. (e) Schematic of the one-dimensional estimation of the mechanical unfolding energy landscape as described by the Zhurkov-Bell model, showing the native, folded state (N), the transition state (TS), the unfolded state (U), and the distance between the native state and the transition statexU. The height of the activation energy barrier to unfolding,G∗,
depends on the unfolding ratekU(0).
at a single pulling velocity for the protein. Repeating the experiments at different pulling speeds enables the dependence of the unfolding force on the pulling speed to be found [Fig.1(d)]. As unfolding is a kinetically controlled process, measuring the speed dependence of unfolding can yield information on the basic parameters of the one-dimensional energy landscape of the protein, namely the unfolding rate constant [kU(0)] and the distance from the native state of the protein to the mechanical unfolding transition state ( xU) [32] [Fig.1(e)]. This technique is based on the application of the Zhurkov-Bell model [33], where the lifetimes of materials under mechanical stress are described by a van ’t Hoff Arrhenius-like expression. While a number of other theoretical models have been developed [34–42], the application of the Zhurkov-Bell model is most frequently adopted for the analysis of single-molecule AFM force spectroscopy experi-ments. A recent review provides details of studies that have employed the Zhurkov-Bell model to extract parameters of the unfolding energy landscape of a protein from experimental data on polyproteins [43]. In addition, since that review, 12 additional studies have used the Zhurkov-Bell model to extract information from force spectroscopy experiments [15,44–54]. Given the prevalence of the Zhurkov-Bell model in force
spectroscopy experiments, it is interesting to examine its application and accuracy in more detail.
In the Zhurkov-Bell model, the protein domain is assumed to unfold via a two-state process, governed bykU(0) andxU. The height of the activation energy barrier,G∗, can then be calculated using the values obtained forkU(0) andxU [10]. A Monte Carlo (MC) simulation that applies the Zhurkov-Bell model to a polyprotein is used to obtain estimates of kU(0) and xU. In this simulation there is an equal probability of observing 1 to n unfolding events for a polyprotein of lengthn.
Typically, the data from an experiment containing multiple force-extension profiles from many approach-retraction cycles are pooled into a single histogram [4]. The MC simulation is then performed, generating a histogram of unfolding forces resulting from initial values ofkU(0) andxU. These values are then optimized until a good match is obtained to the exper-imental median unfolding force and the histogram distribution width. In a typical AFM single-molecule force spectroscopy experiment using a polyprotein chain, the number of unfolding events seen in a given force-extension trace will vary. This is because the polyprotein can be “picked up” in different ways in an experiment and may detach from the AFM cantilever before
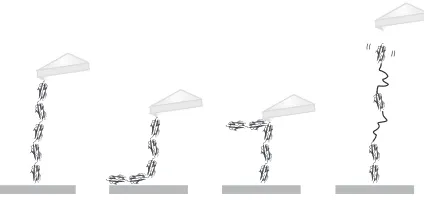
[image:3.608.89.516.71.347.2]FIG. 2. Four schematics depicting possible reasons why five unfolding events for (I27)5 polyprotein constructs are not always
seen, despite every polyprotein construct containing five domains of I27. In the first schematic, five unfolding events should be seen; in the second, due to two domains being attached nonspecifically to the surface, only three unfolding events will be seen; in the third schematic, only three domains are between the cantilever tip and the surface due to the position at which the polyprotein construct has been picked up; and in the fourth schematic, the polyprotein construct detaches from the cantilever tip before all of the I27 domains have unfolded.
unfolding of all domains has occurred. The most commonly seen traces have no unfolding events, and it is less probable to see a force-extension trace where allnunfolding events occur and a detachment peak is clearly seen. More often, we see force-extension traces where between one andn−1 unfolding events and a detachment peak are observed. Figure2illustrates the different possible reasons why fewer than n unfolding events are commonly observed.
In a recent study, a model-free numerical analysis was applied to experimental data to confirm that a polyprotein binds at a random position both to the substrate and to the AFM cantilever tip [55]. This results in an unequal unfolding probability distribution in the experiment. So, while the MC simulation that is used to model the data assumes an equal distribution of unfolding events, each experiment will have a unique distribution that is unlikely to be equal. Here, we complete single-molecule experiments on the polyprotein (I27)5 and measure the probability distribution of unfolding
events ranging from two to five domains. Next, we consider the effect of the number of unfolding events observed for a polyprotein on the measured unfolding force for each individual protein domain in the polyprotein chain at a range of pulling speeds. We then develop a MC simulation that incorporates the unequal unfolding probability distribution seen in the experiment, allowing us to determine the resulting uncertainty in the estimates ofkU(0) andxU.
II. MATERIALS AND METHODS A. AFM experiments
Single-molecule force spectroscopy experiments were per-formed using an Asylum MFP-3D AFM (Asylum Research, Santa Barbara, CA), using silicon nitride cantilevers with spring constants in the range 40.28±1.28 pN nm−1(Bruker,
CA). Cantilever spring constants were calibrated in buffer using the equipartition theorem [56,57].
The protein used was a double mutant of the I27 domain from human cardiac titin, where both cysteine residues were
mutated to serines, which will be referred to as I27 in this paper. (I27)5 polyprotein constructs were expressed and
purified according to methods described previously [58]. All domains in the protein constructs were assumed to be folded under the conditions used in the AFM experiments, based on characterization of the stability of (I27)5 described
elsewhere [58].
A total of 30–50 μl of 0.1 mg ml−1 protein solution in
sodium phosphate buffer (63 mM, pH 7.4) was applied onto a coverslip with a freshly stripped gold surface, and the polypro-teins immobilized on the surface by covalent attachment of the sulphydryl groups of two cysteine residues at the C-terminus of the polyprotein chain. After 15 min, the surface was flushed with fresh buffer to remove any unbound protein. Results are shown from mechanical unfolding experiments collected in triplicate at pulling speeds of 160, 400, 1000, and 2000 nm s−1.
B. Monte Carlo simulations
Monte Carlo (MC) simulations were performed in Igor Pro (Version 6, Wavemetrics, Lake Oswego, OR) using modifications to code previously developed to obtain estimates for the coarse parameters of the mechanical unfolding energy landscape for polyproteins containing two different protein domains [32]. Each protein domain is assumed to unfold via a two-state, all-or-none process, given by the following adaptation of the Zhurkov-Bell model:
kU(F)=Aexp[−(G∗U−F xU)/ kBT], (1)
where kU(F) is the force-dependent rate constant at the applied force,F;A is the attempt frequency or exponential prefactor (which is commonly given an estimated value of 106 s−1[59]),xU is the distance from the native folded state to the transition state along the measured reaction coordinate, G∗
U is the height of the free-energy barrier to unfolding, kB is Boltzmann’s constant, and T is temperature. In the simulation, as the distance between the cantilever and the substrate is increased at a constant velocity, the force applied to the polyprotein construct of contour length (LC) is recalculated using the wormlike-chain (WLC) model [60] at each time step, dt. The probability of unfolding is then calculated using
PU =NfkUexp (F xU/ kBT)dt, (2)
KATARZYNA M. TYCHet al. PHYSICAL REVIEW E91, 012710 (2015)
III. RESULTS
Single-molecule protein unfolding experiments using (I27)5 were completed at four different pulling speeds (160,
400, 1000, and 2000 nm s−1). Each experimental
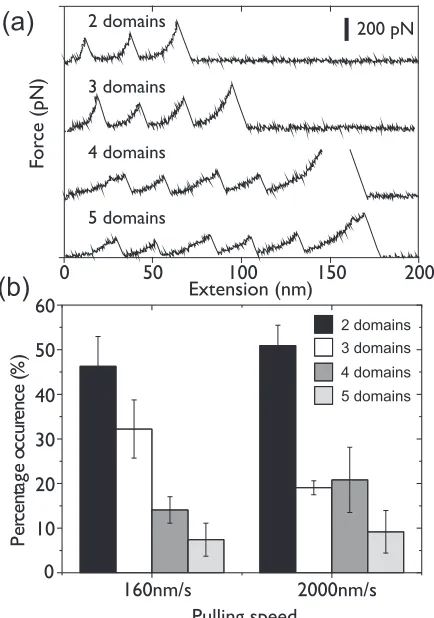
force-extension trace contains between one and five unfolding events. Figure3(a)illustrates examples of the force-extension traces measured when two, three, four, and five domains are unfolded. Figure 3(b) illustrates the percentage occurrence of unfolding different numbers of domains for pooled data from three separate experiments at a pulling speed of 160 and 2000 nm s−1 (i.e., how often two domains, three domains, four domains, and five domains are seen to unfold in a given experiment). Force-extension traces containing only single unfolding events were not included. This reduces the possibility of including nonspecific interaction events. From
FIG. 3. (a) Examples of experimental traces where two, three, four, and five individual domain unfolding events are seen. (b) The percentage occurrence of picking up and unfolding polyproteins with different numbers of domains in single-molecule force spectroscopy experiments using the (I27)5 construct. The number of protein
unfolding events at each pulling speed is 111 (160 nm s−1) and 268
(2000 nm s−1). The first bar (dark gray) indicates the frequency of
force-extension traces where two domains of I27 unfold, the second bar (white) indicates those where three domains unfold, the third bar (medium gray) where four unfold, and the fourth bar (light gray) where five unfold, where the percentage occurrence from the pooled data from three individual experiments is shown at each pulling speed. Error bars indicate the standard error in the percentages, indicating the level of variation in the percentages of each distribution of unfolding events between the three experiments.
Fig.3(b), it is clear that the probability of seeing two unfolding events in a force-extension trace is significantly higher than the probability of seeing five unfolding events. This is in contrast to the MC simulations typically used to fit the data from these experiments, where an equal probability of measuring between two and five unfolding events is assumed [32]. The unequal unfolding probability measured in Fig. 3(b)can be empirically modeled with the function (0.63)N at a pulling speed of 160 nm s−1, where N is the maximum number of unfolding events. This implies that the population of observed events decreases by 37% for each extra observed unfolding event. At a pulling speed of 2000 nm s−1, the population of
observed events decreases by 41% for each extra unfolding domain observed. The probability of picking up and unfolding shorter length polyprotein constructs is significantly larger than that of picking up and unfolding full length constructs, and it is in agreement with data collected using I27 polyprotein constructs using two types of cantilevers, namely glass and gold substrates, and using constructs with or without a terminal cysteine residue [61]. The effect of the variation in probability of picking up and unfolding different numbers of domains has also been observed in the analysis of single-molecule force spectroscopy data from force-clamp spectroscopic tech-niques [31,55]. Experiments using a polyprotein containing 12 domains observed an unequal unfolding probability and measured that the population of observed events decreased by 22% for each extra observed unfolding event [55].
Unequal unfolding probabilities could suggest that there are correlations in the system (memory) or the presence of alternate unfolding pathways and energy barriers. A previous study using single-molecule force-clamp spectroscopy mea-sured the kinetics of protein unfolding at a constant force and found that while the majority of the experimental data could be described by a single unfolding rate constant, the remainder could not, suggesting alternative unfolding barriers in the energy landscape of the protein [31]. Another single-molecule study examined the energy fluctuations in the unfolding energy landscape of a protein and a broad distribution of unfolding rates, implying large fluctuations in the energies of the folded protein [62]. In the present study, we examine the impact of the unequal unfolding distribution [Fig.3(b)] on the measured unfolding forces and the application of the Zhurkov-Bell model to extract unfolding energy landscape parameters. To do this, we next considered the importance of the protein unfolding event number on the measured unfolding force.
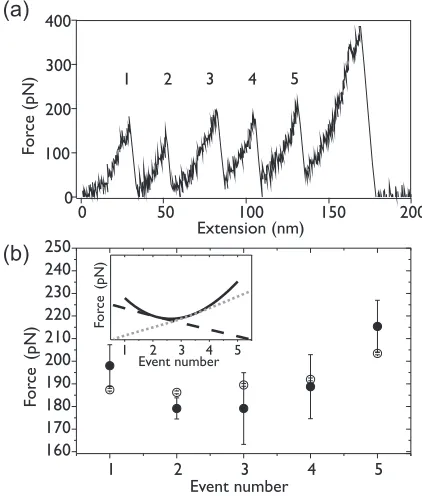
In Fig. 4(a), we show an example experimental force-extension trace for the unfolding of a full (I27)5 construct
with each individual unfolding event numbered from 1 to 5. For all experimental traces containing five unfolding events, we measured the unfolding force for each event number. Figure 4(b) shows an interesting relationship between the median unfolding force and the event number. It can be seen that the median unfolding force first decreases with event number before increasing again, with the lowest unfolding forces seen for events 2 and 3. This relationship has been reported previously [63], and it has been attributed to the “unfolding history” of the polyprotein chain. The unfolding history affects the measured mechanical resistance of a single protein domain in two ways: domain number (i.e., how many protein domains have already unfolded and how many remain folded), and the stiffness of the supramolecular scaffold (i.e.,
[image:5.608.63.280.270.579.2]FIG. 4. (a) An example sawtooth pattern for the unfolding of a full (I27)5 construct, with the individual unfolding event numbers
labeled. (b) The median unfolding forces for individual events as numbered in (a), from the unfolding of (I27)5constructs, experimental
data obtained at 2000 nm s−1(black, filled circles). Open circles: the
median simulated unfolding forces for 1000 full (I27)5 constructs,
separated by the event number, obtained from equal unfolding probability MC simulations. Error bars indicate the standard error of the forces. Inset: Schematic illustrating the minimum observed in the forces due to the balance between the two competing effects resulting from the unfolding history of the polyprotein chain, where the gray dotted line indicates the effect of a reduced probability of unfolding with increasing event number, and the black dashed line indicates the effect of increasing compliance with increasing event number.
a combination of the spring constant of the cantilever and the stiffness of the polyprotein chain after a given number of domains have unfolded). The result is two competing effects, both of which affect the loading rate on the folded domains in the chain: one that serves to increase the median unfolding force with increasing event number, and one that decreases it [Fig.4(b)(inset)]. First, with increasing event number there is a reduction in the number of folded protein domains in the polyprotein chain. The fewer protein domains that remain folded, the lower the probability that another protein domain will unfold at a given force. This results in an increase in the force required for an unfolding event to occur, thus the measured median unfolding force rises with event number [gray dotted line in Fig. 4(b) (inset)]. Secondly, as each protein domain unfolds, the total length of the polyprotein chain increases, which increases the overall compliance of the polyprotein. The compliance is the inverse of the effective spring constant, therefore a more compliant system yields a larger extension for a given force. As the compliance increases with event number, the force required to unfold each domain is reduced [black dashed line in Fig.4(b)(inset)] [63].
The changes in the domain number and compliance are both taken into account in the MC simulations, the latter by recal-culating the applied force using the WLC model at each time step in the MC simulations [Fig.4(b), empty symbols] [32]. These simulations use the assumption that there is an equal probability of picking up and unfolding any length of polypro-tein chain, from two domains up to five, through a nonspecific interaction between the tip and the polyprotein. However, this is clearly not the case experimentally [Fig. 3(b)], where an unequal unfolding probability distribution is measured. This could be problematic because a polyprotein chain of two domains will have a higher median unfolding force than a chain of five domains, despite the identity of each domain [58,63,64], because the compliance of a polyprotein chain containing two protein domains will always be lower than a longer chain containing more domains. This difference will therefore be more pronounced in longer polyprotein chains.
To determine the impact of an unequal unfolding probability distribution on the parameters obtained from the application of the Zhurkov-Bell model, we obtained an experimental data set for (I27)5 [Fig. 5(a)], and we used the data to fit
MC simulations in which there is (i) an unequal unfolding probability distribution and (ii) an equal unfolding probability distribution. The dataset comprises 12 experiments, three at each pulling speed of 160, 400, 1000, and 2000 nm s−1. Each
data point is the average value of the median unfolding forces from the three repeated experiments. The error bars on the experimental data points denote the standard error between the median unfolding forces of each experiment. A linear fit to the experimental data (solid black line) serves as the standard for comparing the quality of the MC simulation fits (dashed and dotted lines). A MC simulation was completed in which there was an equal unfolding probability distribution for the (I27)5 at each pulling speed (red dashed line). A
second MC simulation was completed in which there was an unequal unfolding probability distribution for the (I27)5at each
[image:6.608.64.275.73.321.2]KATARZYNA M. TYCHet al. PHYSICAL REVIEW E91, 012710 (2015)
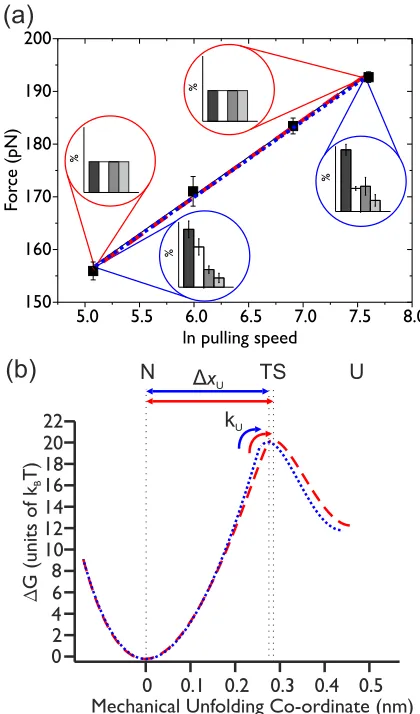
FIG. 5. (Color online) (a) Nonequal and equal unfolding proba-bility MC fits to experimental data for (I27)5. Black squares show
the mean values of the median unfolding forces obtained from three separate experiments at each pulling speed, where error bars indicate the standard error between the triplicates. The number of protein unfolding events at each pulling speed is 111 (160 nm s−1), 154
(400 nm s−1), 273 (1000 nm s−1), and 268 (2000 nm s−1). The solid
black line is a linear fit to the experimental data. The red dashed line shows the optimized fit from the equal unfolding probability distribution MC simulation, and the blue dotted line shows the optimized fit from the unequal unfolding probability distribution MC simulation. Both fits are very close to the fit to the experimental data. The probability weightings used in each simulation to match the experimental data are illustrated using the same format as in Fig.3(b). In the equal unfolding probability simulation, all unfolding event types (from two to five domains) have an equal probability of occurring. (b) Schematic of the difference between the estimate of the unfolding energy landscape using the parameters from the equal unfolding probability MC simulation (red dashed line) and those from the unequal unfolding probability MC simulation (blue dotted line). The equal unfolding probability MC simulation fit (red dashed line) gave values ofkU(0)=0.0011±0.0029 s−1andxU =
0.29±0.010 nm. The unequal unfolding probability MC simulation fit (blue dotted line) gave values ofkU(0)=0.0021±0.0006 s−1and
xU =0.28±0.0012 nm.
minimum acceptance criteria typically used in force extension experiments are justified and do not skew the calculation of
the unfolding energy landscape parameters. Using the method described in Sec. II, the value obtained for G∗
using the equal unfolding probability MC simulation fit was 20.63kBT, and for the unequal unfolding probability MC simulation it was 19.98kBT (using a value of 106 s−1for the prefactor,A) [59]. The resulting difference in the estimated unfolding energy landscape is shown in Fig. 5(b). As expected, there is little difference in the energy landscape parameters.
To further examine the impact of an unequal unfolding probability distribution on the application of the Zhurkov-Bell model, we completed two MC simulations for (I27)5
in which (i) all the domains in the polyprotein unfolded, (ii) only two domains in the polyprotein unfolded, and (iii) between two and five unfolding events took place. Cases (i) and (ii) represent the maximum and minimum number of unfolding events that fall within the acceptance criteria in the experimental analysis. Completing simulations for these different cases then allows the median unfolding forces to be obtained for the longest and shortest protein unfolding traces as well as the subsequent calculation of the error in the unfolding energy landscape parameters. MC simulations of protein unfolding were completed using fixed values ofkU(0) andxU, over a range of different pulling speeds (100, 200, 600, and 2000 nm s−1). Each simulation was completed to a
count of 1000 force-extension traces. There were not enough experimental data points to compare directly to this amount of simulated data, but the effect of domain number on unfolding force is clearly demonstrated using the simulated data. The kU(0) andxU values used were those previously published for I27, wherekU(0)=0.0015 s−1andxU =0.28 nm [9,58]. We make the assumption that in an experiment only two unfolding events are seen because the cantilever has picked the polyprotein chain up in such a position that there are only two folded protein domains and no unfolded domains between the tip and the surface. It is also possible for the polyprotein chain to become detached from the cantilever tip before more than two domains have time to unfold.
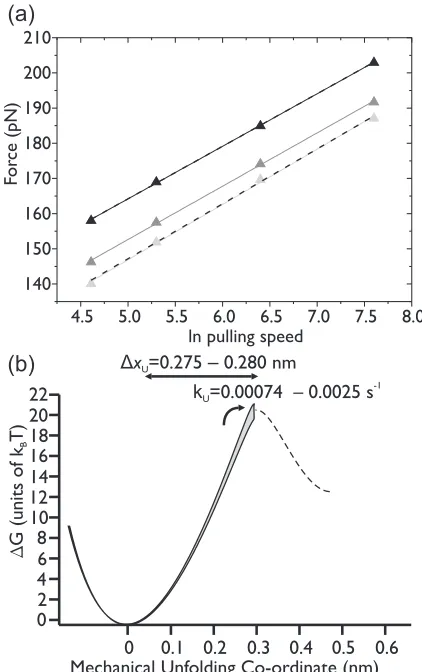
The resulting median unfolding force at each pulling speed was plotted against the natural logarithm of the pulling speed (Fig.6). It can be seen that over all pulling speeds, the highest unfolding forces are seen for simulations where only chains of two domains were picked up (Fig.6, black solid line), and the lowest unfolding forces are seen for simulations where only chains of five domains were picked up (Fig.6, light gray solid line). Intermediate forces are seen for the simulations in which there is an equal unfolding probability of picking up and unfolding any number of domains from two to five.
This result was expected [63,64]. However, in order to assess the implications of different distributions of the number of unfolded domains on the obtained model fits to the data [and therefore the resulting values ofkU(0) andxU], it is necessary to obtain a measure of how muchkU(0) andxU, obtained for an equal unfolding probability distribution simulation, have to be varied to fit the simulated data where only chains of two domains and only chains of five domains were picked up and unfolded. To obtain a measure of this, kU(0) and xU were varied in steps of two significant figures until the equal unfolding probability distribution simulation matched the two-domain simulation and the five-domain simulation unfolding forces [Fig. 6(a)]. The resulting values of kU(0) and xU are shown in Fig. 6(b). The uncertainty in xU
[image:7.608.65.275.74.431.2]FIG. 6. The simulated pulling speed dependence at speeds of 160, 400, 1000, and 2000 nm s−1, of the median unfolding force of I27 with
kU(0)=0.0015 s−1andxU =0.28 nm, for 1000 force-extension
traces, where two I27 domains unfold every time (black triangles); two, three, four, or five I27 domains unfold with an equal probability (gray triangles); or five I27 domains unfold every time (light gray triangles). Solid lines indicate fits to the data. It can be seen that the unfolding forces for traces where only two domains unfold are the highest, followed by the mixed traces. The traces where only five domains unfolded yield the lowest forces. Dashed lines show the fits where kU(0) and xU were varied for the case in which
each force-extension trace type is equally probable, until the linear dependence of the unfolding force on the pulling speed matched that obtained for the two extreme cases. (b) The level of uncertainty in the estimation of the unfolding energy landscape of I27 obtained from simulations is shown as a gray band. The range of values results from different unfolding sequences, from the extreme of only picking up chains where two unfolding events can be seen, up to the other extreme where only five unfolding events are seen.
is not large: it varies by 0.005 nm, while the uncertainty inkU(0) is greater (approximately one order of magnitude). Nevertheless, for single-molecule experiments of this type, the level of experimental uncertainty and error is already high, due to thermal noise fluctuations of the cantilever [56,57] and sensitivity to differences between individual cantilevers [29]. Furthermore, this approach is routinely used to measure small changes in xU and kU(0), induced by changes in temperature [10] or single-point mutations [32], for example. Therefore, reducing the level of uncertainty introduced at the data analysis stage is important.
Clearly, the cases in which only force-extension traces where two-domain polyproteins are picked up and unfolded or only five-domain polyprotein chains are picked up and unfolded in a single experiment are highly unlikely, but this example illustrates the extremes of the uncertainty bounds. To avoid introducing this uncertainty entirely, it is possible to use the experimentally derived unfolding distribution to inform the MC simulation. This unequal unfolding probability MC simulation will then give more accurate values ofkU(0) and xU for the experimental data, as the simulated data set will be more closely matched to the experimental data set.
IV. DISCUSSION AND CONCLUSION
In single-molecule force spectroscopy experiments using polyprotein chains, the probability of picking up the full polyprotein chain on each approach/retraction of the AFM cantilever tip is very low. In fact, different chain lengths are picked up and unfolded, and the probabilities of picking up each chain length are not equal [Fig. 3(b)]. As a result of the domain number contribution to the unfolding history effect, shorter chain lengths result in higher median unfolding forces than longer chain lengths, meaning that for a given set of experimental conditions, depending on the distribution of numbers of unfolding events on any given day, the median unfolding force may vary significantly. We have demonstrated the significance of considering the probability of picking up and unfolding polyprotein chains of different lengths when using MC simulations to extract estimates of the parameters governing the unfolding energy landscape of the protein stud-ied,kU(0) andxU. In the example given, the changes between kU(0), xU, andG∗ obtained from the equal and unequal unfolding probability distribution simulations were small. Despite this, the differences can be of the same magnitude as the changes inkU(0),xU, andG∗ resulting from a single point mutation, ligand binding, or a change in the pulling direction applied to a protein domain. Therefore, the use of this method is very important in the analysis of single-molecule force spectroscopy studies of such subtle effects. This result will vary depending on the compliance of the protein domain used, the length of the polyprotein chain, and whether the chain consists of a single domain type or a mixture of different protein domains. For example, if a polyprotein construct of 5 I27 domains is used but only traces with two or three unfolding events are seen, the median unfolding force between the equal unfolding probability case and the experimentally measured unequal unfolding probability distribution at 2000 nm s−1
KATARZYNA M. TYCHet al. PHYSICAL REVIEW E91, 012710 (2015)
polyprotein constructs of different lengths. We have developed a modified MC simulation that enables the user to input the probability of picking up and unfolding polyprotein chains of different lengths, for a given experimental data set, in order to minimize the level of uncertainty in the values ofkU(0) and xU that they obtain from the simulation.
ACKNOWLEDGMENTS
L.D. is supported by a grant from the European Research Council (258259-EXTREME BIOPHYSICS). We would like to thank Peter Olmsted, Emanuele Paci, and all members of the Dougan group for useful discussions and feedback.
[1] M. Rief, M. Gautel, F. Oesterhelt, J. Fernandez, and H. Gaub, Reversible unfolding of individual titin immunoglobulin domains by AFM,Science276,1109(1997).
[2] A. Borgia, P. M. Williams, and J. Clarke, Single-molecule studies of protein folding,Annu. Rev. Biochem.77,101(2008). [3] J. Huguet, C. Bizarro, N. R. Forns, S. Smith, C. Bustamante, and F. Ritort, Single-molecule derivation of salt dependent base-pair free energies in DNA,Proc. Natl. Acad. Sci. USA107,15431 (2010).
[4] T. Hoffmann and L. Dougan, Single molecule force spectroscopy using polyproteins,Chem. Soc. Rev.41,4781(2012). [5] T. Bu, H.-C. E. Wang, and H. Li, Single molecule force
spec-troscopy reveals critical roles of hydrophobic core packing in determining the mechanical stability of protein GB1,Langmuir 28,12319(2012).
[6] H. C. Kotamarthi, R. Sharma, and S. R. K. Ainavarapu, Single-molecule studies on polysumo proteins reveal their mechanical flexibility,Biophys. J.104,2273(2013).
[7] G. Zoldak and M. Rief, Force as a single molecule probe of multidimensional protein energy landscapes,Curr. Opin. Struct. Biol.23,48(2013).
[8] P. E. Marszalek and Y. F. Dufrˆene, Stretching single polysaccha-rides and proteins using atomic force microscopy,Chem. Soc. Rev.41,3523(2012).
[9] T. Hoffmann, K. Tych, D. Brockwell, and L. Dougan, Single-molecule force spectroscopy identifies a small cold shock protein as being mechanically robust, J. Phys. Chem. B117, 1819(2013).
[10] K. Tych, T. Hoffmann, D. Brockwell, and L. Dougan, Single molecule force spectroscopy reveals the temperature-dependent robustness and malleability of a hyperthermophilic protein, Soft Matter9,9016(2013).
[11] O. Farrance, E. Hann, R. Kaminska, N. Housden, S. R. Derrington, C. Kleanthous, S. Radford, and D. Brockwell, A force-activated trip switch triggers rapid dissociation of a colicin from its immunity protein,PLoS Biol.11,e1001489(2014). [12] F. Bartels, B. Baumgarth, D. Anselmetti, R. Ros, and A.
Becker, Specific binding of the regulatory protein expg to promoter regions of the galactoglucan biosynthesis gene cluster of sinorhizobium meliloti–a combined molecular biology and force spectroscopy investigation,J. Struct. Biol.143,145(2003). [13] F. Rico and V. Moy, Energy landscape roughness of the streptavidin-biotin interaction,J. Mol. Recog.20,495(2007). [14] X. Hu and H. Li, Force spectroscopy studies on protein–ligand
interactions: A single protein mechanics perspective,FEBS Lett. 588,3613(2014).
[15] H. C. Kotamarthi, R. Sharma, S. Narayan, S. Ray, and S. R. K. Ainavarapu, Multiple unfolding pathways of leucine binding protein (LBP) probed by single-molecule force spec-troscopy (SMFS),J. Am. Chem. Soc.135,14768(2013).
[16] Y. Taniguchi and M. Kawakami, Variation in the mechan-ical unfolding pathway of p53DBD induced by interaction with p53 N-terminal region or DNA,PLoS ONE 7, e49003 (2012).
[17] J. P. Junker, F. Ziegler, and M. Rief, Ligand-dependent equilib-rium fluctuations of single calmodulin molecules,Science323, 633(2009).
[18] Y. Cao, M. M. Balamurali, D. Sharma, and H. Li, A func-tional single-molecule binding assay via force spectroscopy, Proc. Natl. Acad. Sci. USA104,15677(2007).
[19] E. M. Puchner and H. E. Gaub, Force and function: probing proteins with afm-based force spectroscopy,Curr. Opin. Struct. Biol.19,605(2009).
[20] C. Bustamante, S. Smith, J. Liphardt, and D. Smith, Single-molecule studies of dna mechanics,Curr. Opin. Struct. Biol.10, 279(2000).
[21] C. Gosse and V. Croquette, Magnetic tweezers: Microma-nipulation and force measurement at the molecular level, Biophys. J.82,3314(2002).
[22] K. Neuman and A. Nagy, Single-molecule force spectroscopy: optical tweezers, magnetic tweezers and atomic force mi-croscopy,Nat. Meth.5,491(2008).
[23] E. Evans, K. Ritchie, and R. Merkel, Sensitive force technique to probe molecular adhesion and structural linkages at biological interfaces,Biophys. J.68,2580(1995).
[24] M. Carrion-Vazquez, A. Oberhauser, S. Fowler, P. Marszalek, S. Broedel, J. Clarke, and J. Fernandez, Mechanical and chemical unfolding of a single protein: A comparison,Proc. Natl. Acad. Sci. USA96,3694(1999).
[25] V. Aggarwal, S. R. Kulothungan, M. M. Balamurali, S. R. Saranya, R. Varadarajan, and S. R. K. Ainavarapu, Ligand-modulated parallel mechanical unfolding pathways of maltose-binding proteins,J. Biol. Chem.286,28056(2011).
[26] H. Dietz and M. Rief, Protein structure by mechanical triangu-lation,Proc. Natl. Acad. Sci. USA103,1244(2006).
[27] P. Zheng, Y. Cao, and H. Li, Facile method of constructing polyproteins for single-molecule force spectroscopy studies, Langmuir27,5713(2011).
[28] G. Yang, C. Cecconi, W. Baase, I. Vetter, W. Breyer, J. Haack, B. Matthews, F. Dahlquist, and C. Bustamante, Solid-state synthesis and mechanical unfolding of polymers of t4 lysozyme, Proc. Natl. Acad. Sci. USA97,139(2000).
[29] R. Best, D. Brockwell, J. L. Toca-Herrera, A. Blake, D. Smith, S. Radford, and J. Clarke, Force mode atomic force microscopy as a tool for protein folding studies,Anal. Chim. Acta479,87 (2003).
[30] S. Garcia-Manyes, J. Brujic, C. Badilla, and J. Fernandez, Force-clamp spectroscopy of single-protein monomers reveals the individual unfolding and folding pathways of i27 and ubiquitin,Biophys. J.93,2436(2007).
[31] J. Bruji´c, R. Hermans, S. Garcia-Manyes, K. Walther, and J. Fernandez, Dwell-time distribution analysis of polyprotein unfolding using force-clamp spectroscopy,Biophys. J.92,2896 (2007).
[32] D. Sadler, E. Petrik, Y. Taniguchi, J. Pullen, M. Kawakami, S. Radford, and D. Brockwell, Identification of a mechanical rheostat in the hydrophobic core of protein l,J. Mol. Biol.393, 237(2009).
[33] G. Bell, Models for the specific adhesion of cells to cells,Science 200,618(1978).
[34] C. Jarzynski, Nonequilibrium equality for free energy differ-ences,Phys. Rev. Lett.78,2690(1997).
[35] G. E. Crooks, Path-ensemble averages in systems driven far from equilibrium,Phys. Rev. E61,2361(2000).
[36] G. Hummer and A. Szabo, Free energy reconstruction from nonequilibrium single-molecule pulling experiments, Proc. Natl. Acad. Sci. USA98,3658(2001).
[37] R. B. Best, E. Paci, G. Hummer, and O. K. Dudko, Pulling direction as a reaction coordinate for the mechanical unfolding of single molecules,J. Phys. Chem. B112,5968(2008). [38] O. K. Dudko, T. G. W. Graham, and R. B. Best, Locating the
barrier for folding of single molecules under an external force, Phys. Rev. Lett.107,208301(2011).
[39] O. K. Dudko, G. Hummer, and A. Szabo, Theory, analy-sis, and interpretation of single-molecule force spectroscopy experiments, Proc. Natl. Acad. Sci. USA 105, 15755 (2008).
[40] D. K. West, P. D. Olmsted, and E. Paci, Free energy for protein folding from nonequilibrium simulations using the jarzynski equality,J. Chem. Phys.125,204910(2006).
[41] C. Hyeon and D. Thirumalai, Can energy landscape rough-ness of proteins and rna be measured by using mechanical unfolding experiments?Proc. Natl. Acad. Sci. USA100,10249 (2003).
[42] C. Hyeon and D. Thirumalai, Measuring the energy landscape roughness and the transition state location of biomolecules using single molecule mechanical unfolding experiments, J. Phys.: Condens. Matter19,113101(2007).
[43] T. Hoffmann, K. M. Tych, M. L. Hughes, D. J. Brockwell, and L. Dougan, Towards design principles for determining the mechanical stability of proteins,Phys. Chem. Chem. Phys.15, 15767(2013).
[44] H. Ahmadzadeh, D. H. Smith, and V. B. Shenoy, Viscoelasticity of tau proteins leads to strain rate-dependent breaking of microtubules during axonal stretch injury: Predictions from a mathematical model,Biophys. J.106,1123(2014).
[45] J. Chung, A. M. Kushner, A. C. Weisman, and Z. Guan, Direct correlation of single-molecule properties with bulk mechanical performance for the biomimetic design of polymers, Nat. Mater. 1, 1 (2014).
[46] P. O. Heidarsson, M. M. Naqvi, M. R. Otazo, A. Mossa, B. B. Kragelund, and C. Cecconi, Direct single-molecule ob-servation of calcium-dependent misfolding in human neuronal calcium sensor-1, Proc. Natl. Acad. Sci. USA 111, 13069 (2014).
[47] S. Kawamura, M. Gerstung, A. T. Colozo, J. Helenius, A. Maeda, N. Beerenwinkel, P. S. H. Park, and D. J. Muller, Kinetic, energetic, and mechanical differences between dark-state rhodopsin and opsin, structure, Structure 21, 426 (2014).
[48] V. Ramanujam, H. C. Kotamarthi, and S. R. K. Ainavarapu, Ca2+
binding enhanced mechanical stability of an archaeal crystallin, PLoS ONE9,e94513(2014).
[49] F. Rico, L. Gonzalez, I. Casuso, M. Puig-Vidal, and S. Scheuring, High-speed force spectroscopy unfolds titin at the velocity of molecular dynamics simulations,Science342,741 (2013).
[50] L. Rognoni, T. Most, G. Zoldak, and M. Rief, Force-dependent isomerization kinetics of a highly conserved proline switch modulates the mechanosensing region of filamin,Proc. Natl. Acad. Sci. USA111,5568(2014).
[51] S. Santini, S. Di Agostino, E. Coppari, A. R. Bizzarri, G. Blandino, and S. Cannistraro, Interaction of mutant p53 with p73: A surface plasmon resonance and atomic force spectroscopy study, Biochem. Biophys. Acta 1840, 1958 (2014).
[52] F. W. S. Stetter, L. Cwiklik, P. Jungwirth, and T. Hugel, Single lipid extraction: The anchoring strength of cholesterol in liquid-ordered and liquid-disliquid-ordered phases,Biophys. J. 107, 1167 (2014).
[53] A. M. Whited and P. S. H. Park, Atomic force microscopy: A multifaceted tool to study membrane proteins and their interactions with ligands, Biochem. Biophys. Acta 1838, 56 (2014).
[54] M. Lowndes, S. Rakshit, O. Shafraz, N. Borghi, R. M. Harmon, K. J. Green, S. Sivasankar, and W. J. Nelson, Different roles of cadherins in the assembly and structural integrity of the desmosome complex,J. Cell Sci.127,2339(2014).
[55] R. Hermans, Probability of observing a number of unfold-ing events while stretchunfold-ing polyproteins,Langmuir 30, 8650 (2014).
[56] H. Butt and M. Jaschke, Calculation of thermal noise in atomic force microscopy,Nanotechnology6,1(1995).
[57] E. Florin, M. Rief, H. Lehmann, M. Ludwig, C. Dornmair, V. Moy, and H. Gaub, Sensing specific molecular interactions with the atomic force microscope,Biosens. Bioelectron.10,895 (1995).
[58] D. Brockwell, G. Beddard, J. Clarkson, R. Zinober, A. Blake, J. Trinick, P. D. Olmsted, D. Smith, and S. Radford, The effect of core destabilization on the mechanical resistance of i27, Biophys. J.83,458(2002).
[59] M. S. Li, D. K. Klimov, and D. Thirumalai, Thermal denatura-tion and folding rates of single domain proteins: Size matters, Polymer45,573(2004).
[60] J. Marko and E. Siggia, Stretching dna,Macromolecules28, 8759(1995).
[61] Z. Scholl and P. Marszalek, Improving single molecule force spectroscopy through automated real-time data collection and quantification of experimental conditions,Ultramicroscopy136, 7(2014).
[62] J. Brujic, R. I. Hermans, K. A. Walther, and J. M. Fernandez, Single-molecule force spectroscopy reveals signatures of glassy dynamics in the energy landscape of ubiquitin,Nat. Phys.2,282 (2006).
[63] R. Zinober, D. Brockwell, G. Beddard, A. Blake, P. Olmsted, S. Radford, and D. Smith, Mechanically unfolding proteins: The effect of unfolding history and the supramolecular scaffold, Protein Sci.11,2759(2002).