This is a repository copy of A review of the state-of-the-science relating to secondary
particulate matter of relevance to the composition of the UK atmosphere : Full technical
report to Defra, project AQ0732..
White Rose Research Online URL for this paper:
http://eprints.whiterose.ac.uk/92381/
Version: Published Version
Monograph:
McFiggans, Gordon B., Alfarra, M. Rami, Allan, James et al. (7 more authors) (2015) A
review of the state-of-the-science relating to secondary particulate matter of relevance to
the composition of the UK atmosphere : Full technical report to Defra, project AQ0732.
Research Report. Defra
[email protected] https://eprints.whiterose.ac.uk/ Reuse
Items deposited in White Rose Research Online are protected by copyright, with all rights reserved unless indicated otherwise. They may be downloaded and/or printed for private study, or other acts as permitted by national copyright laws. The publisher or other rights holders may allow further reproduction and re-use of the full text version. This is indicated by the licence information on the White Rose Research Online record for the item.
Takedown
If you consider content in White Rose Research Online to be in breach of UK law, please notify us by
A review of the state-of-the-science
relating to secondary particulate matter
of relevance to the composition of the
UK atmosphere
(Defra Project AQ0732 – Understanding Secondary Inorganic and
Organic Aerosol)
Report to Department for Environment, Food and Rural Affairs (Defra)
2015
This document has been prepared by:
1
Centre for Atmospheric Science, School of Earth, Atmospheric & Environmental Sciences, University of Manchester, Manchester, M13 9PL
In association with:
2
National Centre for Atmospheric Science (NCAS) 3
Wolfson Atmospheric Chemistry Laboratories,Department of Chemistry, University of York, Heslington, York, YO10 5DD
4
School of Geography, Earth & Environmental Sciences, Division of Environmental Health & Risk Management, University of Birmingham, Edgbaston, Birmingham, B15 2TT
5
Atmospheric Chemistry Services, Oakhampton, Devon, EX20 4QB.
This document reflects the views of its authors and not those of Defra and its partners.
All information contained in this document is correct as of 2013.
Please cite this document as:
A review of the state-of-the-science relating to secondary
particulate matter of relevance to the composition of the
UK atmosphere
Context and Scope
A number of legislative approaches are being taken to control exposure to Particulate Matter (PM) in order to achieve UK 2005 24-hour and annual AQ standards for PM10 (PM with
diameter less than 10 µm) and subsequent EU 2010 and 2015 and UK 2010 PM2.5 (fine
particulate matter, with diameter less than 2.5 µm) targets. These include vehicle, industrial and source emission controls and those introduced by local authorities. The UK has set national air quality objectives to comply with European Directive limit and target values of PM10 (and PM2.5 from 2020) for the protection of human health. These can be found at
http://uk-air.defra.gov.uk/documents/National_air_quality_objectives.pdf. From 2015 there is an EU-wide urban background 3-year average exposure concentration obligation (ECO) of 20 g m-3 and from 2020 an average exposure indicator (AEI) reduction target based on the 2010 measured AEI. AEI is determined as a 3-year running annual mean PM2.5
concentration averaged over the selected monitoring stations in agglomerations and larger urban areas, set in urban background locations to best assess the PM2.5 exposure to the
general population. PM2.5 comprises both primary and secondary contributions. Since direct
primary emissions are more readily understood, increased quantitative understanding of the inorganic and organic fractions of secondary aerosol is necessary to help the UK meet these targets.
In addition to any control of primary particulate matter, the National Emission Ceilings Directive (NECD) (2001/81/EC) sets emission ceilings to be achieved from 2010 onwards for each Member State for the same 4 pollutants as in the 1999 Protocol to Abate Acidification, Eutrophication and Ground-level Ozone (the Gothenburg Protocol); sulphur dioxide (SO2),
nitrogen oxides (NOx), non-methane volatile organic compounds (NMVOCs), and ammonia
(NH3). These are of direct relevance, being precursors to secondary aerosol as well as
ozone. The Convention on Long-range Transboundary Air Pollution, LRTAP adopted amendments to the Gothenburg Protocol in 2012 to introduce emission reduction commitments for 2020 and beyond for the controlled pollutants. Based on a review of EU air policy, in December 2013 the Commission adopted a new Clean Air Programme for Europe with air quality objectives for the period up to 2030, a revised NECD with stricter emission ceilings for six main pollutants, and a proposal for a new Directive to reduce pollution from medium-sized combustion installations. The revised NECD includes new national emission reduction commitments applicable from 2020 and 2030 for SO2, NOx, NMVOC, NH3, PM2.5
and CH4 and intermediate emission levels for the 2025 applicable to the same pollutants.
Whilst of direct relevance to secondary aerosol, natural biogenic NMVOC emissions are highly uncertain and not readily controlled by conventional legislative instruments.
In its 2009 report, the Committee on the Medical Effects of Air Pollutants (COMEAP) focussed on particulate matter, represented as PM2.5, as the air pollutant most strongly
associated with increased risks of mortality. In 2010, using the same data as the report, the impact of human-made PM2.5 on the mortality of the UK population, was estimated as a loss
of 340,000 years of life in 2008, an effect equivalent to 29,000 deaths. COMEAP speculated that this effect was most likely manifested as a smaller contribution to the earlier deaths of up to 200,000 people. The burden can also be represented as a loss of life expectancy from birth of 6 months (as an average across all births). It was predicted that if the annual average concentration of PM2.5 were reduced by 1 microgram per cubic metre, there would
particulate matter would lead to a predicted gain of 36.5 million life years over the same time period; an increase in life expectancy from birth of 6 months.
This legislative and public health setting provides the backdrop for the subject of this review. Particulate matter can either be directly emitted as liquid or solid material from a variety of sources, or be formed in the atmosphere from primary pollutants. The latter, so-called secondary aerosol is generated by the transfer of material, either inorganic or organic, from the vapour to the aerosol phase following the chemical processing of emitted gaseous precursor pollutants. A number of processes therefore contribute to secondary aerosol formation, including the emission of precursor species and multiphase chemical and physical processes.
Ammonium sulphate and ammonium nitrate, the major contributors to secondary inorganic aerosol (SIA) are formed by the atmospheric oxidation and reaction of precursor gases (SO2,
NOx) and subsequent reaction with NH3 and comprise a major component of fine particulate
matter. The much more diverse but no less substantial, secondary organic aerosol (SOA) components are formed by the atmospheric oxidation of precursor gases (e.g.VOCs) emitted from both man-made and natural sources. The mass of organic matter in particulate is significantly enhanced in polluted regions worldwide but the source of organic matter in these areas is currently unknown. The profile of the emission of man-made VOC precursors may be subject to changes in response to legislative controls. Natural emissions may change with environmental conditions and with changes to land-use or biota.
Largely because of the complexity of both the emitted precursors and of the formation and transformation processes, the secondary component of atmospheric particulate matter is diverse and variable and is the most difficult fraction to quantitatively predict or unambiguously quantify from measurements. Furthermore, owing to the long distances over which both precursors and particles may be transported, the mixture of sources contributing to the secondary component is highly variable and dependent on meteorological conditions. The targets required to meet the forthcoming EU and UK legislative obligation to reduce exposure to particulate matter will be difficult to realise without addressing the substantial contribution from secondary matter. It is therefore important to understand how secondary aerosol formation and transformation depends on the emissions and fundamental processes.
Policy Summary
Particulate matter (PM) is the term used to describe condensed phase (solid or liquid) particles suspended in the atmosphere. PM may be directly emitted into the atmosphere (termed primary particles) or formed by the reaction of atmospheric gases (secondary particles). Largely because of the complexity of both the emitted precursors and of the formation and transformation processes, the secondary component of atmospheric particulate matter is diverse and variable. It is the most difficult fraction of PM to quantitatively predict or unambiguously quantify from measurements. It will be difficult to achieve the targets required to meet the forthcoming EU and UK legislative obligation to reduce exposure to particulate matter without reducing secondary particulate matter concentrations.
The aim of this report is to provide Defra with a review of existing evidence regarding the contribution of Secondary Organic Aerosol (SOA) and Secondary Inorganic Aerosol (SIA) to PM concentrations. The work aims to identify and prioritise any knowledge gaps relevant to UK air quality policy and make recommendations for further studies which are required to fill the evidence gaps identified.
The contributions of SIA/SOA to PM2.5 are highly variable and dependent on location. As a
broad estimate, secondary aerosol might be expected to contribute roughly half of roadside PM2.5, increasing to the majority (of the order of 90%) of rural PM2.5, with the urban
background contribution lying between these values, depending on location, meteorology and season.
Ammonium sulphate and ammonium nitrate, the major contributors to SIA are formed by the atmospheric oxidation and reaction of precursor gases (sulphur dioxide, SO2 and nitrogen
oxides, NOx) and subsequent reaction with ammonia (NH3). SIA is a major component of fine
particulate matter in the UK. Emissions of SIA precursors are generally well established and reasonably well quantified both in the UK and in Europe.
The Acid Gas and Aerosol Network provides good coverage of the UK measuring the main SIA components, but the inlets have not been characterised so measurements are not fully quantitative. This limits the data from which reliable spatial distributions, temporal trends and fractional contributions to particulate mass can be derived. At the two Defra monitoring sites that measure both total PM2.5 mass and SIA components, North Kensington and
Auchencorth Moss, the mean monthly percentage contributions show that in 2009 SIA made up between 25% and 100% of measured PM2.5. Nitrate generally dominates SIA and there
has been no discernable trend in total average nitrate from 2000 – 2009.
Models capture the order of magnitude of SIA but it is unclear whether they capture the non-linear response of SIA concentrations to changes in precursor emissions. It appears that model studies are inconsistent in their sensitivities, some predicting greatest sensitivity to SO2 abatement, others to NH3 abatement. There is a need to represent the high spatial and
temporal variability of ammonia emissions through flux measurements and inclusion in emission inventories, and to evaluate the effect of such variability on SIA formation. There is an urgent need to understand, if not reconcile, the divergent predicted dependencies of SIA on precursor emissions. Model evaluation (and if necessary representation improvement) of SIA processes is required to reproduce the non-linear responses of SIA to reduced precursor emissions and to fully resolve the contributory processes. The representation and roles of NH3 and of gaseous versus aqueous sulphate production require particular attention.
Model emission of primary sulphate should be clearly reported and considered when attributing emission sensitivities. NOx emissions from international shipping are projected to
Organic aerosol (primary and secondary) frequently forms the dominant fraction of fine particulate matter in the atmosphere. However, measurements indicate that models poorly predict organic aerosol concentrations and underestimate the contribution made by SOA particularly in polluted regions. SOA forms when volatile organic compounds (VOCs), both natural and man-made, undergo gas phase oxidation reactions, forming products that preferentially exist as a liquid or solid rather than a gas either forming new particles or condensing onto pre-existing particles.
Recent studies of the volatility (the tendency of a substance to vaporise, that is to become a gas) of emitted particles have blurred the distinctions between the primary and secondary organic aerosol categories. Under ambient conditions some of the primary particulate matter emissions from combustion can evaporate. The vapours produced undergo oxidation, producing previously unrecognised semi-volatile and intermediate volatility compounds (S/IVOC). These S/IVOCs may be a substantial additional source of SOA. There are still large uncertainties in the concentrations, reaction rates, and SOA yields of S/IVOC precursors. Emissions from biomass burning are gaining attention as a potentially important source of these new compounds and consequently SOA, although field and laboratory studies show highly variable results. Laboratory studies of emission factors for the range of burners used in the UK, including consideration of IVOCs and SVOCs, would improve characterisation and quantification of biomass burning emissions.
The highest priority evidence need is the identification and quantification of the most effective biogenic and anthropogenic SOA precursors. This would include an assessment of the reliability of estimates of IVOC, SVOC and conventional precursor effectiveness, which could be done using chamber measurements under representative conditions where necessary. This is a huge undertaking and will require international collaboration to achieve. Some of this work has been made possible by EU network activities such as EUROCHAMP but the funding period for this network is now over. Enhanced speciated source strengths of anthropogenic VOC emissions targeted to the most effective SOA precursors (including IVOCs and SVOCs) should be included in inventories. There are recently funded UK projects that will contribute to this however the outputs will not be available for a number of years.
The current level of understanding of SOA formation is low. Initially the newly recognised, potentially important, IVOC and SVOC compounds need to be measured. A reliable technique for routine monitoring of chemically-resolved volatility needs to be developed. Such measurements are extremely challenging and will require substantial effort from the current state of the science. There are promising techniques, though it is not currently clear that the science or technology are sufficiently advanced to do this comprehensively, routinely or even successfully. Improved measurements will facilitate the necessary inclusion of some representation of IVOC and SVOC particulate matter precursors in atmospheric models. In the relatively short-term, the most promising approach is to use what are known as lumped representations of these sets of compounds. Lumped representations allow compounds that are sufficiently similar to be represented by one species with properties that are considered reasonably representative of the whole group. This greatly reduces the complexity of the model.
Models that are not tuned to chamber simulations do not replicate SOA mass loadings and tuned models can give very different predicted sensitivities to environmental conditions. Large-scale models using SOA parameterisations that are tuned to fit with measurements of SOA and its precursors in studies carried out in atmospheric chambers perform better in clean biogenic regions, but fail to capture anthropogenic enhancements to SOA mass and generally under predict in polluted regions. It is unclear that any models predict NOx, oxidant,
temperature or meteorological dependencies well. Models suggest that non-linear interactions exist between reductions in either NOx or anthropogenic VOCs, or both, and
PM2.5 SOA. Depending on the model representation and tuning, reductions in NOx can
preferentially increase either biogenic SOA or anthropogenic SOA. Non-UK chemistry-climate feedback studies suggest that an increase in temperature can significantly increase biogenic SOA. There is no central source of UK or EU biogenic VOC emissions information and the huge temporal and spatial variability, and lack of meaningful speciation makes their inclusion in models challenging. Also, factors (such as temperature, light and stress) affecting the release of effective biogenic SOA precursors are poorly understood. A more complete speciation of biogenic VOC emissions is required, targeted towards the most effective SOA precursors.
From a policy perspective the chemical origin of SOA is probably unimportant; the consideration is whether reduction in anthropogenic emissions will beneficially affect SOA loadings. Further chamber studies are necessary to probe the sensitivity of biogenic SOA to anthropogenic VOC reductions, and of both anthropogenic and biogenic SOA to NOx
reductions. Models with a range of SOA representations should be evaluated against the observed dependencies. The concept of biogenic and anthropogenic SOA is not scientifically well justified; the separation can be defined in terms of the biogenic or anthropogenic origin of the precursors of SOA or in terms of the formation of SOA under biogenically- or anthropogenically-dominated atmospheres. Currently it is not understood how or why SOA displays a dependence on anthropogenic input so assessment of the relative importance of biogenic and anthropogenic emissions is not possible. The lack of mechanistic understanding precludes the prediction of effective mitigation measures. Where literature studies exist, the majority consider the dominant precursors to be biogenic VOCs. There is, however, a persuasive argument that this conclusion may result from the high-yield anthropogenic VOCs being extremely difficult to quantify. Owing to the lack of empirical data and reliable predictive capability, it is unclear whether, and by how much, SOA concentrations in the UK would reduce in response to a reduction in anthropogenic VOCs. A high priority recommendation is to explore the parameter sensitivity of UK SOA predictions using a range of representations to identify those that behave ‘most physically’. This is a complex issue; tuned models may capture observations in specific situations well but their predictive capability is reduced by the lack of physical basis for the tuned parameters. Model exploitation of emergent UK networks data, European network measurements and intensive case study data should be encouraged using both online (chemical mechanism coupled to meteorological model) and offline (meteorological model output fed into chemical mechanism but no chemical feedbacks to meteorological model) models in investigations of long-term SOA and SIA relationships. UK sensitivity studies should be conducted using a range of physically reasonable models to evaluate relative contributions to SOA by anthropogenic and biogenic emissions.
Since secondary aerosol is formed from primary precursors, there is a strong need for coordination of network measurements of major primary precursors and SIA and SOA. It will benefit the move to UK compliance with EU directives on daily PM exposure levels to commit to long-term monitoring of the major secondary contributors to PM2.5 on time scales
semicontinuous analysers (measuring both inorganic and organic carbon/elemental carbon) with reliable, characterised inlets or Aerosol Chemical Speciation Monitors (ACSM), coupled to a comparison of numerical analytical techniques, is essential in identification of areas of uncertainty/disagreement in derivation of the relative contribution of SOA and SIA to PM concentrations. It should be noted that the ACSM does not currently measure PM2.5 but
transmits and measures components closer to PM1 presenting challenges to interpretation in the context of the PM2.5 criterion.
With current evidence, it is not straightforward to draw conclusions about relative impacts of UK and non-UK, or anthropogenic and biogenic emissions on SIA or SOA formation; this would require incorporation of reliable emissions data into appropriate models. Setting UK data in context of European network data with model interpretation could provide evidence for transboundary contributions to the SIA and SOA fractions. There are also ground-based and airborne intensive datasets, which could be used. There are too few sites that measure all relevant parameters to derive clear measurement-based relationships between SOA or SIA and precursors, oxidants and meteorology. To-date, there have been few modelling studies that have exploited the limited amount of UK network data in conjunction with European network data to unambiguously derive relationships for UK SIA and none that have reliably established such relationships for SOA.
Type Recommendation
Capability limited by not following this recommendation Needs Helps A Fundamental SIA
1 Reduce NH3 emission variability uncertainty through flux measurement and evaluate uncertainty impacts on SIA
Accurately capture nitrate and hence SIA
2
Model sensitivity to NOx emission from shipping;
measurement characterisation, projection and impact prediction
Address the influence of shipping on SIA
SOA 3a
Identification and quantification of the most effective biogenic and anthropogenic SOA precursors; requires lab and representative chamber data and process modelling
Confidently evaluate
present-day SOA or predict future SOA A5,A7,A
9,A10 A4
3b
Assessment of the reliability of estimates of IVOC, SVOC and conventional precursor effectiveness, including chamber measurements
Evaluate or predict the major anthropogenic SOA
contributions
A5 A4
4
Speciated source strengths of SOA forming anthropogenic VOCs are needed for emission inventories. May require simplification protocol for unconventional precursors.
Evaluate or predict the major anthropogenic SOA contributions A3a,A3 b,A4,A5 ,(A6),A7 5
Enhanced knowledge of the fraction of IVOCs and SVOCs in Primary Organic Aerosol (POA) and their transfer between phases is important in understanding SOA formation.
Evaluate or predict the major anthropogenic SOA
contributions
A3a,A3 b
6 Development of reliable technique for routine monitoring of chemically-resolved volatility
Constrain and evaluate SOA
predictions A4,A5
7
Characterisation and quantification of organic compound emissions from domestic and commercial cooking and burning of biomass for heating
Address the influence of cooking and biomass burning
on SOA
A4
8
More complete speciation of biogenic VOC emissions, targeted towards the effective SOA precursors (mono- and sesquiterpene and green leaf volatile speciation).
Evaluate or predict the major biogenic SOA contributions
9 Quantify the sensitivity of biogenic (B)SOA to anthropogenic (A)VOC reductions and of both (A)SOA and (B)SOA to NOx
reductions. manmade SOA contributions
10 Quantify the relative contributions of gaseous and aqueous SOA formation pathways.
Confidently evaluate present-day SOA or predict future SOA
B Measurement
Both SIA and SOA
1a
long-term monitoring of secondary PM2.5 contributors on time
scales that capture episodic events, resolving them with appropriate numerical techniques.
Evaluate PM contributions and temporal responses or
evaluate models
B1b
1b
(semi-)/continuous analysers for inorganic and organic components to obtain geographical coverage for spatial distribution trends (note1). Needs multiple sites for reliable fractional contribution to UK atmosphere.
Evaluate PM contributions and temporal responses or
evaluate models B1a
2
Where SOA is measured, it is essential to make collocated measurement of PM mass, inorganic aerosol components (incl. SIA), primary emission tracers (CO, NOx, BC, K,
levoglucosan and diesel tracers), O3 and local met.
Link PM contributions to their individual components for
process evaluation
3 Systematically compare available numerical techniques within the UK, in particular emphasising roadside locations
Gain confidence in analytical techniques (and uncertainties)and in the provision of measurements as
evidence
B1a
4 Coordinate and collocate network measurements of primary precursors with SIA and SOA
Provide geographical variability in SIA and SOA and evaluate
models
5 Systematically compare available measurement techniques within the UK, again with emphasis on roadside locations
Gain confidence in measurement techniques (and
uncertainties) and in the provision of measurements as
evidence
B1a,B1 b
6 Targeted expansion of network capability (e.g. expansion of Improved geographical B1a,B1
1
Composition and Size network to more urban and rural sites with instrumentation described above, building on AGANet and AURN sites with their extensive historical data)
variability in SIA and SOA and its attribution, plus model
evaluation
b,B2,B4
SOA 7
Intensive research measurements on VOC oxidation products and the semi- and intermediate volatility organic aerosol components for constraint of simplified model SOA treatments
Constrain and evaluate SOA contributions and predictions
C Modelling
SIA 1a
Priority: Understand and reconcile divergent predicted dependencies of SIA on precursor emissions. Model evaluation (and resultant improvement) of SIA processes is required.
Prediction of process contributions to SIA and consequent response of SIA to
precursor emission reduction
C1b,C1 c
1b
Representation and roles of NH3 and of gaseous vs. aqueous
sulphate production require particular attention. Emission of primary sulphate should be clearly reported when attributing emission sensitivities.
Prediction of process contributions to SIA and consequent response of SIA to
precursor emission reduction
C1a
1c
Model-measurement comparison and evaluation of SIA and precursor vertical profiles to constrain transboundary and UK sources and resolve elevated vs. surface loading to validate SIA processes.
Attribution of local and transboundary SIA
C1a
SOA 3
Priority: Development of air quality models with reasonable skill to replicate SOA mass loadings in the UK with predictive capability.
Confidently predict SOA for policy compliance C2 or C3+C4, ideally C5,C6 4
Short term use of semi-empirical methodologies coupled to appropriate UK gaseous schemes to capture SOA mass based on best knowledge of “unconventional” IVOC and SVOC precursors - “VBS” methodology. Exploration of parameter sensitivity in such an approach.
Make any useful prediction of SOA in the short-term
A5 C1
5 Medium / long-term development of highly detailed representations of the oxidation chemistry of emitted VOCs, IVOCs and SVOCs to faithfully capture dependencies of
Make improved mechanistic prediction of SOA in the
longer-term
gaseous precursor concentrations.
6
Systematic reduction of detailed gas phase schemes developed in 5 above appropriate for coupled representations of SOA formation
Confidently predict SOA on the
UK scale A5,C5 C1
7 Detailed representation of coupled particle microphysics and chemical transformations in all phases is ultimately required.
Detailed prediction of SOA contribution at all particle sizes
with realistic lifetimes and deposition patterns
C1
8
Reliable representation of BVOCs to be used in evaluation of BSOA vs ASOA. Ideally BVOC emissions should respond to model conditions, but perturbation studies possible if uncoupled models used.
Confidence in attribution of natural SOA
C1
9 Evaluate couplings between AVOCs, NOx and BVOCs with reliable SOA representation
Understand influence of anthropogenic emissions on
biogenic SOA
A9,C1
10
Evaluate relative contributions to SOA by anthropogenic emission sector and from biogenic emissions. Avoid brute force emission perturbation methods if possible to avoid large numbers of simulations.
Attribute SOA to natural and manmade sources
A1,A2,A 3a,A3b, A4,A7,A 8,C1
11
Exploitation of available EU network data for model boundary condition constraint and comparison and of available and emergent UK data
Improve estimates of transboundary and local contributions and evaluate
models
A6,B1a, B1b,B2,
C1
12
Make use of recently developed methodologies for source-receptor studies (including statistical methods embedded within the host model) and improved emissions estimates using inverse modelling approaches.
Improve confidence in attribution of PM from SIA and
Secondary Aerosols in the UK Atmosphere: State of the
Science, Uncertainties, Gaps and Recommendations
This section is based on the current state of knowledge of the processes giving rise to secondary aerosol of relevance to UK air quality. Since secondary aerosol contributing to PM mass comprises both inorganic and organic components and there are common features applying to both, secondary inorganic aerosol (SIA) and secondary organic aerosol (SOA) are considered together wherever appropriate.
The section is divided into three sections for convenience reflecting the approaches used for collection of appropriate evidence and the status of this evidence which is drawn from a distillation of the information provided in Annexes A, B and C of this report. The three sections address:
A. Underpinning knowledge about processes leading to secondary aerosol formation
B. Knowledge about secondary aerosol derived from measurements
C. Knowledge about secondary aerosol derived from modelling
In this section we aim to target a number of specific areas addressing policy requirements to enable evaluation and control of the contribution of secondary aerosol to UK air quality and consequently inform legislative compliance. To this end, the evidence in the Annexes is pulled together to address the following three high level goals:
Explain the current sources of SOA and SIA as currently measured in the UK atmosphere, including the identity and spatial distribution of precursors, taking account of both annual average and episode conditions
Review the current measurements of SOA and SIA in the UK atmosphere, accounting for spatial distribution, site type and measurement technique, and consider what future measurement strategy would best inform the understanding of SOA and SIA formation/concentrations
Identify the key precursor emissions to SOA/SIA concentration relationships and likely impacts on UK secondary aerosol concentrations of possible future changes in spatially-disaggregated emissions
Addressing these goals is important for understanding the degree to which control of secondary aerosol is possible, the means by which such control may be achieved and hence the appropriate policy responses. To this end, the following key has been adopted for clarity.
A. Underpinning knowledge about processes leading to secondary
aerosol formation
Atmospheric aerosol particles, from a few nanometers (nm) to tens of micrometers ( m) in diameter, may be either directly emitted into the atmosphere or formed in-situ by the oxidation of precursor gases and are termed primary and secondary, respectively. The secondary fraction comprises variable amounts of sulphate, ammonium, nitrate, chloride, water and carbonaceous material. The sulphate component is derived predominantly from the atmospheric oxidation of anthropogenic and natural sulphur-containing compounds such as sulphur dioxide (SO2) and dimethyl sulphide (DMS), respectively. Nitrate is formed mainly
from the oxidation of atmospheric nitrogen oxides (NOx). In the UK, since NH3 is almost
invariably in excess, sulphate is normally present completely neutralised as ammonium sulphate, very occasionally being partially neutralised NH4HSO4. Nitrate particularly is only
formed when there is enough NH3 to give fully neutralised ammonium nitrate. Chloride can
enter particles as a result of ammonia neutralisation of hydrochloric acid (HCl) supplementing the main primary sea salt source of chloride that is present hundreds of miles from the coast. The carbonaceous fraction of the atmospheric aerosol comprises both elemental and organic carbon. Elemental carbon (EC), also called black carbon (BC), is emitted directly into the atmosphere, predominantly from combustion processes. Organic aerosol (OA) has both a primary (POA, e.g. biomass burning and combustion) and secondary (SOA) fraction. The latter process occurs when volatile organic compounds (VOCs) undergo gas phase oxidation reactions, forming products that have low enough volatility to form aerosol via either nucleation or condensation onto pre-existing particles. Recent studies of the volatility of emitted particles has blurred the distinctions between the primary and secondary organic aerosol categories, with ambient evaporation and oxidation of primary particulate emissions yielding previously unrecognised semi-volatile and intermediate volatility compounds (S/IVOC) that produce substantial additional sources of SOA.
Organic aerosol frequently forms the dominant fraction of atmospheric submicron particulate matter in the atmosphere. However, measurements indicate that models poorly predict OA concentrations. Regional and global models using “traditional” tuned SOA parameterisations form SOA mostly from biogenic VOCs and typically underestimate SOA in polluted regions by an order of magnitude or more but not for clean biogenic regions. SOA formation from additional sources has been included in models. Several box, regional and global modelling studies have explored enhanced formation of SOA from semi-volatile and intermediate volatility organic compounds (S/IVOC) from anthropogenic and biomass burning sources, finding them to be important and previously neglected regional and global SOA source. There are still substantial uncertainties in concentrations, reaction rates, and SOA yields of S/IVOC precursors. SOA formed from biomass burning precursors is gaining attention as a potentially important source, although field and laboratory studies show highly variable net addition (or loss) of OA mass by SOA formation and POA aging from this source.
The source of model underestimation of SOA is unclear, although several factors may play a role:
i) SOA remains dynamic, through both reversible partitioning and continued atmospheric oxidation. This atmospheric processing or “ageing” is not well represented in models and involves physical and chemical processes typically not accessed in the laboratory. Atmospheric mixing blends organic aerosol from various sources;
iii) aqueous-phase chemistry in aerosols and/or cloud droplets may play a larger role than previously thought;
iv) transfer of both inorganic and organic compounds between vapour and condensed phases is generally poorly, inconsistently or erratically represented and may be the source of significant error; and
iv) SOA formation from biogenic VOCs may vary with the level of pollutants.
The global and regional budgets of SOA are very uncertain. Top-down estimates suggest a global source ranging from 120–1820 Tg (SOA) yr−1. Bottom-up estimates combining VOC emission inventories with laboratory SOA yields suggest global formation of 8–110 Tg (SOA) yr−1. This uncertainty (8–1820 Tg (SOA) yr−1) is very substantial. The relative contributions from anthropogenic, biogenic, and biomass burning sources are similarly poorly constrained. Studies using traditional SOA models predict biogenic SOA sources to greatly exceed anthropogenic ones, while newer models predict fractionally greater anthropogenic SOA. A high biogenic fraction appears consistent with the large fraction of non-fossil carbon detected in ambient OA. Even in polluted regions when OA is universally observed to be enhanced, substantial fractions of non-fossil carbon are found implying anthropogenic enhancement of biogenic SOA formation. Potential mechanisms for such enhanced formation include higher aerosol acidity, NOx levels and speciation, enhanced pollution-related OA and oxidant levels
and speciation. Doubling of biogenic SOA by pollution in the US was predicted primarily resulting from enhanced biogenic VOC oxidation with increased NOx, and through
anthropogenic POA availability for biogenic species condensation. Not all of the non-fossil carbon is biogenic, with significant biomass burning, biofuel and non-fossil urban OA contributions.
As mentioned above, secondary aerosol particles are generated by the transfer of material from the gaseous to the condensed (i.e. solid and/or liquid) phase following the chemical processing of emitted gaseous precursor compounds, which may originate from both anthropogenic and biogenic sources. A number of processes therefore contribute to secondary aerosol formation, including the emission of precursor species, their oxidation and subsequent multiphase chemical and physical processes. In the following sections, the current state of knowledge of these processes is summarised for both secondary organic aerosol (SOA) and secondary inorganic aerosol (SIA).
This section is framed loosely around a number of fundamental questions of direct impact to UK Air Quality and hence of interest for policymakers. The answers to the questions will benefit understanding of the degree to which control of secondary aerosol is possible, the means by which such control may be achieved and the implications on future legislative compliance. The evidence enabling the questions to be addressed is provided in Annex A.
The objective of Annex A is to Explain the current sources of SOA and SIA as currently measured in the UK atmosphere, including the identity and spatial distribution of precursors, taking account of both annual average and episode conditions.
National Atmospheric Emissions Inventory, NAEI, for UK anthropogenic emissions, the European Monitoring and Evaluation Programme, EMEP, for wider European emissions. For biogenic organic emissions, account is taken of a number of studies relevant to the UK and EU for information on biogenic VOCs. The section also reviews current understanding of the chemical and physical processes that convert the emitted precursors into SOA and SIA, including gaps and uncertainties. This includes consideration of chemical processes occurring in the gaseous and aerosol phases, and gas-to-aerosol transfer processes. The review information incorporates knowledge and studies reported in the literature, and draws on information from expert review groups. There are important differences between secondary gaseous and particulate pollutants related to precursor identification, phase transfer and process complexity that will be covered.
Specific questions of direct impact on Air Quality and hence of interest for policymakers:
1. What are the SIA / SOA precursors?
SIA: Measurements in the UK show that SIA almost solely comprises fully-neutralised sulphate (SO42-) and nitrate (NO3-); predominantly ammonium sulphate, (NH4)2SO4, and
ammonium nitrate, NH4NO3, but with some sodium nitrate (and possibly a small amount of
sodium sulphate) formed by acid displacement from seasalt under marine influenced conditions. The major sulphate aerosol precursors are oxidised sulphur, emitted mainly as sulphur dioxide (SO2), with some additional reduced sulphur emission contributions, mainly
as dimethyl sulphide (DMS, CH3SCH3) (A1.2.1). The major nitrate aerosol precursors are
nitrogen oxide (NOx) emissions, made up of nitric oxide (NO) and nitrogen dioxide (NO2)
(A1.2.1). The ammonium aerosol precursor is emitted ammonia (NH3) (A1.2.1; A2.2.3).
Hydrogen chloride (HCl) may play a role as an SIA precursor under specific conditions, through reaction with NH3 to form ammonium chloride, NH4Cl, aerosol (A1.2.1; A2.2.3).
SOA:The emitted precursors to SOA formation are gas phase organic compounds. Larger and less volatile emitted molecules are generally better at making SOA. There are both man-made and natural emissions of SOA precursors, which can be classified as “conventional” and more-recently identified “unconventional” precursors. Anthropogenic sources of conventional SOA precursors identified in a wide range of chamber studies include mono-aromatic compounds such as benzene, toluene, xylenes and trimethylbenzenes. VOCs vary widely in their SOA formation potential and SOA formation from anthropogenic precursor emissions is highly sensitive to their speciation (A1.1.2.2). Relatively recently, “Intermediate volatility” and “Semi-volatile” organic compounds (IVOCs and SVOCs) have been shown to require little ambient oxidation to produce components that will form SOA and more readily do so, with higher mass yields and comprise the large part of the unconventional precursor class (A1.1.5). A range of volatility of components can be formed in the oxidation of both anthropogenic and biogenic emitted compounds. Anthropogenic IVOCs and SVOCs include normal alkanes in the approximate ranges C13 to C16 and C17 to C26 respectively and
generation products of their generally rapid oxidation can readily condense to form SOA. The effectiveness as SOA precursors of green leaf volatiles is more variable and generally less-well quantified.
There are substantial uncertainties in the identity and emissions of both anthropogenic and biogenic gas phase compounds that may be effective SOA precursors. Considering the larger SOA precursors, whilst inventories of NMVOCs may be relatively comprehensive in terms of their carbon budget, a fraction of the mass from only a small subset of components will contribute to SOA. These are largely difficult to measure and not in current inventories. Smaller soluble oxygenated molecules that may act as aqueous SOA precursors are formed by gaseous fragmentation of very many VOCs. Mechanistic quantification of the process is unavailable and hence the strength (and associated uncertainties) of the relevant emission sources is not quantifiable.
There is a high priority requirement for identification, representation and assessment of the role of “unconventional” SOA precursors such as IVOCs and SVOCs, their emissions, concentrations and SOA forming potential
There is a requirement to evaluate the relative contributions of gaseous and aqueous SOA formation pathways
2. What are the current precursor emission sources which result in SOA and SIA formation (both regional and transboundary – note the UK, EU and non-EU contributions and the biogenic & anthropogenic, conventional and “unconventional” splits)?
i) SIA: The sources of major SIA precursors (SO2, NOx and NH3) are much better
constrained than SOA precursor sources with UK emissions according to the NAEI (http://naei.defra.gov.uk/) accounting for 10%, 13% and 8% respectively of the EU-27 emissions in 2010 according to EMEP (http://www.emep.int/). Inventories represent emissions in up to 12 source categories. SO2 and NOx emissions are dominated by
combustion; mainly power generation for SO2 and power generation and road transport for
NOx. NH3 is dominated by the agricultural emissions (including animal waste and use of
fertilisers), with contributions from waste (e.g. from anaerobic digestion of organic waste) and combustions (e.g. road transport). UK and EU-27 SO2 and NOx emissions show a
downward trend resulting from EU control measures, with continued projected future reductions. NH3 emissions show little projected trend. Presenting in molar terms, NH3 is
already the most abundant emitted SIA precursor in the EU-27, and is projected to become the most abundant UK SIA precursor by 2020. NAEI mapped UK emissions by source sector are available at 1 km x 1 km and EMEP domain emissions at 50 km x 50 km resolution both generally sufficient for sulphate and nitrate prediction (though not for primary pollutant emissions close to a receptor), owing to the time and distance scales required for SO2 and
NOx oxidation. NH3 emissions possess a large spatial variability and the consequences of its
influence on SIA formation through direct reaction on a short timescale is discussed in response to question 12. Uncertainties in emission spatial variation in order of decreasing mapping quality is reported as: SO2 > NOx > NMVOCs > PM10 > NH3. It is not straightforward
to compare areal emissions to draw conclusions about the relative impacts of UK and non-UK anthropogenic emissions on SIA formation, which requires incorporation of emissions data in appropriate models (A1.2.2.1, addressed more fully in Annex C). Uncertainties in the 2010 UK emissions totals are estimated as ± 4 % for SO2, ± 10 % for NOx and ± 20 % for
NH3, with suggested additional uncertainties of about ± 1.7 % for SO2, ± 7 % for NOx and ±
7.5 % for NH3 for 2030. Natural and biomass burning emissions of SIA precursors are
NOx as NO and biomass burning emissions of SO2, NOx and NH3, and are detailed in Annex
A.
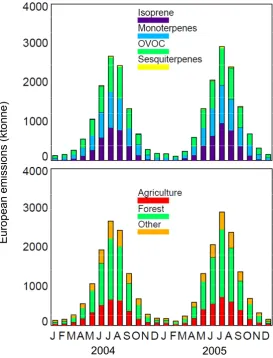
ii) SOA: The emissions of most “conventional” SOA precursors are relatively well-quantified in UK and EU inventories. Almost half the anthropogenic UK VOC emissions fall into the “solvents and other product use” category, with notable “fugitive emissions” and “industrial processes” contributions. Although historically a major contributor, road transport emissions are estimated as only about 6 % of the 2011 total. Unconventional IVOCs & SVOC SOA precursors are emitted from both anthropogenic and biogenic sources. Conventional biogenic SOA precursors include monoterpenes and possibly isoprene. However, there is no evidence for SOA from isoprene from measurements in the UK atmosphere. There is isoprenoid tropical atmospheric SOA above the Amazon and Bornean rainforests; however, North America is the only temperate location where there is solid evidence that it contributes. Methods available to estimate biogenic VOC emissions have allowed them to be speciated into isoprene, monoterpenes and other VOCs, with sesquiterpenes becoming increasingly reported. Emissions of biogenic VOCs possess substantial spatial variations across Europe (A1.1.3.3), resulting from variations in land use and conditions (e.g. temperature). Uncertainties in the spatial variation of the VOC emissions are generally not quantified and reported. Mean annual biomass burning VOC emissions for Europe are less than 1 % of the annual anthropogenic VOC emissions for the EU-27. However, because of their sporadic nature, biomass burning events can have short-term impacts on UK air quality.
The relative daytime (via HNO3 uptake) and night-time (via N2O5 hydrolysis vs Cl- reaction)
contributions to aerosol nitrate are poorly constrained by measurements; the interactions with meteorology (in particular to vertical temperature and RH profiles) will vary substantially between the processes.
Whilst the nitrate contribution to PM2.5 from acid displacement in seasalt aerosol will likely be
modest, nitrate in the coarse aged seasalt mode may be substantial and make sporadic marine contribute to “pollution” episodes as characterised by PM10.
Owing to our inability to fully reconcile the non-linearity in sulphate reduction with SO2
emission reduction, there is a requirement to more comprehensively understand the controls on SIA, with particular emphasis on the magnitude of aqueous sulphate production and the roles of NH3 (see section C).
It is not straightforward to draw conclusions about the relative impacts of UK and non-UK anthropogenic emissions on SIA or SOA formation, for which incorporation of emissions data in appropriate models is required. The interpretation of model simulations of SIA and SOA is covered in section C.
The overall uncertainty in the NAEI anthropogenic VOC speciation has not, to-date, been quantified. Combined with highly uncertain propensity for SOA formation of individual precursors, even for “conventional” sources, uncertainties in the profiles of the effective SOA precursors preclude quantitative apportionment across geographical boundaries.
It is likely that emissions of species that contribute to the IVOC and SVOC burden are the least well characterised in the NAEI, because they tend to be made up of small contributions from each of a very large number of species which cannot be resolved by traditional analytical techniques.
There is a need to represent the high spatial and temporal variability of NH3
emissions, and to evaluate the effect of such variability on SIA formation.
Model evaluation to the sensitivity to uncertainties in the emissions of SIA precursors should be conducted to evaluate process skill by comparison with current measurements and provide confidence in scenario projections
Model evaluation (and if necessary representation improvement) of SIA processes is required to reproduce the responses of sulphate to reduced SO2 emissions and fully
resolve the contributory processes with particular attention to the representation of gaseous vs. aqueous sulphate production
Model-measurement comparison and evaluation of vertical profiles of SIA and precursors is required in order to constrain transboundary and UK sources and resolve elevated vs. surface level loadings
Improved measurement constraint of the night-time and daytime oxidised nitrogen budget is required for model evaluation
Model-measurement comparison and evaluation of the concentrations of NaNO3 in
marine, non-marine and episode conditions to establish the contribution of aged seasalt
Characterisation of NOx emissions from international shipping, which are projected to
make an increasing European contribution, should be improved
Reliable and consistent representation of the emissions of biogenic VOCs needs to be used in modelling and assessment studies aimed at quantifying SOA formation
An assessment of the reliability of estimates of IVOC, SVOC, GLV and conventional precursor effectiveness is required, with chamber measurements under representative conditions where necessary
Evaluation of the speciated source strengths of anthropogenic VOC emissions through ambient concentrations and flux measurements should include larger and lower volatility species (IVOCs and SVOCs) than are routinely measured by the hydrocarbon network, and should aim to verify contributions from sources additional to road transport (e.g. solvents and other product use)
IVOCs and SVOCs must be fully represented in inventories, or separate inventories for IVOCs and SVOCs should be developed, even if these are at a simplified carbon number level
Enhanced knowledge of the fraction of IVOCs and SVOCs in POA and their transfer between phases is important to a fuller understanding of SOA formation
A more complete speciation of biogenic VOC emissions is required. This should include (i) speciation within the monoterpene class; (ii) better characterisation of OVOC (including GLVs) speciation; and (iii) inclusion of high-yield SOA precursors (e.g. sesquiterpenes) that are not always represented
Improved characterisation and quantification of the emissions of organic compounds from domestic burning of biomass for heating
Both regional and global models using “traditional” chamber-tuned SOA parameterisations form SOA mostly from biogenic VOCs and typically do fairly well in clean biogenic regions but underestimate SOA in polluted regions by an order of magnitude or more. Recent evidence indicates that SOA formation from biogenic VOCs may be more efficient in polluted air implying anthropogenic enhancement of biogenic SOA formation. Non-linear interactions between reductions in either NOx and anthropogenic VOCs, or both, and biogenic PM2.5
SOA might be expected owing to the effects on gaseous oxidants and pre-existing condensation sink of particles. Emissions rates of biogenic VOCs are sensitive to the type and quantity of vegetation, season and conditions such as temperature, light and soil moisture. As a result the emissions rates are highly variable both spatially and temporally (A1.1.3). The relative importance of biogenic emissions is greater during the summertime, with an average emissions rate approaching 40 % of that due to anthropogenic NMVOC emissions, but much higher in terms of reactivity and SOA production potential (A1.1.3.1). Particle condensation will be reduced and evaporation enhanced at higher temperatures, so offsetting some of the SOA formation by SVOCs.
Unlike the situation for anthropogenic VOCs, there is no central source of information for biogenic VOC emissions in the UK or Europe, although various estimates have been reported (A1.1.3). Because of the very large spatial and temporal variability of the emissions and their lack of meaningful speciation, annual totals are of relatively limited value for modelling applications, although they do allow broad comparisons of the relative emissions of VOCs from biogenic and anthropogenic sources, and how this varies between the UK and Europe as a whole (A1.1.3.1). The estimates from the different studies cover a range of about a factor of four in annual total emissions. The variability provides an initial indication of the level of uncertainty in estimating the annual totals, but is not particularly useful because of the lack of speciation available (A1.1.3.1).
Owing to the lack of data relating the emissions of highly effective biogenic SOA precursors to the factors determining their release, effective control methodologies are unclear.
The most effective BSOA precursors weighted according to their emissions are unknown and should be identified. The factors controlling emission of these precursors are similarly unknown. Without such knowledge there are few ways to control emissions. Identification and quantification is a high priority.
Many green leaf volatiles (GLVs) are released when plants experience mechanical damage (A1.1.3.2), such as grazing or cutting. As such are a class of biogenic compounds over which there is some potential to exert policy controls. The potential for control should be evaluated in the context of studies investigating the SOA production potential and speciated emissions of individual components
The anthropogenic-biogenic interaction processes are poorly understood and require further investigation in order to be included in models
promising routes forward for developing accurate predictive capability for incorporation in air quality models?
A2.3.2.1: There are a number of fundamental uncertainties in our understanding of processes related to SOA formation (largely covered in this section above and detailed in Annex A) that preclude quantitative prediction in the real atmosphere at the present time. It is clear that near-explicit bottom-up models of VOC degradation driven by current anthropogenic VOC inventories underpredict SOA in the UK by orders of magnitude. It is not clear that completely explicit models of gaseous oxidation even driven by perfect, fully-comprehensive emission inventories would capture the carbon flux to the condensed particulate using the commonly used equilibrium partitioning approach, for the reasons outlined in Annex A. However, the more explicit representation of the oxidation of a more comprehensive coverage of emitted organic compounds will inevitably improve the predicted flux of potential condensable oxygenated products.
Rather than assuming instantaneous equilibrium of condensing organic compounds to the total mass of particulate, representing their transfer to an evolving particle distribution is more physically reasonable and more consistent with the treatment of inorganic vapours in the most realistic models. Such an approach, including the most important precursors, promises real predictive capability once sufficient constraint is placed on fundamental properties (vapour pressures, activities etc) and possible reactions in the particles. In the first instance this must be for systems much simpler than the UK atmosphere, such as chamber systems since the state-of-the-science in secondary aerosol formation can be likened to that of gaseous oxidation several decades ago.
Unfortunately, given that the secondary carbonaceous mass present in the condensed phase is a very small fraction of gaseous material oxidised, it is very likely that important condensing molecules will never be captured explicitly with sufficient accuracy (either in the inventories or the degradation mechanisms or both). A further difficulty with the explicit representation of condensation of organic components is the computational expense. Large-scale models cannot carry complex representations of SOA formation with thousands of individual gas phase compounds, and reactions between all of these within the particles.
However, there have been a number of important developments of promise that have a good chance of aiding SOA prediction in the short- and medium-term. The identification of IVOCs and SVOCs as “unconventional” but very effective SOA precursors has led to the possibility of their inclusion in empirical SOA treatments in an extension of the way chamber-tuned mechanisms have previously used the equilibrium partitioning approach. These semi-empirical approaches (e.g. lumping by volatility such as the VBS) can be linked to existing gas phase mechanisms supplemented by appropriate emitted parent IVOCs and SVOCs. Whilst none of the semi-empirical approaches capture the important evolving chemical functionality of aerosol particles (or feedbacks on the gas phase chemistry), they can be linked to kinetic treatments of particle evolution and condensed phase reactions or changes of particle phase can be accounted for by parameterisation. The approach is sufficiently flexible that emerging understanding can generally be accommodated or the approach extended, such that the tuners become more faithful to the underlying processes.
their skill. Incorporating them in flexible semi-empirical approaches is guaranteed to improve the skill.
Ultimately, absolute faith in a model representation of SOA processes will require an explicit treatment of all the important processes. Such models will be useful in the medium term i) in testing out process knowledge of the SOA systems in chamber experiments, ii) for testing the simplifications discussed above on reduced complexity systems and iii) for deriving simpler traceable mechanisms, much as has been done for gaseous degradation mechanisms. They will eventually be useful for atmospheric predictions in air quality models.
There is a pressing requirement for air quality models to predict SOA mass loadings in the UK atmosphere with reasonable skill and to make reliable future projections.
One method to achieve this, following the successful example of gaseous oxidation mechanisms, is to require traceability to, or evaluation against, explicit and accurate models of the determinant processes.
Development of highly detailed representations of the oxidation chemistry of emitted VOCs, IVOCs and SVOCs is required to provide the basis for reference simulations that faithfully capture dependencies of gaseous precursor concentrations. This will require development and application of methodologies for the automated generation of such highly detailed representations.
The details of transfer of organic material to, and from, the particulate matter in an evolving aerosol distribution must be captured in appropriate dynamical frameworks, informed by appropriate laboratory data and coupled to an explicit gas phase scheme, since SOA components evaporate as well as condense, both processes taking finite time.
In the short term, tuned methodologies that most readily capture SOA mass based on our best knowledge of “unconventional” IVOC and SVOC precursors are required in air quality models. They currently exist coupled to specific gaseous mechanisms, but require development of appropriate precursor inventories, probably requiring new measurement technologies (see Annex B).
In the short-term, semi-empirical approaches should be coupled to the most appropriate UK gaseous schemes.
Pathways for aqueous SOA formation are currently unclear and too poorly constrained by measurement to allow clear recommendation
B. Knowledge about secondary aerosol derived from
measurements
This section summarises the measurement-derived evidence related to secondary aerosol. So far as possible, definitive conclusions are drawn from long-term operational measurements made across the UK (and European) network sites. However, owing to the lack of routine quantitative PM2.5 SIA and SOA measurements and the interpretation
challenges related to the state of our fundamental understanding and associated uncertainties, evidence is supplemented by measurements made on a more intensive case study basis under research conditions.
The section is framed loosely around a number of measurement-related questions of direct impact to UK Air Quality and hence of interest for policymakers. The answers to the questions will benefit understanding of the degree to which control of secondary aerosol is possible, the means by which such control may be achieved and the implications on future legislative compliance.
Annex B provides a comprehensive summary of the current technological state of the art relevant for the study of atmospheric SIA and SOA, including a description of measurement techniques and some of the data analysis methods, along with recent findings. The interpretation of secondary aerosol processes requires measurements beyond those that are routinely deployed to develop our fundamental understanding as detailed in section A and provide constraint required for the models outlined in section C. These are also detailed in Annex B, subsection B1. This section is largely drawn from the evidence provided in Annex B subsection B3, referring to measurement techniques described in B1 and numerical interpretation tools described in B2.
The objective of Annex B is to Review the current measurements of SOA and SIA in the UK atmosphere, accounting for spatial distribution, site type and measurement technique, and consider what future measurement strategy would best inform the understanding of SOA and SIA formation / concentrations.
Annex B is delivered in three subsections:
Subsection B1 covers the current in-use measurement techniques. Various instruments exist for the quantification of the aerosol components that make up SIA and SOA. In addition to offline (i.e. not automated) methods, multiple techniques exist for the automated, online quantification of aerosol composition with a high time resolution (1 hour). In addition, techniques for advanced offline analysis (to inform fundamental understanding) are also summarised. The only gaps in the technology identified are the lack of measurements of the semivolatile fraction. The current UK DEFRA network capability is summarised in terms of the available instrumentation. Currently, only four sites (Harwell, Auchencorth Moss, North Kensington and Marylebone Road) are adequately equipped to make reasonable assessments of SIA and SOA, with room for improvement at each.
The limitations of these techniques are discussed. There are also techniques to further apportion the SOA according to the types of precursor VOCs, using either organic tracers or carbon isotope analysis, however these too have limitations. Recommendations include the complementation of aerosol measurements with a suite of other measurements to reduce ambiguity and further intensive characterisation work.
Subsection B3 covers the findings from recent work studying SIA and SOA in the UK, employing the techniques covered in B1 and B2. While the data from the AGAnet network may not be absolutely quantitative, it does give UK coverage for the geographical and long-term trends in SIA. There are fewer studies into SOA and these are mainly limited to intensive measurement periods rather than long-term monitoring, which are summarised. Certain recent measurements are expanded upon, which includes measurements using the FAAM BAe-146 large research aircraft, which offers insights into transboundary pollution and vertical distribution of secondary aerosol components, and the recent ClearfLo intensive measurement campaign in London in 2012, which also included a year-long aerosol mass spectrometer dataset. These results underscore the importance of nitrate in SIA and also the episodic nature of SIA and SOA events. This in turn shows the usefulness of automated online measurements in capturing such features.
Specific questions of direct impact on Air Quality and hence of interest for policymakers
5. What measurements exist? What are the spatial & temporal patterns from long-term data? Can better use be made of existing particle measurements undertaken in the UK and/or other European countries to provide further evidence of the relative contribution of SOA and SIA to PM concentrations?
Within the UK, the Delta systems (B1.1.3) used in the AGANet network (B1.7.1.3) represent good measures of the 4 main components of SIA. This provides mean annual trends dating back to 2000 and provides geographical concentration maps (B3.1). However, the inlet is uncharacterised and there is a lack of co-located PM2.5 total mass at the majority of the sites.
Furthermore, the reported monthly means from the AGANet network are unable of capturing episodic events owing to the monthly reporting frequency (B3.4.1). Currently, there are 4 sites (Harwell, Auchencorth Moss, North Kensington and Marylebone Road) running semicontinuous analysers suitable for SIA study (B1.5), of which the first 2 measure PM2.5
SIA in addition to PM10 (B1.7.1).
There is no equivalent network for SOA within the UK (B1.7.1), outside of the Number and Composition network, which measures Elemental and Organic Carbon (EC/OC; B1.6.2) at four sites and has a continuous Aerosol Chemical Speciation Monitor (ACSM) at one (B1.4.2).
SIA mass is comprised almost completely of ammonium, nitrate and sulphate (B3.1) with a more minor contribution from chloride and can dominate the total PM2.5 mass, accounting for
over 69% in episodes (B3.1; B3.4). AGANet measurements (B3.1) show mean annual sulphate varying across the UK with lowest concentrations averaging <0.3 µg m-3 in NW Scotland, increasing to >0.9 µg m-3 in SE England. Nitrate generally dominates the SIA mass and shows a similar distribution but at higher concentrations ranging from <0.9 to >2.7 µg m
-3. The spatial distributions and levels were similar in 2006 and 2009. There has been no
discernable trend in total average nitrate from 2000 to 2009, but there has been a steady decrease in sulphate in the 30 sites annual average from 1.9 µg m-3 in 2000 to 0.7 µg m-3 in 2009. NO3- has a clear spring peak, with lower loadings in the warmer summer and it can
account for over 50% of the total SIA mass (B3.4). Sulphate shows lower concentrations in the winter months with a peak around March-April. Fractional contributions of SIA to PM2.5
are only available where there are co-located SIA and mass measurements with PM2.5 inlets.
For Auchencorth Moss the mean monthly fractional contribution of SIA ranged from 0.25 to 0.5 (SIA mass ranging from 1 to 2.5 µg m-3) in 2009, and for Harwell the monthly mean SIA fraction ranged from 0.4 to 1 (SIA mass ranging from 3 to 8 µg m-3).
There is currently no way of directly measuring the SOA fraction of OA, so it must be estimated using numerical techniques, which carry inherent uncertainties (B2; B2.2; B2.4). No spatial distributions are available for SOA from long-term networks owing to the limited coverage. Similarly, there are no meaningful long-term trends that can be extracted for SOA.
Two recent year-long analyses of secondary particulate (B3.2; B3.4) have demonstrated the usefulness of the EC tracer method and the continuous Aerosol Mass Spectrometer (AMS) measurements respectively. The first, from Birmingham between 2004 and 2006, showed SOA:PM2.5 ratios of 0.16 - 0.21 (as well as 0.27 to 0.46 SIA:PM2.5 ratios) for roadside, urban
background and rural sites. The second, urban background (North Kensington), dataset was used to derive SOA:PM2.5 of between 0.08 and 0.25 (and SIA:PM2.5 of between 0.22 and
0.49) for 2012. SOA is always present in the total condensed OA and can dominate the OA mass even in urban environments (B3.2; B3.3), with the ratio of SOA to total OA generally being higher in the summer than the winter. It is noteworthy that the combined, daily average secondary aerosol PM1 mass (SOA and SIA) has been found to exceed the EU PM10 24
hour directive of 50 g m-3 for a polluted winter event in London in 2012, with NO3
-contributing the majority at 34.4 g m-3 (B3.4.1). SOA tends not to show a diurnal pattern (or has an extremely weak diurnal cycle), unlike the POA, which is influenced more by vehicle emissions, and (in winter), residential heating demands (B3.2). A range of UK analyses from shorter-term intensive studies (B3.2) presents snapshot evidence for SIA and SOA as a fraction of the total organic material from point locations between 2001 and 2012, but no UK spatial distribution or single-location long-term trends.
Whilst there is good coverage for long-term SIA concentrations, the number of network sites making accurate high frequency SIA measurements is limited. There are only two that measure SIA components and mass with the same inlet cutoff, limiting accessibility of the SIA fraction. The UK network capability for SOA is even more limited than for SIA, with only the four sites (as outlined above) making any long-term measurements of organic aerosol, limiting our ability to make meaningful statements about SOA trends or spatial distributions from measurements. With the paucity of data, it is important that available resources are efficiently exploited and there has been little effort to interpret UK SIA and SOA loadings measured by UK networks in terms of the transboundary contributions, utilising appropriate models validated with European network data. Furthermore, little use has been made of data from ground-based or airborne intensive case study data to interpret process contributions to UK SIA and SOA loadings.