Piezoelectric materials for high temperature transducers
and actuators
T. Stevenson1 •D. G. Martin2•P. I. Cowin2•A. Blumfield3•A. J. Bell1• T. P. Comyn2•P. M. Weaver3
Received: 14 April 2015 / Accepted: 10 August 2015 / Published online: 25 August 2015 ÓThe Author(s) 2015. This article is published with open access at Springerlink.com
Abstract Piezoelectric sensors and actuators are a mature technology, commonplace amongst a plethora of industrial fields including automotive, maritime and non-destructive testing. However the environments that these devices are required to serve in are becoming more demanding, with temperatures being driven higher to increase efficiencies and reduce shut-downs. Materials to survive these tem-peratures have been the focus of many research groups over the last decade, but there still remains no standard for the measurement of piezoelectric materials at high tem-perature. This is required to effectively determine compa-rable Figures of Merit into which devices can be successfully designed. As part of a recent European effort to establish metrological techniques for high temperature evaluation of electro-mechanical properties, we present here a review of the most promising high temperature polycrystalline materials. Where their properties allow operation above that of the ubiquitous commercial material lead zirconate titanate, as well as work done to modify a promising high temperature system, for use as a material standard.
1 Introduction
Piezoelectric sensors have been proven to offer excellent resolution, temperature stability, sensitivity and low cost integration properties compared to the other devices for measuring charge, voltage and frequency dependent mechanisms [1,2]. To this end piezo-based sensors, actu-ators and transducers make up a significant and growing [$15bn market, being widely used throughout a variety of industries from ultrasonic motors and pumps, optical image stabilization, automotive fuel injection, industrial condition monitoring and acoustic non-destructive testing. With the global requirement for increased efficiency and safety many of these applications are required to operate hotter and for longer, creating harsh environments in which critical assets are located [1,3,4].
For example, conventional ultrasonic pulse-echo mea-surement for determination of wall thickness of pipes and vessels as a direct indication of corrosion has distinct advantages over other non-destructive evaluation (NDE) techniques, including a low cost and direct measurement method with good resolution. It is already well established but limited to operating temperatures\260 °C [5] due to the majority of devices relying on the ubiquitous piezo-electric ceramic ‘lead zirconate titanate’ or PZT, to pro-duce and detect the acoustic signal. Significant effort has gone into developing new materials to meet the increasing demand for piezoelectric elements that can withstand ele-vated temperature ranges. Particularly within 350–600°C where acoustic sensing would be applicable to condition monitoring in pressurized water reactors [6], flow moni-toring in oil and gas plant, and position sensing in aero-space, offering but a few of the commercial incentives that are still accessible with relatively simple device packaging [4].
& T. Stevenson
1 Institute for Materials Research, University of Leeds, Leeds LS2 9JT, UK
2 Ionix Advanced Technologies Ltd., Leeds LS2 9DF, UK
3 The National Physical Laboratory, Teddington TW11 0LW, UK
The destructive effects of erosion and corrosion alone cost pipeline operators billions of pounds per year in unscheduled plant shutdowns and lost production, where it is estimated 25 % of these costs could be avoided by continuous monitoring at these demanding temperatures, over risk based inspection observation.
The materials developed for use in these high temper-ature (HT) applications range in composition, form and structure, but importantly all aim to have as high a piezo-electric operation temperature above the mainstay PZT system as possible.
Significant work has been undertaken on developing high temperature single crystals [1, 7] such as quartz, lithium niobate [8], langasite [9] and gallium orthophos-phate [2] to achieve extremely high temperature stability and operation, but typically suffer from high production costs, low mechanical strength and very low piezoelectric activity which limits their use as replacements to PZT transducer elements in the\600°C range.
The focus of this work however is in polycrystalline materials, which are most likely to be commercially adopted for use in industrial applications due to their low cost of processing and ease of integration into common electrical devices. We offer an overview of these materials suitable for HT operation as part of a recent European effort to standardize the characterization techniques and material properties of high temperature piezoelectrics (http://projects.npl.co.uk/METCO/) [3, 10], as well as a development of an existing compound to fit the use of the metrology project and as an commercially viable system.
2 Material properties, constants and definitions
2.1 Curie point and operating temperature
Ferroelectrics typically maintain their spontaneous polar-ization and post-poling piezoelectric properties with increasing temperature until reaching the Curie point (TC). At this point the crystal structure transforms into a higher symmetry phase, which relinquishes the asymmetry and alignment of dipoles subsequently causing the material to lose its piezoelectric activity. The increasing temperature effectively ‘softens’ the lattice that increases the ease at which the material can be polarized thus plotting dielectric permittivity versus temperature is a standard method of defining the Curie point. By recording the capacitance on cooling and defining the point at which it reaches a max-imum, immediately prior to the ferroelectric phase transi-tion, can be defined as TC[11].
The thermal re-randomization of the ferroelectric spon-taneously formed dipoles also requires the material to be poled at T\TC in order to restore the piezoelectric
properties. This notion of the dipoles tendency to randomize with increasing temperature degrades the piezoelectric properties termed ‘thermal ageing’, which historically limits the operating temperature to a more temperature stable range which is much less than TC [12]. This opera-tional limit where the material effectively becomes de-poled, is defined as Td[13] and is typically measured by the small signal resonance method [11, 14] to determine piezoelectric activity as a function of increasing temperature.
2.2 Dielectric constant
The complex a.c. permittivity e* is measured from the complex impedance of a sample:
e¼e0e00 ð1Þ
where e0 and e00 are the real and imaginary parts respec-tively. The relative permittivity, or dielectric ‘‘constant’’er,
relates to the sample capacitance and is given by the real part of the complex permittivity:
er¼
e0
e0
ð2Þ
wheree0is the vacuum permittivity.e0 is referred to as the dielectric permittivity in this paper. Dielectric losses are expressed by the loss tangent, or dissipation factor, tan d:
tand¼e00=e0 ð3Þ
2.3 Piezoelectric coefficients
Perhaps the most ubiquitous figure of merit for piezoelec-tric materials used throughout the literature is the piezo-electric charge coefficient (dij), which describes the
relationship between the direct (Eq.4a), or converse (Eq. 4b), piezoelectric effect where the application of a mechanical stress is converted to an electrical charge (in C/ N) or an applied electric field converted to mechanical strain respectively (m/V).
D¼dTþe0TE ð4aÞ
x¼sETþdE ð4bÞ
the same surface as the applied electric field, and in parallel to the poling direction.
xi¼dijEj ð5Þ
The charge coefficient can be measured by direct or converse effect methods such as resonance [11,14,16] and Berlincourt methods respectively, although resonance is preferred and standardized [11,15]. The magnitude of the charge coefficient in HT materials can range greatly, from \10 pC/N in non-perovskite crystals such as quartz [12], gallium orthophosphate and langasite [1], and exceed 103pC/N in ferroelectric single crystals such as PbYbO3– PbTiO3[17] and BiScO3–PbTiO3[18].
An important consideration for transducers is the volt-age coefficient (gij) in V/N (Eq.6). This constant is
inversely related to the dielectric permittivity by the charge coefficient and is typically temperature invariant due to the relationship in Eqs. (4a,4b).
gij¼dij=e0ij ð6Þ
In resonance measurements, piezoelectric properties are commonly expressed as complex coefficients with the imaginary part relating to losses, both dielectric and mechanical. For assessing the piezoelectric properties using the above equations (and for electromechanical coupling factor described in Sect.2.4) we use the real parts of the coefficients obtained from resonance measurements. At high temperature the dominant factor in the losses is the high electrical conductivity (see Sect.2.5). We therefore use electrical measurements (see Sect.2.2) in discussion of losses in this paper.
2.4 Electromechanical coupling factor
The fraction of electrical energy that can be converted into mechanical energy, or vice versa, is defined as the elec-tromechanical coupling factor (k2). As this conversion is never complete,kis always\1, and as such is a limiting factor to attaining high charge coefficients in typically stiffer (or less compliant) polycrystalline materials. This relationship also means the electromechanical coupling factor is relatively temperature insensitive as d, e0 and compliance (s) all increase with temperature, until perma-nent depoling occurs.
Electromechanical coupling factors are typically found to be in the range of\0.1 for quartz [1],\0.5 for lead free polycrystalline materials [19], 0.8–0.4 for PZT and[0.8 for single crystals [1].
The electromechanical coupling factor can be calculated by the piezoelectric resonance method [11, 14] by mea-surement of the resonant (fr) and anti-resonant (fa)
fre-quencies of the desired vibration mode [11]. An effective coefficient can be expressed at any fundamental resonance
given by Eq. (7) [1], where the resonant and anti-resonant frequencies are defined by maximum and minimums of impedance (Z) at zero reactance respectively.
k2eff ¼1 fr fa
2
ð7Þ
The variation of the electromechnical coupling factor and other coeffecients for various modes as a function of temperature for piezoelectric materials, and the principles of measurement are discussed further in Refs. [3,20].
2.5 Resistivity and RC time constant
The electrical resistivity (q) of the material is an important property that is strongly affected by temperature. Polari-sation changes resulting from an applied stress will, over a period of time, be nulled by charge movement due to conduction within the material. The rate at which this occurs is determined by the time constant (s) of the circuit formed by the sample’s capacitance (C) and its electrical resistance (R). R is dependent on the conductivity of the material and the sample dimensions. At high frequency, the rate of change of charge due to the changing applied stress is much faster than the time constant, so charge compen-sation due to conductivity is negligible. At low frequency, however, the signal from a sensor or generator may be significantly attenuated. An indication of the minimum useful frequency, or lower limiting frequency (fLL) is given
by the reciprocal of the time constant (Eq. 8), representing
an attenuation of the signal by a factor of pffiffiffi2. RC time constants for PZT at room temperature are typically[100 s [20] (fLL\0.01 Hz). The capacitance of a ferroelectric
material is also strongly temperature dependent, so the temperature dependence offLLcombines the effects of both
capacitance and resistance, providing a useful figure of merit for sensor or transducer applications.
fLL¼ 1
2pRC¼
1 2pe0
q ð8Þ
In this work resistivity was determined from AC fields below 0.01 Hz.
2.6 Thermal coefficient of expansion
-10910-6K-1, or perpendicularly ?1 to ?89
10-6K-1, whereas metals, i.e. gold and stainless steel for electroding and acoustic matching layer respectively, are in the order of?10 to?80910-6K-1.
Poled ferroelectric, piezoelectric materials are also typically anisotropic, with a negative TCE in the poled direction and positive orthogonal directions. TCE can be measured by interferometry or dilatometry to measure the displacement of a short-circuited piezoelectric sample, as a function of temperature.
2.7 Lead zirconate titanate (PZT)
After the discovery of BaTiO3researchers were stimulated to finding materials that exhibited piezoelectric properties over a wider range of temperatures. In the 1950s [22] that came in the form of the perovskite, lead zirconate titanate (PZT), probably the most diversely used and popular commercial piezoelectric with much of its success due to the ability to tailor its properties to specific applications by means of doping. Substitutionally doping on to the A or B site alters the movement of domain boundaries and modi-fies the electrical properties, but at the cost of lowering TC. PZT forms from the combination of ferroelectric PbTiO3and antiferroelectric PbZrO3to create a continuous solid solution with formula Pb(Zrx Ti1-x)O3 where 0\x\1. The solid solutions where x\0.9 are all fer-roelectric, with TCranging from 220 to 490°C depending on composition (x=0.9–0 respectively) [15].
The structure of PZT goes through several transitions with increasing temperature, but at ambient between 0.52\x\0.545 there lies a morphotropic phase bound-ary [23] between two ferroelectric phases. Piezoelectric properties are at an optimum for most applications at this MPB composition [24] due to a peak in permittivity, to which the piezoelectric coefficient is proportional (Eqs.4a,
4b).
This affords MPB compositions of PZT with d33values *200 pC/N [15], which can be further increased by donor doping, to form soft PZT’s, with ions such as Nb to exceed d33 values of 350 pC/N [25] but with a reduced TC=360°C [12]. PZT suffers from rapid aging, leading to depoling, which means it is not typically suitable for use above *200°C [12, 26]. The properties of PZT are summarised in Table1.
3 High temperature polycrystalline piezoelectric
materials
Polycrystalline materials must be ferroelectric in order to be piezoelectric [9] and constitute multiple ‘single crys-tallites’ sintered together to form a bulk ceramic. Within
the crystallites, or grains, ferroelectric domains exist, but as the material is divided granularly there occurs an averaging effect across the multiple domain directions which leaves the material polar, but with no net polarization. Application of a high electric field, above that of the materials coercive field during ‘poling’ [15] orientates the majority of the domains into a net polarization direction. As not 100 % of the domains align, a polycrystalline material cannot exhibit properties as high as a single crystal that is void of grains. Polycrystalline material properties are also dependent on other factors such as grain size, sintering temperatures and regimes, as well as defects and compositional inhomo-geneity that affect all materials. Their advantage over single crystals is that the materials can be synthesized cheaply and readily with great compositional control.
3.1 Single phase polycrystalline materials
3.1.1 Lead titanate (PT)
Lead titanate was reported as ferroelectric in 1950 due to its structural analogy to BaTiO3, the prototype ferroelectric [24], and high temperature transition from ferroelectric tetragonal to paraelectric cubic structure at*490°C [28]. But it wasn’t until 1970 that true polarization reversal by electric field was accomplished and a spontaneous polar-ization of 57lC/cm-2 was recorded in a single crystal [29].
The presence of lead is presumed to allow the ferro-electric properties to be cultivated in lead titanate as it is more deformable and polarizable than Ba and Sr in similar ferroelectric titanates, as well as the directional Pb–O bond being more covalent [30]. This bond also allows lead titanate to exhibit much larger tetragonal (space group P4 mm) distortion than BaTiO3[30], with c/a spontaneous strain (from X-ray [28] and neutron diffraction studies) ratio equal to 1.063 [28,31] at room temperature. This high structural anisotropy affects its piezoelectric and ferro-electric properties; such as a large d33/d31ratio [31], which can be of particular use in ultrasonic applications where it has the effect of minimizing a disadvantageous cross talk characteristic between adjacent elements.
3.1.2 Lead metaniobate (PN)
Lead Metaniobate, Pb(NbO3)2, has component atoms with similar ionic radii as barium titanate but forms a tungsten bronze [33], rather than perovskite, structure. This requires a relatively small poling field of 2 kV/mm, to initiate the piezoelectric properties of the material but at relatively high temperatures of 200–250°C [34]. Pb(NbO3)2 offers ferroelectric properties up to Tc=550 °C [34] and highly anisotropic room temperature piezoelectric coefficients (d33=81 pC/N, kt=0.26 [34]) up to *300°C where tand begins to increase steadily to TC coincident with a structural modification. This modification also exhibits a major change in CTE, from ?1.32910-6 to -5.459
10-6m/m K which makes it challenging to package effectively. The materials ultra-low [1] Qmhowever makes it a good choice for wide bandwidth applications if CTE mismatch can be overcome.
3.1.3 Bismuth ferrite (BF)
After the first observations of ferroelectricity in the 1920s [35] there was an immediate interest in whether these properties could be combined with magnetism [36] to create multiferroic materials with magnetoelectric (ME) coupling. Bismuth ferrite has undoubtedly been studied more extensively than any other ME multiferroic, being hailed the most promising candidate for magnetoelectric devices in a single phase [37] due to it exhibiting both magnetic and electric properties above room temperature. Bulk samples of BF were first reported in 1957 to sustain antiferromagnetism in a rhombohedrally distorted per-ovskite structure [38], and over the decades has been extensively researched by both magnetic and ferroelectric communities. The result is a material characterized with an R3c [39] space group exhibiting ferroelectricity [40] and poor piezoelectric coefficients (d33=60 pm/V [37] in a single crystal) up to a TC=830°C [41]. BF suffers from a low resistivity as the iron can alternate between 4?, 3?
and 2? readily, allowing ionic conduction to dominate particularly at elevated temperatures (up to 400°C) [42,
43], but the high Curie point and perovskite structure offers another popular end member for piezoelectric solid solu-tions. In fact bismuth based perovskites are some of the most popular materials for high temperature piezoelectric applications [44–57],
3.1.4 Bismuth titanate (BIT)
Bismuth titanate (Bi4Ti3O12) is perhaps the best studied of the compounds within the Aurivillius, bismuth based layer structure ferroelectric (BLSF) family [47]. Exhibiting piezoelectric properties up to TC =675°C comparable to
that of quartz, BIT also suffers from low coefficients (d33=3.5 pC/N) and high p-type electronic conductivity [47] (q *500 MXm) [58], resulting in a quickly dimin-ishing time constant.
The BLSF group in general present high mechanical quality factors, anisotropic piezo coefficients and high TC values, with much research on doping the basic bismuth titanate solid solution, to reduce conductivity and increase d33, using elements such as Fe, Sr, Ca [47], La [50], Na [12] and Nb [47]. The latter at 0.74 at.% showing improvements in d33to 20 pC/N at the cost of Tcby 20°C, with crucially, a[2 order of magnitude increase in resistivity [47], and increase in coupling coefficients.
Modified bismuth titanate is a promising material and is indeed now well commercialized [59, 60] in proprietary formats, particularly as it offers HT properties and is lead free, but when incorporated into device design still requires significant consideration to its large TCE mismatch to metals, particularly for electrodes, limiting its ability to be simply swapped for PZT.
3.1.5 Summary
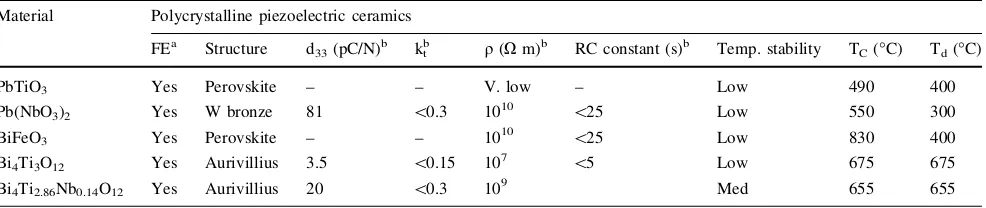
See Table2.
3.2 Mixed phase polycrystalline materials
Phase transitions are characteristic of ferroelectrics, with the most important in the scope of this work being between the ferroelectric and paraelectric phase at TC. Upon cooling through the Curie point, the crystallographic structure of the ferroelectric is associated with a small distortion of the paraelectric structure, lowering the symmetry.
Many materials also undergo further transitions below TC, as well as within the lower symmetry ferroelectric phase associated with an change in orientation of the polar axis; for example from tetragonal to rhombohedral. These are termed polymorphic phase transitions [61], and can occur not only with variations in temperature, but also mechanical stress or applied electric field [62–66].
enhanced at the crystallographic boundary do to the increased electrical and mechanical degrees of freedom inherent with the presence of two different polar phases that can change with minimal energy. For optimal utility of these materials in application it is preferable they exhibit as linear a temperature dependence as possible.
3.2.1 Bismuth ferrite lead titanate (BFPT)
In 1964, Fedulov et al. [67] published work that combined his work on the Curie temperature of BiFeO3 [68] and PbTiO3to map the complete phase diagram of the solid solution xBiFeO3–(1-x)PbTiO3. It has since been shown that the BF rhombohedrally R3c distorted perovskite forms a polycrystalline solid solution with tetragonally distorted P4 mm PT across 0\x\1. The mixing of the two end members is akin to PZT, but with the BF Curie point being significantly higher than lead zirconate, offering a MPB at x*0.7 with TC =635 °C [67].
As is observed in lead zirconate titanate (PZT), the morphotropic phase boundary in BFPT displays an increase in dielectric permittivity and piezoelectric activity [57]. This is attributed to the unusual, and relatively large internal tetragonal lattice strain c/a ratio=1.18 for x=0.7 [69], which is significantly higher than that observed for barium titanate (c/a=1.01 [70] ), PZT (c/
a=1.02 [15]) or the lead titanate end member (c/ a=1.063 [31] ) as well as other compositions in the BFPT space, it is easy to see how this could have effect on the physical properties.
In fact this tetragonal distortion, plus the significant difference in molar volume between the tetragonal and rhombohedral phases, 39.4 and 37.5 cm3 respectively (a difference of ca. 5 %) [71], has such an effect on the system that much of the literature reports difficulty in producing dense bulk ceramics. This is due to the huge anisotropic strain induced lattice distortion and mismatch, causing the material to intergranularly fracture upon cooling from the sinter [31,69,72] in much the same way as the PbTiO3end member. Despite this, it is recognized that the material is so ferroelectrically hard due to this strain, that when successfully formed it has not been pos-sible to successfully saturate and ‘pole’ the MPB compo-sition [73]. Piezoelectric data in the Tables are instead taken from high field measurements.
[image:6.595.51.547.74.148.2]Doping of the BFPT system [74] with elements such as Mg [75], Ga [76], La [77] and lead zirconate [51] have successfully reduced the c/a ratio allowing the material to be poled and exhibit useful piezoelectric coefficients with increased resistivity and that are relatively stable up to temperatures\350°C. However, the doping regimes come at the cost of reducing TC.
Table 1 Summary of typical lead zirconate titanate material classes
Material Summary of lead zirconate titanate materials
FEa Structure d33b (pC/N) kbt qb(Xm) Tet. c/a ratiob Temp. stability
TC(°C) Max op. temp. (°C)
PZT Navy Type II (Soft) Yes Perovskite \600 \0.6 \1011 1.013 V. Low 340 200
PZT Navy Type III (Hard) Yes Perovskite \300 \0.5 \1011 1.022 Low 305 220
Room temperature data taken from [27] a Ferroelectric,bat ambient temperature
Table 2 Properties of selected polycrystalline piezoelectric materials with operating temperatures above PZT
Material Polycrystalline piezoelectric ceramics
FEa Structure d33(pC/N)b ktb q(Xm)b RC constant (s)b Temp. stability TC(°C) Td(°C)
PbTiO3 Yes Perovskite – – V. low – Low 490 400
Pb(NbO3)2 Yes W bronze 81 \0.3 1010 \25 Low 550 300
BiFeO3 Yes Perovskite – – 1010 \25 Low 830 400
Bi4Ti3O12 Yes Aurivillius 3.5 \0.15 107 \5 Low 675 675
Bi4Ti2.86Nb0.14O12 Yes Aurivillius 20 \0.3 109 Med 655 655
Referenced within the text
[image:6.595.53.546.217.321.2]Many of the doping regimes have already proved suc-cessful enough to be patented and employed in high tem-perature devices, making them commercially available in the Europe, China and the US. They offer operating tem-peratures up to 330°C, with piezoelectric coefficients of d33=120–180 pC/N [77].
3.2.2 Bismuth scandate lead titanate (BSPT)
More recently, solid solutions of bismuth based lead tita-nate materials were investigated by Eitel et al. [48] at Penn State University, USA, resulting in a correlation of MPB Curie temperature with the end member tolerance factors, predicting that solutions with a t\1 are in general more likely to follow a trend and exhibit an increased TC.
The three end members with the lowest value oftwere BiScCO3, BiInO3 and BiYbO3 which upon synthesizing each with PbTiO3, was found that phase pure perovskite could not be formed with the exception of xBiScO3– (1-x)PbTiO3(BSPT) which formed a pure, stable structure when x\0.5.
The subsequent MPB composition at x*0.36 displays a c/a ratio=1.02 [78] offering a lower, but still significant, tetragonal strain than the PbTiO3 end member and Tc=450 °C, whilst offering room temperature d33of 460 pC/N [78] and kp=0.59 [79]/kt=0.49 [80].
Since the initial measurements of BSPT, many research groups have tried to increase both the low resistivity inherent with the BiScO3 end member, and electrical properties by varying grain size [52] and introducing dopants [26, 54, 81], but as yet there have been no sig-nificant improvements without a dramatic loss in TCand kp [82].
An additional factor that needs addressing with BSPT is the cost of scandium oxide being orders of magnitude greater than conventional polycrystalline materials [74] which has led to groups around the world looking at replacing some of the Sc with Fe2O3[83] as well as whole solid solutions, including modified BiFeO3 [55, 82] and Bi(Ni,Ti)O3[53].
Low processing yields due to reactivity with alkali salts in some systems has also led to further work in the In and Yb based materials, where there has since been shown that 0.15BiInO3–0.85PbTiO3modified with 1.5 at.% Nb, makes an excellent candidate for elevated temperature sensor devices, with the dopant stabilizing the perovskite phase and achieving relatively stable high temperature properties; d33=60 pC/N (at ambient) up to a Tc=542 °C but with poor resistivity of 260 kXm at 400°C [49].
3.2.3 Potassium bismuth titanate-bismuth ferrite lead titanate (BF-KBT-PT)
Mixed phase solutions such as x(K0.5Bi0.5)TiO3–(1-x) (Na0.5Bi0.5)TiO3 (KNBT) and the ternary system with BaTiO3 have been extensively researched as lead free alternatives in recent years [84, 85], but are deemed unsuitable alternatives to lead-based perovskites due to their poor electrical properties in relation to PZT, as well as low paraelectric phase transitions, degrading the piezo-electric properties at relatively low elevations in tempera-tures above ambient.
Combining BF with KBT has been investigated as recently as 2010 [86] combining tetragonally and rhom-bohedrally distorted perovskite end members, much in the same way as BFPT and PZT, but fell short of providing useful electrical properties at increased temperatures, due to a lack of long range ferroelectric order, instead forming nano-polar regions which cannot sustain a net polarisation once the applied field was removed. However work by Bennett et al. [13], have shown that even a relatively modest addition of lead titanate (27.5 %) compared to that found in PZT ([60 %) has the effect of locking in the required long range ferroelectric order and yielding a d33=205 pC/N, d31= -41.9 pC/N and Tc=575 °C at the ternary MPB. These properties seem promising for a high temperature, lead light, low cost, piezoelectric mate-rial, as they persist in a relatively stable manner with temperature variation. Although a polymorphic phase transition at*350 °C subsequently causes de-poling (Td), limiting the operating temperature to\330°C, it is thought a doping regime could push this de-poling temperature higher, although perhaps at the reduction of TC.
Despite this, it is perhaps the strain generated in the BF0.575–KBT0.15–PT0.275 material that is the most striking feature, and of most interest for the scope of this project, being 0.805 %. As an actuator, this composition exhibits the largest strain of any polycrystalline material published in the literature to date, and occurs from a partial phase transformation on poling combined with the pres-ence of NPR’s within the local ferroelectric structure.
Tailoring of the ternary system also allows a material to be optimized according to the application [87], which offers flexibility and tunability as does PZT, but at sig-nificantly higher operating temperatures.
3.2.4 Summary
4 Modification of BF-KBT-PT for high
temperature metrology
4.1 Experimental
Modestly (\5 %) donor doped modified ceramic powders of the 0.567BF-0.188KBT-0.245PT (D2) ternary system [87] were prepared by conventional solid-state synthesis, as it was expected to improve the resistivity and offer stable high temperature properties for metrology. Herein, this material nomenclature will be D2?, where as reported elsewhere in detail, stoichiometric quantities of the starting reagents were mixed with yttria stabilized zirconia balls in isopropyl alcohol using a high energy bead mill (Willy A. Bachofen, Basel, Switzerland) for 30 min, followed by drying and sieving through 200lm. The subsequent powder was calcined at 800°C for 4 h in covered cru-cibles. Binder was subsequently added and the powder pressed into 12 mm diameter pellets and sintered at 1050°C for 2 h, before being ground and polished with SiC (Buehler, Germany) to 1 mm thick. Finished pellets were electroded by sputtering with 50 nm of Ti, and 200 nm of Au as layers (Quorum Technologies ltd. Lewes, UK). Density was measured using the Archimedes method and established to be 7700 kg/m3.
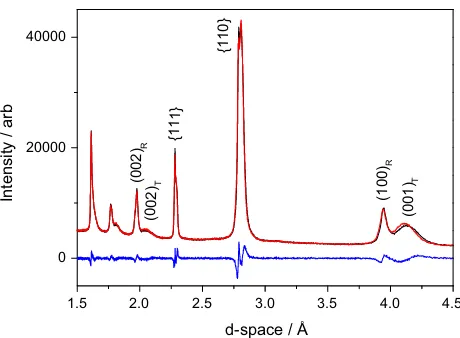
Samples were poled at 6 kV/mm at 100°C in silicone oil for 10 min before being left for 24 h and subsequent measurements taken. The current was recorded throughout to determine high field resistivity. X-ray diffraction (Phil-lips X’Pert MPD, Almelo, The Netherlands) was used to identify the crystal structure on poled non-electroded samples (Fig.1).
Parallel capacitance (CP) was measured at 1 kHz– 1 MHz as a function of temperature using an Agilent 4294A, with a non-inductively wound furnace. The TCwas determined from the maximum in calculated dielectric permittivity (Eq.2) upon cooling (at 2°C/min) from 600°C on un-poled samples. The operating temperature was defined as Td, and characterized from resonance, where three geometries were cut from discs and poled to
meet the requirements for the various vibration modes described in BS EN 50324-1 [11]. This included a longi-tudinal length mode bar, transverse length plate and thickness shear plate, with a radial mode served by the as-made discs.
Each geometry was placed into a modified TA Instru-ments Thermal Mechanical Analyser (TMA) at NPL (Fig.2), connected to an Agilent 4294a impedance analy-ser, with frequency sweeps controlled with LabVIEW (National Instruments, TX, USA) at 20°C steps when heated at 2°C/min. Calibration runs were taken across the frequency limits of the 4294a in open and short configu-ration for fixture compensation in post processing.
The frequency range and parameters set for each geometry are outlined in Table4, and analysis conducted by identification of fsand fpfrom maxima and minima in conductance and resistance respectively [88]. Impedance spectroscopy was completed on un-poled discs at 50°C intervals, with data collected from frequencies spanning 1.5 2.0 2.5 3.0 3.5 4.0 4.5 0
20000 40000
(0
0
1
)T (10
0
)R
(0
0
2
)T
(0
0
2
)R {1
1
1
}
Intensity / arb
d-space / Å
{1
1
0
}
[image:8.595.52.543.73.176.2]Fig. 1 X-ray diffraction pattern of the un-modified D2 (black dotted) and modified D2? (solid red) KBT-BF-PT morphotropic phase boundary system. A difference plot is shown below (solid blue), and rhombohedral (subscript R) and tetragonal (subscript T) phases identified (Color figure online)
Table 3 Properties of selected mixed phase polycrystalline piezoelectric materials with operating temperatures above PZT
Material Mixed phase polycrystalline materials
FEa Structure d33b (pC/N) ktb qb(Xm) Tet. c/a ratio Temp. stability TC(°C) Max op. temp. (°C)
BFPTc Yes Perovskite 160d 0.28 1010 1.187 Med 635 –
Doped BFPTc Yes Perovskite 120 0.31 1011 1.045 Med 420 330
Nb doped BIPTc Yes Perovskite 60 0.38 1.08 Med 542 380
BSPTc Yes Perovskite 450 0.49 1010 1.02 Med 450 350
BF-KBT-PTc Yes Perovskite 205 0.36 1010 1.035 Med 575 320
[image:8.595.310.540.221.390.2]10 MHz–0.01 Hz at 10 points per decade using a ModuLab MTS (Solartron Analytical, UK), with data fitted to a circle fromZ0/Z00plots for analysis (Table 5).
4.2 Results and discussion
X-ray diffraction reveals a mixed, rhombohedrally and tetragonally distorted, perovskite phase structure with no discernable insoluble phases. It is observed that little has been modified by the addition of the donor dopant, with the tetragonal a and c lattice vectors varying insignificantly, retaining a spontaneous strain of 3.5 % as per the un-modified D2 material. It is expected then that the Berlin-court measured d33should remain approximately the same between D2 and D2? as these are intrinsically linked. Indeed a value of 197 pC/N is measured for a disc, which is
in agreement, within the error of the measurement, with the un-doped variant [87]. Derived dielectric permittivity from the measured parallel capacitance (CP) on cooling from 600 °C exhibits a peak for 1 kHz at 467°C for TC in the D2?system (Fig.3), which indicates a 45°C increase in the ferroelectric to paraelectric phase transition TC from D2. However an increase in TCfor the D2?material is not expected compared with typical doping studies [49,89] of similar materials.
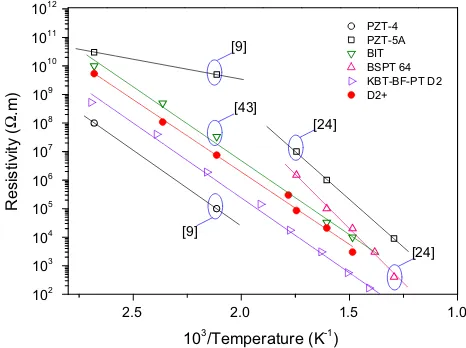
Resistivity data supports this, with the doping regime exhibiting an order of magnitude increase in volume resis-tivity across the temperature range measured (22–400°C) (Fig.4), where the D2 material exhibits a resistivity of 3050 Xm at 400°C, which equates to a fLL=2.2 kHz;
Suffi-ciently in excess of the 1 kHz measurement, to prevent the material from charging fully and represented by the increasing tand loss. For the D2? material, the increased resistivity maintains afLL =527 Hz at 400°C (Fig.5), but
extrapolates to 1 kHz around the assumed TC at 467°C. This indicates that the conductivity mechanism is domi-nating the capacitance measurement, rather than a true ferroelectric-paraelectric phase transition. This obviously indicates further work is required to establish a true TC, and that the resistivity as a function of temperature is likely to provide the frequency dispersion observed in Fig.3.
Importantly for this work, the piezoelectric properties calculated from resonance determine a room temperature kt=0.5 and kp=0.36. The effect of temperature on d31 from resonance is shown in Fig.6 where the near linear proportional increase is ideal for the purposes of both metrology and device integration. A de-poling temperature is determined at Td=416°C where the piezoelectric properties cease, and are independent of conductivity,
[image:9.595.53.287.56.233.2]Fig. 2 Photograph of the experimental setup with the oven removed
Table 4 Summary of geometries used for piezoelectric resonance analysis for the D2 and D2?materials
Geometry Thickness
(t) (mm)
Width (w) (mm)
Length (l) (mm)
Poled length (mm)
Frequency sweep (kHz)
Ambient keff
Radial mode 1 12 (dia) – 1 160–205 0.32
Longitudinal length extensional
1 1 2.5 2.5 550–800 0.46
Transverse length extensional
1 3 15 1 85–120 0.24
Thickness shear 4 0.2 14 4 2500–5000 0.46
Table 5 Summary of the modified D2?material from this work
Material FEa Structure d
33
b (pC/N) k t
b qb(Xm) Tet. c/a ratio Temp. stability T
C(°C) Max op. temp. (°C) Modified KBT-BF-PTcD2? Yes Perovskite 180 0.5 1011 1.035 Med 467 380
[image:9.595.51.545.506.610.2] [image:9.595.51.549.655.689.2]where the resonance measurements undertaken are at fre-quencies much greater than the fLL for the de-poling temperature.
A disc used for calculating the planar measurements was subsequently re-poled after the permittivity measurement, and re-tested using the resonance method. It is shown that the material exhibits excellent agreement for the calculated kpas the first run, indicating that the temperature excur-sions have little effect on the materials composition and structure. A maximum long term operating temperature was therefore established as 380°C.
4.3 Conclusions
High temperature piezoelectric materials are developing into a mature technology, with increasing requirement in a number of important applications. To meet this demand and to successfully engineer new products based on these materials requires reliable tools and standards for measur-ing piezoelectric couplmeasur-ing at high temperature. Validation of these methods will require high coupling materials that are sufficiently stable up to high temperature to perform comparisons with low uncertainty of measurement. These attributes are also beneficial in an engineering context to provide stable performance over a wide temperature range. Here we present a donor doped modified MPB composition of polycrystalline KBT-BF-PT, D2?, which displays rela-tively stable piezoelectric properties. Relative improvements to the charge and electromechanical coupling coefficients, enable good signal to noise analysis from resonance tech-niques, and the increased resistivity over the un-modified material represents good applicability for both sensing and actuation modes across a broad frequency scale [27]. This new material is comparable in high temperature properties to BSPT and BIT in the literature, and benefits from similar 300 350 400 450 500
0 2000 4000 6000 8000 10000 12000 14000 16000 18000 20000
r
Temperature (°C) 1 kHz
10 kHz 100 kHz 1 MHz
0.0 0.2 0.4 0.6 0.8 1.0 1.2 1.4 1.6 1.8 2.0
tan
δ
ε
Fig. 3 Relative permittivity (from parallel capacitance) and dielectric loss as a function of temperature over a range of frequencies from 1 kHZ–1 MHz for the modified D2?material
2.5 2.0 1.5 1.0
102 103
104
105
106
107
108
109 1010
1011
1012
[24]
[24] [43]
PZT-4 PZT-5A BIT BSPT 64 KBT-BF-PT D2 D2+
Resistivity (
.m)
103/Temperature (K-1) [9]
[9]
Ω
Fig. 4 Volume resistivity as a function of temperature for a range of piezoelectric materials from the literature and this work. Material references can be found in the text
100 200 300 400 1m
10m 100m 1 10 100 1k 10k
D2+ D2
fLL
(Hz)
Temperature (°C)
Fig. 5 The calculated lower limit frequency for the D2 and D2?
materials as a function of temperature
50 100 150 200 250 300 350 400 0.0
0.1 0.2 0.3 0.4
kp
Temperature (°C)
0 50 100 150 200 250 300 350
calculated d
31
(- pC/N)
Fig. 6 Planar electromechanical coupling factor from a disc of D2?
[image:10.595.310.540.55.212.2] [image:10.595.54.284.58.211.2] [image:10.595.53.286.268.442.2] [image:10.595.54.288.515.685.2]synthesizing routes as PZT, and requires no rare earth or ‘precious’ metal oxides in its manufacture.
The modified KBT-BF-PT material is an ideal candidate for piezoelectric device integration up to 380°C, with a CTE orthogonal to the poling direction of 8910-6K-1, which is compatible with titanium and stainless steel for electroding and packaging respectively.
Acknowledgments Access to materials for the METCO project have been granted by Ionix Advanced Technologies Ltd and the University of Leeds. The work here has been funded under the European Metrology Research Programme NEW09 METCO. The EMRP is jointly funded by the EMRP participating countries within EURAMET and the European Union.
Compliance with ethical standards
Disclosures Ionix Advanced Technologies Ltd is a spin out of the University of Leeds where the authors are licensed to use the IP generated by the University of Leeds.
Open Access This article is distributed under the terms of the Creative Commons Attribution 4.0 International License (http://crea tivecommons.org/licenses/by/4.0/), which permits unrestricted use, distribution, and reproduction in any medium, provided you give appropriate credit to the original author(s) and the source, provide a link to the Creative Commons license, and indicate if changes were made.
References
1. S. Zhang, F. Yu, J. Am. Ceram. Soc.94, 3153 (2011)
2. M.N. Hamidon, V. Skarda, N.M. White, F. Krispel, P. Krempl, M. Binhack, W. Buff, Sens. Actuators A Phys. 123–124, 403 (2005)
3. T. Stevenson, T. Quast, G. Bartl, T. Schmitz-kempen, P.M. Weaver, IEEE Trans. Ultrason. Ferroelectr. Freq. Control62, 88 (2015)
4. X. Jiang, K. Kim, S. Zhang, J. Johnson, G. Salazar, Sensors14, 144 (2014)
5. M.J. Schulz, M.J. Sundaresan, J. Mcmichael, D. Clayton, R. Sadler, B. Nagel, J. Intell. Mater. Syst. Struct.14, 693 (2003) 6. N.E. Todreas, M.S. Kazimi,Nuclear Systems, 2nd edn.
(Hemi-sphere, Washington, 1990)
7. S. Zhang, X. Jiang, M. Lapsley, P. Moses, T.R. Shrout, Appl. Phys. Lett.96, 013506 (2010)
8. R.S. Weis, T.K. Gaylord, Appl. Phys. A37, 191 (1985) 9. D. Damjanovic, Solid State Mater. Sci.3, 469 (1998)
10. P.M. Weaver, C. Baldauf, T. Stevenson, T. Quast, G. Bartl, T. Schmitz-kempen, M.G. Cain, M. Stewart, inActuator 2014; 14th
International Conference New Actuators, ed. by H. Borgmann
(Bremen, 2014), pp. 60–63 11. CENELEC EN 50324-2 (2002)
12. R.C. Turner, P.A. Fuierer, R.E. Newnham, T.R. Shrout, Appl. Acoust.41, 299 (1994)
13. J. Bennett, A.J. Bell, T.J. Stevenson, T.P. Comyn, Scr. Mater.68, 491 (2013)
14. K.W.K.K.W. Kwok, H.L.W. Chan, C.L. Choy, IEEE Trans. Ultrason. Ferroelectr. Freq. Control44, 733 (1997)
15. H. Jaffe, B. Cook, W.R. Jaffe,Piezoelectric Ceramics(Academic Press, London, 1971)
16. M.G. Cain, M. Stewart, Meas. Good Pract. Guid. No. 33, vol. 33 (2001)
17. S. Zhang, C.A. Randall, T.R. Shrou, IEEE Trans. Ultrason. Fer-roelectr. Freq. Control52, 564 (2005)
18. S. Zhang, J. Cryst. Growth234, 210 (2002)
19. T.R. Shrout, S.J. Zhang, J. Electroceram.19, 111 (2007) 20. P.M. Weaver, T. Stevenson, T. Quast, G. Bartl, T.
Schmitz-Kem-pen, P. Woolliams, A. Blumfield, M. Stewart, M.G. Cain, J. Mater. Sci. Mater. Electron. (2015). doi:10.1007/s10854-015-3285-8 21. P.M. Weaver, M.G. Cain, M. Stewart, J. Phys. D Appl. Phys.43,
165404 (2010)
22. E. Sawaguchi, J. Phys. Soc. Jpn.8, 615 (1953)
23. A.J. Moulson, J.M. Herbert, Front matter, in Electroceramics:
Materials, Properties, Applications, 2nd edn. (John Wiley &
Sons, Ltd, Chichester, 2003)
24. A.J. Bell, J. Eur. Ceram. Soc.28, 1307 (2008) 25. S. Zhang, J. Appl. Phys.95, 4291 (2004)
26. S. Zhang, R.E. Eitel, C.A. Randall, T.R. Shrout, E.F. Alberta, Appl. Phys. Lett.86, 262904 (2005)
27. M.E. (Morgan Electroceramics), Datasheet http://www.morgan electroceramics.com/materials/soft-Pzt/. 10 (2013)
28. G. Shirane, S. Hoshino, K. Suzuki, Phys. Rev.80, 1105 (1950) 29. J. Remeika, A. Glass, Mater. Res. Bull.5, 37 (1970)
30. A. Sani, M. Hanfland, D. Levy, J. Solid State Chem.167, 446 (2002)
31. V.V.S.S. Sai Sunder, A. Halliyal, A.M. Umarji, J. Mater. Res.10, 1301 (1995)
32. Y. Matsuo, H. Sasaki, J. Am. Ceram. Soc.49, 229 (1966) 33. M.H. Francombe, B. Lewis, Acta Crystallogr.11, 696 (1958) 34. G. Goodman, J. Am. Ceram. Soc.36, 368 (1953)
35. J. Valasek, Phys. Rev.17, 475 (1921)
36. G. Catalan, J.F. Scott, Adv. Mater.21, 2463 (2009)
37. V.V. Shvartsman, W. Kleemann, R. Haumont, J. Kreisel, Appl. Phys. Lett.90, 172115 (2007)
38. G.S. Tomashpol’skii, Y.Y. Venevstev, Y.N. Zhdanov, Sov. Phys. Dokl.8, 1144 (1964)
39. C. Michel, Solid State Commun.7, 701 (1969)
40. M.M. Kumar, V.R. Palkar, K. Srinivas, S.V. Suryanarayana, Appl. Phys. Lett.76, 2764 (2000)
41. F. Kubel, H. Schmid, Acta Crystallogr. Sect. B Struct. Sci.46, 698 (1990)
42. C. Sun, X. Chen, J. Wang, G. Yuan, J. Yin, Z. Liu, Solid State Commun.152, 1194 (2012)
43. E.T. Wefring, M.-A. Einarsrud, T. Grande, Phys. Chem. Chem. Phys.17, 9420 (2015)
44. T. Kimura, T. Goto, H. Shintani, K. Ishizaka, T. Arima, Y. Tokura, Nature426, 55 (2003)
45. J. Wang, J.B. Neaton, H. Zheng, V. Nagarajan, S.B. Ogale, B. Liu, D. Viehland, V. Vaithyanathan, D.G. Schlom, U.V. Waghmare, N. Spaldin, K.M. Rabe, M. Wuttig, R. Ramesh, Science299, 1719 (2003) 46. W. Prellier, M.P. Singh, P. Murugavel, J. Phys. Condens. Matter
17, R803 (2005)
47. H. Shulman, M. Testorf, J. Am. Ceram. Soc.79, 3124 (1996) 48. R.E. Eitel, C.A. Randall, T.R. Shrout, P.W. Rehrig, W.
Hack-enberger, S. Park, Jpn. J. Appl. Phys.40, 5999 (2001)
49. S. Zhang, R. Xia, C.A. Randall, T.R. Shrout, R. Duan, R.F. Speyer, J. Mater. Res.20, 2067 (2005)
50. B.H. Park, B.S. Kang, S.D. Bu, T.W. Noh, J. Lee, W. Jo, Nature 401, 682 (1999)
51. W. Hu, X. Tan, K. Rajan, J. Eur. Ceram. Soc.31, 801 (2011) 52. Z. Cai, G. Wang, G. Yu, Z. Huang, F. Cao, X. Dong, J. Alloys
Compd.525, 149 (2012)
53. T.Y. Ansell, D.P. Cann, Mater. Lett.80, 87 (2012)
55. T. Sebastian, I. Sterianou, I.M. Reaney, T. Leist, W. Jo, J. Ro¨del, J. Electroceram.28, 95 (2012)
56. T. Leist, K.G. Webber, W. Jo, E. Aulbach, J. Ro¨del, A.D. Prewitt, J.L. Jones, J. Schmidlin, C.R. Hubbard, Acta Mater. 58, 5962 (2010)
57. T.P. Comyn, T. Stevenson, A.J. Bell, J. Phys.128, 13 (2005) 58. T. Takenaka, H. Nagata, J. Eur. Ceram. Soc.25, 2693 (2005) 59. S. Sherrit, X. Bao, Y. Bar-Cohen, Z. Chang, Struct. Mater.5387,
411 (2004)
60. PiezoTechnologies, Reference Table (2015) 61. S. Zhang, F. Li, J. Appl. Phys.111, 031301 (2012)
62. W.L. Zhong, Y.G. Wang, S.B. Yue, P.L. Zhang, Science (80)90, 383 (1994)
63. K. Scho¨nau, M. Knapp, H. Kungl, M. Hoffmann, H. Fuess, Phys. Rev. B76, 144112 (2007)
64. F. Rubio-Marcos, J.J. Romero, D.A. Ochoa, J.E. Garcı´a, R. Perez, J.F. Fernandez, J. Am. Ceram. Soc.93, 318 (2010)
65. D.A. Hall, A. Steuwer, B. Cherdhirunkorn, T. Mori, P. Withers, Acta Mater.54, 3075 (2006)
66. D.A. Hall, A. Steuwer, B. Cherdhirunkorn, P. Withers, T. Mori, Ceram. Int.34, 679 (2008)
67. S.A. Fedulov, P.B. Ladyzhinskii, I.L. Pyatigorskaya, Y.N. Venevstev, Sov. Phys. Solid State6, 375 (1964)
68. S.A. Fedulov, Dokl. Akad. Nauk. SSSR 139, 1345 (1961) (translated from Russian)
69. T. Stevenson, T.P. Comyn, A. Daoud-aladine, A.J. Bell, J. Magn. Magn. Mater.322, L64 (2010)
70. C.M. Yagnik, J.P. Canner, R. Gerson, W.J. James, J. Appl. Phys. 40, 4713 (1969)
71. R.T. Smith, G.D. Achenbach, R. Gerson, W.J. James, J. Appl. Phys.39, 70 (1968)
72. D.I. Woodward, I.M. Reaney, R.E. Eitel, C.A. Randall, J. Appl. Phys.94, 3313 (2003)
73. T. Stevenson, J. Bennett, A.P. Brown, T. Wines, A.J. Bell, R.I. Smith, T.P. Comyn, APL Mater.2, 086105 (2014)
74. R. Zuo, Y. Wu, J. Fu, S. Su, L. Li, Mater. Chem. Phys.113, 361 (2009)
75. R. Rai, A. Kholkin, S. Pandey, N.K. Singh, J. Alloys Compd. 488, 459 (2009)
76. J.-R. Cheng, N. Li, L.E. Cross, J. Appl. Phys.94, 5153 (2003) 77. T. Leist, W. Jo, T. Comyn, A. Bell, J. Ro¨del, Jpn. J. Appl. Phys.
48, 120205 (2009)
78. R.E. Eitel, C.A. Randall, T.R. Shrout, S.-E. Park, Jpn. J. Appl. Phys.41, 2099 (2002)
79. S. Sherrit, X. Bao, Y. Bar-Cohen, Z. Chang, Smart Struct. Mater. 411, 411 (2004)
80. H.J. Lee, S. Zhang, Y. Bar-Cohen, S. Sherrit, Sens. (Basel)14, 14526 (2014)
81. T.-H. Song, R.E. Eitel, T.R. Shrout, C.A. Randall, W. Hacken-berger, Jpn. J. Appl. Phys.42, 5181 (2003)
82. T. Sebastian, I. Sterianou, D.C. Sinclair, A.J. Bell, D.A. Hall, I.M. Reaney, J. Electroceram.25, 130 (2010)
83. I. Sterianou, D.C. Sinclair, I.M. Reaney, T.P. Comyn, A.J. Bell, J. Appl. Phys.106, 084107 (2009)
84. A.J. Royles, A.J. Bell, A.P. Jephcoat, A.K. Kleppe, S.J. Milne, T.P. Comyn, Appl. Phys. Lett.97, 132909 (2010)
85. B. Chu, D. Chen, G. Li, Q. Yin, J. Eur. Ceram. Soc.22, 2115 (2002)
86. J.M. Kim, Y.S. Sung, J.H. Cho, T.K. Song, M.H. Kim, H.H. Chong, T.G. Park, D. Do, S.S. Kim, Ferroelectrics404, 88 (2010) 87. J. Bennett, A.J. Bell, T.J. Stevenson, T.P. Comyn, Appl. Phys.
Lett.103, 152901 (2013)
88. S. Zhang, E.F. Alberta, R.E. Eitel, C.A. Randall, T.R. Shrout, IEEE Trans. Ultrason. Ferroelectr. Freq. Control52, 564 (2005) 89. T. Leist, T. Granzow, W. Jo, J. Ro¨del, J. Appl. Phys.108, 014103