Received 7 May 2015
|
Accepted 18 Jun 2015
|
Published 31 Jul 2015
Hydrologically driven ecosystem processes
determine the distribution and persistence of
ecosystem-specialist predators under climate
change
Matthew J. Carroll
1,2
, Andreas Heinemeyer
3
, James W. Pearce-Higgins
4
, Peter Dennis
5
, Chris West
3
,
Joseph Holden
6
, Zoe E. Wallage
7
& Chris D. Thomas
2
Climate change has the capacity to alter physical and biological ecosystem processes,
jeopardizing the survival of associated species. This is a particular concern in cool, wet
northern peatlands that could experience warmer, drier conditions. Here we show that
climate, ecosystem processes and food chains combine to influence the population
performance of species in British blanket bogs. Our peatland process model accurately
predicts water-table depth, which predicts abundance of craneflies (keystone invertebrates),
which in turn predicts observed abundances and population persistence of three
ecosystem-specialist bird species that feed on craneflies during the breeding season. Climate change
projections suggest that falling water tables could cause 56–81% declines in cranefly
abundance and, hence, 15–51% reductions in the abundances of these birds by 2051–2080.
We conclude that physical (precipitation, temperature and topography), biophysical
(evapotranspiration and desiccation of invertebrates) and ecological (food chains) processes
combine to determine the distributions and survival of ecosystem-specialist predators.
DOI: 10.1038/ncomms8851
OPEN
1RSPB Centre for Conservation Science, Royal Society for the Protection of Birds, The Lodge, Sandy, Bedfordshire SG19 2DL, UK.2Department of Biology,
University of York, Wentworth Way, York YO10 5DD, UK.3Department of Environment, Stockholm Environment Institute, University of York, York YO10 5DD, UK.4British Trust for Ornithology, The Nunnery, Thetford, Norfolk IP24 2PU, UK.5Institute of Biological, Environmental and Rural Sciences, Aberystwyth University, Cledwyn Building, Penglais Campus, Ceredigion SY23 3DD, UK.6water@leeds, School of Geography, University of Leeds, Leeds LS2 9JT, UK. 7water@leeds, School of Earth and Environment, University of Leeds, Leeds LS2 9JT, UK. Correspondence and requests for materials should be addressed to
C
limate change is predicted to drive substantial global
biodiversity loss, with changing climatic conditions
altering physical and biological ecosystem processes, in
turn threatening species unable to adapt to the rapidly changing
conditions
1–3. This is a major concern for northern peatlands,
where warmer, drier conditions under climate change could
reduce ecosystem suitability for species associated with cool, wet
conditions
4,5. Latitudinal and elevational retreats of northern and
montane species have been attributed to rising temperatures
6,7,
but distribution changes may also be driven by altered
moisture regimes
8,9, which are influenced by temperature,
precipitation, soil properties, vegetation and the topography of
the land
10. However, a lack of high-resolution, landscape-scale
moisture data can make moisture-driven changes harder to study.
Understanding potential climate change impacts on
moisture-dependent ecosystems may therefore require knowledge of the
system’s hydrological properties and the links between moisture
and ecosystem-specialist species.
Here we consider blanket bogs, important northern and
montane ecosystems defined by extensive deep peat soils over
rolling terrain, which are associated with cool, wet climates
11,12.
An excess of precipitation over evapotranspiration, poor drainage
and persistent high water tables are essential for blanket bog
formation and maintenance, with water tables typically staying
within 10 cm of the surface for
4
80% of the year
13,14. They are
important carbon repositories, storing over 2,000 TgC in the
United Kingdom alone
15, which contains around 18,000 km
2of
deep peat (around 7% of the UK’s land area)
11, corresponding to
7–13% of the world’s blanket bog area
16. UK blanket bogs
support a rich soil fauna
17and unique breeding bird and plant
assemblages
18. Craneflies (Diptera: Tipulidae) are keystone
insects in blanket bog ecosystems, dominating the soil fauna’s
abundance and biomass
17. Craneflies can constitute a major
dietary component for peatland breeding birds (36 and 42% dry
weight
across
studies
for
golden
plover
and
dunlin,
respectively)
19; adults and chicks take both larval and adult
craneflies
20, and higher availability of adult craneflies is associated
with higher chick growth and survival
21,22. While habitat
differences can cause spatial variation in diet composition
22,
craneflies remain important even after location effects have been
accounted for, making them a key prey resource for breeding
birds in British blanket bogs
19,20, from the South Pennines
22to
northern Scotland
23. However, cranefly eggs and larvae are
susceptible to desiccation, with high mortality under dry
conditions
24. As blanket bogs could experience warmer, drier
conditions under climate change
5, interactions between climate,
soil moisture, invertebrates and predators may need to be
identified for us to understand climate change impacts on blanket
bog biodiversity.
Accordingly, we model monthly peatland water-table depth
(WTD) as a function of climate and topography, and cranefly
abundance as a function of WTD, to test whether hydrological
processes and invertebrate food resources determine the
abun-dances and distributions of breeding birds in blanket bogs. We
validate performance of the hydrological model using data from
three British blanket bogs (Moor House, Oughtershaw Moss and
Lake Vyrnwy; Fig. 1), and show that both WTD fluctuations and
position are well replicated. We show that modelled mean
summer WTD is a significant predictor of observed adult cranefly
abundance the following year, and use the resulting relationship
to produce landscape-scale projections for three focal landscapes
(mid Wales, South Pennines and North York Moors; Fig. 1).
Within these landscapes, we show that climate change could drive
large declines in cranefly abundance by 2051–2080 through
changes in WTD. We then show that predicted cranefly
abundance is positively related to observed abundance and
persistence of golden plover, dunlin and red grouse in the South
Pennines. Finally, we show that declining cranefly abundance
under climate change could drive large declines in these
cranefly-reliant bird species. In conclusion, we show that climate,
hydrological processes and invertebrate food resources combine
to determine the abundances and distributions of
ecosystem-specialist predators.
Results
Modelling water-table depths
. We used the MILLENNIA model
of peatland carbon and hydrological processes
25to estimate
blanket bog WTD as a function of simple climatic (temperature
and precipitation) and topographic (slope, aspect and elevation)
inputs. We updated the model to reflect monthly WTD
patterns more accurately and tested predictions against dipwell
observations
from
three
British
blanket
bogs
(Fig.
2;
Supplementary Methods; Supplementary Data 1). At all sites,
modelled WTD was a highly significant predictor of observed
WTD, with 47–65% variation explained (Fig. 2). At Moor House
and Oughtershaw Moss in northern England, where automatic
dipwells sampled intact peat, mean WTD position was predicted
to within 0.2 cm. At Lake Vyrnwy in mid Wales, where manual
dipwells sampled peat with blocked drains, model performance
declined somewhat, with a greater difference between observed
and predicted WTD position and lower
R
2(Fig. 2). This is to be
expected, as manual monthly sampling is unlikely to accurately
reflect mean WTD across the whole month. Further, local
hydrology may not return to an entirely natural state after drain
blocking
26,27, but reduced model performance for drained peat
(see also Supplementary Methods) should have little impact at
landscape scales
28. Thus, the model was able to predict WTD
position and fluctuations as driven by climatic and topographic
conditions.
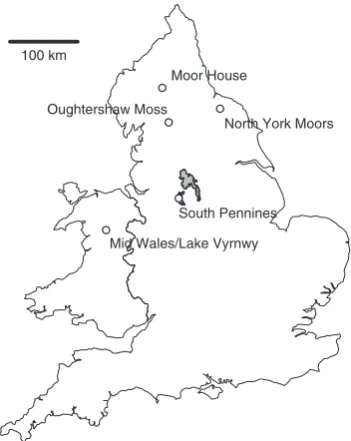
Mid Wales/Lake Vyrnwy South Pennines
North York Moors Moor House
[image:2.595.340.516.49.270.2]Oughtershaw Moss 100 km
Figure 1 | Map indicating locations of blanket bogs used in the analysis.
Modelling cranefly abundance
. We hypothesized that cranefly
abundance should be linked to predicted WTD, as WTD strongly
influences soil moisture
29and cranefly eggs and larvae are
sensitive to desiccation
24. We therefore ran the hydrological
model for 128 locations across three UK regions where we
collected
data
on
emerging
adult
cranefly
abundance
4(Supplementary Data 2). We extracted modelled WTDs for
July, August and September of the year preceding adult sampling,
as conditions during early larval stages have a dominant influence
on survival
24, and hence on adult abundance
5. Modelled WTD
was a highly significant predictor of observed cranefly abundance
(generalized linear model (GLM), negative binomial error
and log link, with a ‘region’ factor included to account for
unmeasured differences among sites: intercept
¼
5.203
±
0.745
s.e.,
z
¼
6.986,
P
o0.001; estimate
¼
0.333
±
0.089,
z
¼
3.766,
P
o0.001; d.f.
¼
124, 20.3% deviance explained). Further deviance
was explained by including anthropogenic drainage as an
additional factor (intercept
¼
4.885
±
0.681,
z
¼
7.178,
P
o0.001;
estimate
¼
0.310
±
0.081,
z
¼
3.827,
P
o0.001; d.f.
¼
123,
39.0% deviance explained), but as parameter estimates did not
differ significantly and drainage effects are highly localised
28, we
preferred the simpler model for all subsequent analyses. The
proportion of deviance explained is constrained by fine-scale
spatial heterogeneity in cranefly abundance
4, but this is not
expected to be relevant when aggregating density estimates at the
scale of bird territories (up to 10
6m
2)
22. Hence, modelled WTD
was found to predict broad-scale patterns of cranefly abundance.
The hydrological model’s predictive capacity allowed us to
extend WTD estimates to landscape scales. The model was run
for every combination of slope, aspect and elevation in each of
our three study landscapes (using a 10
10-m digital elevation
model (DEM), and driven by observed climate data
30for
1914–2010). Predicted WTDs were estimated for a climatic
baseline period of 1961–1990; these enabled us to estimate
landscape-scale cranefly abundances using the above GLM
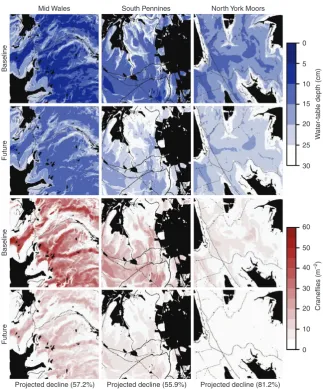
linking WTD to cranefly abundance (Fig. 3; Supplementary
Data 3). Shallow WTDs and high cranefly abundances occurred
on relatively flat hilltops, and lower moisture and abundances
occurred on steeper slopes, replicating observed patterns
31. There
was also an overarching longitudinal gradient, driven by
Water−table depth (cm)
Water−table depth (cm) Water−table depth (cm)
1999 2000 2001 2002 2003 2004 2005 2006 2007 2008 2009 2010 2011 25
20 15 10 5 0 –5
Year
Observed mean WTD = 4.1±4.33 cm Predicted mean WTD = 4.3±4.01 cm
Regression: intercept = 0.595±0.350, estimate = 0.813±0.060, R2=0.567, P≤0.001
2008 2009 2010 2011
25 20 15 10 5 0 −5 −10
Year
Observed mean WTD = 1.8±2.9 cm Predicted mean WTD = 4.4±3.46 cm Intercept = −0.726±0.630, estimate = 0.54±0.107
R2 = 0.474, P≤0.001
Observed mean WTD = 5.9±3.58 cm Predicted mean WTD = 5.8±4.98 cm Intercept = −2.474±0.804, estimate = –0.580±0.106
R2 = 0.653, P≤0.001
2005 2006
25 20 15 10 5 0 −5
Year
a
[image:3.595.130.467.51.405.2]b
c
geographic climate variation
4: wettest in the west (Mid Wales;
1961–1990 mean annual rainfall, 2,071 mm; derived from UK
Met Office gridded data
30), drier in central areas (South Pennines;
1,359 mm) and driest in the east (North York Moors; 1,016 mm).
Projecting climate change impacts
. Climate change impacts
were examined by driving the model with UKCP09 climate
change projection data for an ‘intermediate’ climate change
sce-nario for 2011–2080 (ref. 32). Projections suggested that WTDs
will become deeper over time, and hence average cranefly
abundances could decline by 55.9–81.2% between the 1961–
1990 baseline and 2051–2080 (Fig. 3; Supplementary Data 3).
Regressions of decadal mean cranefly abundance against time
indicated that all projected declines were significant (in craneflies
per m
2per year: Mid Wales, estimate
¼
0.191
±
0.038 s.e.,
R
2¼
0.648,
F
1,14¼
25.80,
P
o0.001; South Pennines, estimate
¼
0.121
±
0.038,
R
2¼
0.421,
F
1,14
¼
10.17,
P
¼
0.007; North York
Moors, estimate
¼
0.120
±
0.028,
R
2¼
0.563,
F
1,14
¼
18.02,
P
o0.001; Supplementary Data 4). These declines could be
con-servative because the hydrological model may underestimate the
deepest WTDs (Fig. 2) and there may be a moisture threshold
below which craneflies cannot survive
4. Overall, however,
substantial cranefly abundance declines were projected, driven
by falling summer water tables associated with warmer, drier
July–September conditions.
Effects of food availability on breeding bird populations
. To
quantify the extent to which craneflies influence the distribution
and abundance of their predators, we examined three bird species
for which craneflies are important dietary components
19. We
predicted cranefly abundance for 557 1
1-km grid squares in
the South Pennines, where large-scale breeding bird surveys were
undertaken in 1990 (ref. 33) and 2004 (ref. 34). Modelled cranefly
abundance from the years immediately preceding the bird surveys
(that is, 1989 and 2003) was a highly significant predictor of the
abundances of all three bird species (Fig. 4; Supplementary
Table 1; Supplementary Data 5), suggesting that cranefly
availability can influence their abundances on a large scale.
Cranefly abundance also predicted bird population persistence:
we compared predicted cranefly abundance, averaged across the
two
survey
periods,
in
squares
where
birds
were
absent both years (‘empty’); present in 1990 but absent in 2004
Mid Wales South Pennines North York MoorsBaseline
Baseline
Future
Future
Projected decline (57.2%) Projected decline (55.9%) Projected decline (81.2%) 0
5
10
15
20
25
30
W
a
ter-tab
le depth (cm)
60
50
40
30
20
10
0
Cr
aneflies (m
[image:4.595.136.460.46.436.2]–2)
(‘extinct’); absent in 1990 but present in 2004 (‘colonised’); or
present both years (‘occupied’). Cranefly abundance differed
significantly among categories for all species (Fig. 4; Kruskal–
Wallis tests: dunlin
w
2¼
102.639, d.f.
¼
3,
P
o0.001; golden plover
w
2¼
247.791, d.f.
¼
3,
P
o0.001; red grouse
w
2¼
70.834, d.f.
¼
3,
P
o0.001). ‘Empty’ squares had significantly lower cranefly
abundance than other categories, and ‘occupied’ squares typically
had significantly higher abundance, while ‘colonised’ and ‘extinct’
squares were intermediate (Fig. 4; Supplementary Data 5). Hence,
the highest cranefly abundances were associated with areas where
bird populations appeared more stable (that is, birds were present
in both survey years), while locations with intermediate
abundances were seemingly less likely to sustain bird populations.
Thus, climate-driven cranefly declines would be expected to
lead to reductions in dependent bird populations, particularly in
the South Pennines, which is towards the southern range margin
for all three focal species
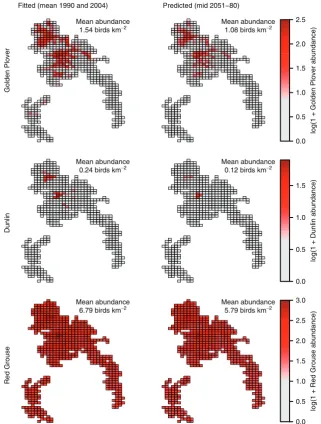
35. Projections for the South Pennines
(using relationships in Fig. 4 and Supplementary Table 2) for
1990 and 2004 (bird observation periods) and 2051–2080 (under
an intermediate climate change scenario) suggested that dunlin
could decline by 51.1%, golden plover by 29.7% and red grouse by
14.8% (Fig. 5; Supplementary Data 6). Declining food availability
could therefore drive declines in ecosystem-specialist predators,
with novel extreme conditions increasing local extinction risk for
dunlin and golden plover in particular.
Discussion
Here we have shown how climate, ecosystem processes and
ecological links combine to influence populations of
ecosystem-specialist predators. The ability to study such processes is made
possible in part because blanket bog ecosystems are strongly
dependent upon high water tables
11,13, and a single invertebrate
group plays a very important role in the soil fauna
17and the diet
of breeding birds
19. Even in this relatively reductive system,
however, other processes and drivers will contribute to real
outcomes, meaning that unexplained variation remained for all
three focal bird species. The most variation was explained for
dunlin (30.5–39.4%), and the least for red grouse (8.1–8.2%).
Such a pattern may be expected because, of the three focal species,
dunlin have the greatest proportion of craneflies in their diet,
while red grouse have the smallest
19. Some of the remaining
1989 predicted craneflies(m−2)
1989 predicted craneflies (m−2)
1989 predicted craneflies (m−2)
0 20 40 60 80 100 0
4 8 12 16
b = 0.035±0.002, P<0.001
b = 0.067±0.007, P < 0.001
b = 0.018±0.002, P<0.001 b = 0.061±0.008, P<0.001 b = 0.212±0.034, P<0.001 b = 0.132±0.009, P<0.001 28.8% deviance explained
2003 predicted craneflies
(m−2) Mean predicted craneflies(m−2)
2003 predicted craneflies (m−2)
2003 predicted craneflies (m−2)
2004 golden plover abundance
0 10 20 30 40 0 4 8 12 16 20
27.2% deviance explained
Mean predicted craneflies (m−2)
Mean predicted craneflies (m−2) Emp.
Ext. Col. Occ.
0 20 40 60 80 c b b a
0 20 40 60 80 100 0 2 4 6 8 10 12 14
39.4% deviance explained
2004 dunlin abundance
0 10 20 30 40 0 2 4 6 8 10 12 14
30.5% deviance explained
Emp. Ext. Col. Occ.
0 20 40 60 80 c b ab
a
0 20 40 60 80 100 0
20 40 60 80
100 8.2% deviance explained
2004 red grouse abundance
0 10 20 30 40 0
20 40 60 80
100 8.1% deviance explained
Emp. Ext. Col. Occ.
0 20 40 60 80 c a b a
Golden plover
1990 golden plover abundance
Dunlin
1990 dunlin abundance
Red grouse
1990 red grouse abundance
[image:5.595.121.480.45.423.2]1990 bird abundance 2004 bird abundance Bird population change 20
variation is likely to be methodological: the approach to
modelling cranefly abundance may not replicate all patterns
due to averaging (both across months of WTD predictions and
across grid cells of cranefly predictions) and propagation of
uncertainty. Further unexplained variation can be attributed to
local factors that could influence bird populations, but which
have not been explicitly included, such as vegetation type, land
management, predation and pathogen risk, weather in wintering
grounds, and density dependence
36–40. It should also be noted
that bird data for each grid square are based on only two survey
visits in each year
41, so some unexplained variation may be
attributed to survey methods. It is notable, however, that even
with such simplifications, modelled cranefly abundance still
predicted up to 39% of variation in observed bird abundance,
thus reflecting heavy reliance on this key food resource.
Modelled cranefly abundance was shown to differ among areas
with differing bird population persistence patterns. However,
peatland breeding bird abundance can show large fluctuations,
with golden plover abundance at one South Pennines site
fluctuating between 5 and
4
40 pairs over a 30-year period
5.
Cranefly populations also show interannual fluctuations, with
droughts driving substantial declines and wetter conditions
allowing populations to recover
4,24. In a well-studied golden
plover population in the South Pennines, interannual abundance
fluctuations have been linked to temperature-driven fluctuations
in cranefly populations
5. Hence, even beyond the extremes of
colonization and extinction, important aspects of breeding bird
population dynamics may be influenced by cranefly availability.
Were longer time series of bird data available, it would be
beneficial to examine the degree to which bird and cranefly
abundance track one another temporally and spatially, to further
examine how bird population dynamics are influenced by
climate-change-sensitive prey species.
On the basis of the climate change projections made here, birds
breeding in blanket bogs appear to be threatened by declining
food availability under climate change, driven by falling water
Mean abundance
1.54 birds km−2 Mean abundance1.08 birds km−2
0.0 0.5 1.0 1.5 2.0 2.5
log(1 + Golden Plover abundance)
Mean abundance
0.24 birds km−2 Mean abundance0.12 birds km−2
0.0 0.5 1.0 1.5
log(1 + Dunlin abundance)
Mean abundance
6.79 birds km−2 Mean abundance5.79 birds km−2
0.0 0.5 1.0 1.5 2.0 2.5 3.0
log(1 + Red Grouse abundance)
Golden Plover
Dunlin
Red Grouse
[image:6.595.137.459.49.474.2]Fitted (mean 1990 and 2004) Predicted (mid 2051−80)
tables. While prey switching might provide some buffering effect,
alternative prey, such as Chironomidae for dunlin and Coleoptera
for golden plover, are likely to show negative or neutral responses
to climate change
19. Indeed, few relevant invertebrate taxa
currently found in the focal bird species’ diets are likely to
respond positively to increased warming or drought
19. Further,
the focal populations are towards the southern range limit for the
three species
35, so adaptations such as prey switching may be less
likely to occur. Heavy reliance on craneflies, combined with the
sensitivity of other potential prey to warmer, drier conditions,
suggests that availability of invertebrate prey for peatland
breeding birds is likely to decline under climate change.
Climate change impacts on peatland breeding bird populations
will not, however, be exclusively mediated through changes in
prey abundance. Golden plover might experience a mismatch
between the timing of breeding and peak cranefly availability
42,
although prey abundance appears to be a stronger driver of
population trends
5. Golden plover chick growth rates are
positively correlated with breeding season temperatures
43, so
higher temperatures may provide some benefits. However,
breeding season weather appears to have limited
population-scale impacts
40. Further, indirect effects of climate change on
vegetation structure may have a strong impact on golden plover
habitat suitability
23. For red grouse, higher temperatures before
breeding are associated with earlier egg laying, larger clutch sizes
and higher chick survival, but higher temperatures during
breeding are associated with lower chick survival
44. Further,
another important driver of red grouse population trends,
parasitism, could be affected by climate change, with higher
temperatures leading to increased parasite development rates,
but drier conditions potentially reducing parasite transmission
45.
For dunlin, recruitment shows a quadratic relationship with
temperature,
with
maximum
recruitment
occurring
at
intermediate temperatures, thus possibly reflecting a balance
between mortality and prey availability
46. Climate change will
undoubtedly have complex effects on breeding bird populations,
integrating multiple interacting drivers
47. However, the cranefly
abundance declines projected here are likely only to have a
negative effect on bird populations, and the relationships
observed over recent years suggest that food availability is likely
to be a dominant driver of population change
5. Hydrological
management may, therefore, be required to protect these
globally important ecosystems and their associated species,
perhaps focussing conservation efforts on potential population
refugia where relatively high densities are predicted to remain
(for example, for golden plover, Fig. 5).
Our results indicate that blanket bog WTDs predict the
abundance of keystone invertebrates, and estimated invertebrate
abundance predicts the abundance and dynamics of breeding
birds. The links stem from physical inputs (precipitation,
temperature and topography) that drive soil moisture through
biophysical processes (peat development and evapotranspiration),
which in turn influence invertebrate survival. We find that
climate change could drive substantial declines in abundances of
keystone invertebrates and their predators, acting through soil
moisture. This mechanistic approach has been able to identify the
consequences of climate change for ecosystem function and
predators at a landscape scale. Such an approach may be useful in
other ecosystems, as climate change impacts on higher-level
consumers are likely to be mediated through altered species
interactions
2; comparable studies are therefore needed in other
threatened ecosystems.
Methods
Modelling blanket bog water-table depths
.
The MILLENNIA peatland cohort model25predicts annual peat accumulation for blanket bogs based on establishedrelationships between climate, net primary productivity and plant litter decomposition, with plant functional types influencing litter quality and hence peat growth. Plant functional types and decomposition rates are influenced by a dynamic WTD submodel. After a spin-up period to allow the peat column to develop, the model estimates carbon stocks and fluxes (for example, peat growth) and WTD. Model inputs are the topography of the point to be modelled (that is, slope, aspect and elevation) and simple climatic inputs (mean temperature and total precipitation). The WTD submodel considers water inputs from precipitation, water loss through runoff and evapotranspiration, and the pore space available in the peat. Runoff of incoming precipitation is influenced by the topographic slope and the antecedent WTD. Water loss through evapotranspiration is influenced by plant functional types (which are determined by long-term average WTD), temperature (which is affected by aspect and elevation) and rooting depth. A model comparison study48has shown that the model is suitable for modelling blanket bog
conditions, producing predictions similar to those from a process-based model requiring more comprehensive local parameterization.
Here, the published model25, which was originally intended to produce
estimates at an annual time scale, was updated to improve the representation of monthly water balances (Supplementary Methods). To evaluate performance, the updated model was driven by observed climate data, and resulting WTD predictions were tested against observed WTDs recorded from dipwells monitoring three UK blanket bogs (Supplementary Data 1). The primary evaluation used 12 years of WTD data from the Moor House Environmental Change Network site49in
northern England, with the model driven by climate data from a weather station at the same site. Moor House WTD data were taken from a single automatic dipwell, so to correct for systematic bias were calibrated against the average WTD from weekly readings of five nearby manual dipwells; this resulted in a 2.8-cm correction (that is, 2.8-cm shallower) applied to all months. Further evaluation was carried out using 18 months of automated dipwell data from Oughtershaw Moss in northern England and 3 years of manual dipwell data from Lake Vyrnwy in mid Wales26, with the model driven by UK Met Office gridded climate data30. Topographic data were derived from NEXTMap DEMs at a 1010-m scale (Intermap Technologies. NEXTMap Britain: Digital terrain mapping of the UK. NERC Earth Observation Data Centre, 2007. Available at http://badc.nerc.ac.uk); elevation was derived directly from DEMs, while slope and aspect were calculated using standard functions in ArcMap 9.3 (ESRI; Redlands, California, USA). Model performance was assessed by comparing mean predicted and observed WTD over the evaluation period, and then by regressing observed WTD against predicted WTD (Fig. 2). Model performance was found to be highest in intact peat, with local anthropogenic drainage appearing to reduce performance (see Supplementary Methods). Overall, model performance was deemed adequate to predict both the position and seasonal fluctuations of WTDs, two key elements required to understand impacts of climate change on blanket bog hydrology.
Modelling relationships between craneflies and WTD
.
To examine the rela-tionship between cranefly abundance and WTD, observed cranefly abundance was regressed against modelled WTD. Emerging adult cranefly abundance was observed in the field in 2009 and 2010 in three British blanket bogs, using emer-gence traps in a large-scale replicated experimental design4. Sampling sites wereset along a climatic gradient from mid Wales in the relatively wet west, through the South Pennines, to the North York Moors in the relatively dry east4(Fig. 1). At
each site, traps were active across the cranefly emergence period (late April to early July), with individual samples taken approximately every 20 days. Final abundance estimates were produced by summing counts across the entire period. Traps were set in quartets coveringB510 m, but each trap individually sampled only aroundB0.11 m2. As WTD predictions were limited to the spatial resolution of the
DEMs (that is, 1010 m), cranefly counts from individual traps were summed to give a single abundance value per quartet of traps, meaning that resolutions of abundance observations and model projections were more closely matched. This aggregation meant that counts from 128 individual sample locations were available (Supplementary Data 2). MILLENNIA was then run for each location, with topographic variables derived from NEXTMap DEMs and the model driven by UK Met Office gridded climate data30, to produce monthly estimates of WTD.
In blanket bogs, cranefly adults are conspicuous during the mass emergence period in spring, but the majority of their lifecycle is spent in the upper layers of the peat24. Cranefly eggs and larvae experience high mortality when conditions become too dry, with the eggs and first two larval instars being the most susceptible24,50,51. InTipula subnodicornis, the main large-bodied spring-emerging blanket bog cranefly species, the period with greatest desiccation risk is therefore approximately in July to September24. Emerging adult cranefly abundance in the spring is lower following warmer Augusts in the previous year5, which is likely to reflect impacts of drought on survival during this sensitive period. Therefore, WTDs were extracted for July, August and September (hereafter, ‘summer’) of the year preceding sampling, and the mean WTD across the 3 months was calculated (Supplementary Data 2). Observed cranefly abundances were then modelled as a function of predicted summer WTD and a region factor (to account for unmeasured differences among sites, for example, peat structure and vegetation), using a GLM with negative binomial error and log link function, and fitted using the ‘MASS’ R package52in R v3.01 (ref. 53); modelled summer WTD was a significant predictor
regression equation was used to convert modelled WTD to cranefly abundance. The minimum summer WTD was also trialled as a predictor, but while a significant relationship was still found, it described less variation in cranefly abundance than did mean WTD (intercept¼2.976±0.220 s.e.,z¼13.516, Po0.001; estimate¼ 0.203±0.076,z¼ 2.671,P¼0.008; d.f.¼124, 16.0% deviance explained), so the mean was preferred for further analyses.
Producing landscape-scale estimates
.
MILLENNIA produces point estimates, but landscape-scale patterns of WTD and cranefly abundance were required for the three focal landscapes (see above). To achieve this, the 55-km grid square covering each site was selected from the UK Met Office gridded weather dataset30, and slope, aspect and elevation were calculated for all 1010 m cells using NEXTMap DEMs. MILLENNIA was run for all combinations of slope, aspect and elevation in each landscape, and each 10-m grid cell was assigned predicted WTD values from the run corresponding to its topography. To reduce the number of model runs required to describe each landscape, topographic variables were aggregated into intervals of 50 m for elevation, 10°for aspect and 1°for slope; interval sizes were chosen to allow the relationship between WTD and each variable to be adequately described. As model processes are one-dimensional, modelled grid cells do not interact with nearby cells. Two-dimensional processes such as accumulation of water in depressions and drainage from ridges54,55 therefore cannot be represented, meaning that this simplified spatial representation may not predict exact locations of wet or dry areas. However, this approach does allow the dominant topography and the degree of topographic heterogeneity within modelled blanket bogs to be taken into account, so important landscape components such as steep, dry slopes and flat, wet hilltops should still be reflected. When soil moisture recorded from cranefly sampling locations4was regressed against modelled WTDs, WTD was found to be a significant predictor of moisture (linear regression: intercept¼1.013±0.044,t¼22.893,Po0.001;WTD¼ 0.031±0.006,t¼ 5.362,Po0.001;F1,126¼28.75,R2¼18.6%;
Supplementary Data 2), showing deeper WTDs associated with drier peat and confirming that the model was able to reproduce spatial moisture patterns.
As MILLENNIA is parameterised for blanket peats, but each 5-km grid square contained a variety of habitat and soil types, areas for which model projections would not apply were removed. First, Ordnance Survey MasterMap data (Crown Copyright/database right 2012, an Ordnance Survey/EDINA supplied Service: License 100018355) allowed us to retain only ‘rough grassland’ or ‘heath’ habitat classifications, as these were the only two habitat types likely to reflect underlying peat. Next, as the peatlands of interest occur at high altitudes, any remaining land below 250 m above sea level was removed. Once these landscape-scale WTD estimates had been produced, the equation from the regression of cranefly abundance on summer WTD was used to convert WTD to 10-m spatial resolution estimates of cranefly abundance across the three landscapes (Supplementary Data 3).
Producing climate change projections
.
To examine climate change impacts, MILLENNIA was driven by gridded weather observations30from 1914 to 2010, then UKCP09 weather generator projections32for the twenty-first century.The weather generator produces stochastic sequences of weather data based on 30-year climatic means on a 55-km scale32. For each focal landscape, the weather generator was run for each available 30-year climate period (2010–2039, 2020–2049, 2030–2059, 2040–2069, 2050–2079, 2060–2089 and 2070–2099) under an intermediate climate change scenario (SRES emissions scenario A1B). Daily outputs were aggregated to total monthly precipitation and mean monthly temperature. One hundred random realizations were produced from each run, so data within each 30-year period were sorted in order of mean summer rainfall, and the 50th driest run was selected to approximately represent the median. As 30-year periods overlapped but the model required a continuous sequence of climate input data, the middle 10 years from each were combined into one sequence of 70 years. Modelled summer WTD for all years was converted to landscape-scale cranefly abundance estimates, as described above. To examine change over time, cranefly abundances were averaged across all 10 m cells (to account for local heterogeneity in emergence densities), thus providing a landscape-wide estimate of mean abundance for each year. As future projections were based on stochastic realizations, estimates for specific years were not of interest, making the climatic periods from which they were drawn the relevant periods in which to examine changes. Annual values were therefore aggregated to decadal means
(Supplementary Data 4), and mean abundance was regressed against decade. To examine abundance changes spatially, individual decades would provide too many comparisons to allow meaningful interpretation, so projections were converted to 30-year means for 1961–1990 and 2051–2080, to represent a baseline and late twenty-first century period, respectively (note that as WTDs in summer of yeart
predicted abundances in yeartþ1, abundance estimates refer to 1962–1991 and 2052–2081, respectively; Supplementary Data 3).
Examining relationships with birds
.
To examine relationships between craneflies and breeding birds, data on observed bird abundances were acquired from two large-scale surveys of upland breeding birds in the South Pennines. The first survey, from 1990, was carried out by English Nature18(now Natural England), and thesecond survey, from 2004, was conducted by Moors for the Future19. The 2004 survey was designed to repeat the 1990 survey to provide updated information on breeding bird distributions and abundances19. Data were collected for 11-km
grid squares, with survey routes designed to cover a large amount of each square19.
Two visits were made to each square during the survey period, the first between early April and mid May, and the second between mid May and late June19. Final
counts represented the maximum number of individuals of each species observed across the two visits. For the current analysis, grid squares were restricted to those surveyed in both years, leaving 557 squares available for analysis (Fig. 1; Fig. 5).
Landscape-scale estimates of cranefly abundance were produced for all 557 grid squares by following the modelling procedure as described above. The model was again run for all combinations of slope, aspect and elevation present in the landscape, but here topographic variables were rounded into intervals of 50 m for elevation, 15°for aspect, 2°for slopesr20°and 5°for slopes420°; these are larger intervals than used for the previous climate change analyses (where three 55-km grid squares were used), but as the scale of this analysis was so much greater, finer spatial resolution was less important and reducing model run time was relatively more important. The model was again driven by UK Met Office gridded weather observation data30. As these data corresponded to observed conditions in specific years, summer WTD estimates were extracted for 1988, 1989, 2002 and 2003 for each grid square (Supplementary Data 5). These years were chosen because abundance of adult craneflies emerging in spring of yeartis influenced by summer conditions in yeart1 (refs 5,24). However, bird abundance in yeart(which reflects breeding success in the previous year) is likely to be influenced by cranefly abundance in yeart1, which would therefore be driven by summer conditions in yeart2 (refs 5,24). Hence, summer conditions in 1988, 1989, 2002 and 2003 would influence emerging adult cranefly abundance in 1989, 1990, 2003 and 2004, respectively, which in turn could influence bird populations in 1990 and 2004.
Once cranefly abundance estimates had been produced, estimates were extracted for each 11-km bird survey square (averaging all 10-m grid cells within each 1-km survey square), and used as the predictor variable in models of breeding bird abundance. Three montane peatland breeding bird species, dunlin (Calidris alpina), golden plover (Pluvialis apricaria) and red grouse (Lagopus lagopus scoticus) were selected for this analysis given the importance of craneflies to them during the breeding season19. Abundances of all three focal species differed
significantly from a Poisson distribution, with overdispersion appearing common, hence all species were modelled with a negative binomial error and log link function using the ‘MASS’ R package52. Spearman correlations between the 2 years were only moderate (golden plover,r¼0.579; dunlin,r¼0.405; red grouse,
r¼0.512), so it was determined to be acceptable to analyse the 2 years separately. Relationships with modelled cranefly abundance were assessed by examining the significance of parameter estimates and the proportion of deviance explained; % deviance explained was calculated as (null devianceresidual deviance)/null deviance. In all cases, cranefly abundance from yeart1 (that is, driven by summer WTD in yeart2) described more deviance (Supplementary Table 1) so these estimates were used for further analyses; this was also the most biologically plausible model (see above).
To ensure that results were not an artefact caused by spatial autocorrelation, models were rerun in a generalized additive model (GAM) framework, fitted using the ‘mgcv’ R package56. GAMs included a two-dimensional tensor product smooth term that used a thin-plate regression spline basis57, which was fitted toxandy
coordinates to account for underlying spatial structure in the data. Results were similar to those from GLMs, with parameter estimates of a similar magnitude and all significant relationships remaining significant (Supplementary Table 3). Therefore, confidence was increased that results were not caused only by spatial structure in the data; accordingly, GAM results are discussed no further.
To examine relationships between modelled cranefly abundance and bird population persistence, 1-km survey squares were split into four categories based on observed abundance of each bird species (Supplementary Data 5). ‘Empty’ squares had no birds in either 1990 or 2004; ‘colonised’ squares had no birds in 1990, but at least one in 2004; ‘extinct’ squares had at least one bird in 1990, but none in 2004; and ‘occupied’ squares had birds in both years. Average cranefly abundance was calculated across the two survey years (that is, 1989 and 2003 abundance, which influenced 1990 and 2004 bird abundance, respectively); Kruskal–Wallis tests were then used to test differences in average cranefly abundance among the square categories, with pairwise differences examined using
post hocWilcoxon rank-sum tests.
estimates of cranefly abundance had been produced, these were entered into the fitted GLM as new predictor values to approximate possible future bird abundances (Supplementary Data 6).
Code availability
.
MILLENNIA model code as used in this study are stored on a secure server of the Stockholm Environment Institute; please contact Andreas Heinemeyer, at [email protected], for access.References
1. Thomas, C. D.et al.Extinction risk from climate change.Nature427,145–148 (2004).
2. Ockendon, N.et al.Mechanisms underpinning climatic impacts on natural populations: altered species interactions are more important than direct effects.
Glob. Chang. Biol.20,2221–2229 (2014).
3. Jetz, W., Wilcove, D. S. & Dobson, A. P. Projected impacts of climate and land-use change on the global diversity of birds.PLoS Biol.5,e157 (2007). 4. Carroll, M. J., Dennis, P., Pearce-Higgins, J. W. & Thomas, C. D. Maintaining
northern peatland ecosystems in a changing climate: effects of soil moisture, drainage and drain blocking on craneflies.Glob. Chang. Biol.17,2991–3001 (2011).
5. Pearce-Higgins, J. W., Dennis, P., Whittingham, M. J. & Yalden, D. W. Impacts of climate on prey abundance account for fluctuations in a population of a northern wader at the southern edge of its range.Glob. Chang. Biol.16,12–23 (2010).
6. Virkkala, R., Heikkinen, R. K., Lehikoinen, A. & Valkama, J. Matching trends between recent distributional changes of northern-boreal birds and species-climate model predictions.Biol. Conserv.172,124–127 (2014).
7. Chen, I.-C., Hill, J. K., Ohlemu¨ller, R., Roy, D. B. & Thomas, C. D. Rapid range shifts of species associated with high levels of climate warming.Science333,
1024–1026 (2011).
8. Gutie´rrez Illa´n, J.et al.Precipitation and winter temperature predict long-term range-scale abundance changes in Western North American birds.Glob. Chang. Biol.20,3351–3364 (2014).
9. Debinski, D. M., Caruthers, J. C., Cook, D., Crowley, J. & Wickham, H. Gradient-based habitat affinities predict species vulnerability to drought.
Ecology94,1036–1045 (2013).
10. Seneviratne, S. I.et al.Investigating soil moisture-climate interactions in a changing climate: a review.Earth-Science Rev.99,125–161 (2010).
11. Rydin, H. & Jeglum, J. K.The Biology of Peatlands(Oxford Univ. Press, 2006). 12. Gorham, E. The development of peat lands.Q. Rev. Biol.32,145–166 (1957). 13. Evans, M. G., Burt, T. P., Holden, J. & Adamson, J. K. Runoff generation and water table fluctuations in blanket peat: evidence from UK data spanning the dry summer of 1995.J. Hydrol.221,141–160 (1999).
14. Sottocornola, M. & Kiely, G. An Atlantic blanket bog is a modest CO2 sink.
Geophys. Res. Lett.32,L23804 (2005).
15. Billett, M. F.et al.Carbon balance of UK peatlands: current state of knowledge and future research challenges.Climate Res.45,13–29 (2010).
16. Ratcliffe, D. A. & Thompson, D. B. A. inEcological Change in the Uplands(eds Usher, M. B. & Thompson, D. B. A.) (Blackwell Scientific, 1988).
17. Coulson, J. C. inEcological Change in the Uplands(eds Usher, M. B. & Thompson, D. B. A.) (Blackwell Scientific, 1988).
18. Thompson, D. B. A., MacDonald, A. J., Marsden, J. H. & Galbraith, C. A. Upland heather moorland in Great Britain: a review of international importance, vegetation change and some objectives for nature conservation.
Biol. Conserv.71,163–178 (1995).
19. Pearce-Higgins, J. W. Using diet to assess the sensitivity of northern and upland birds to climate change.Climate Res.45,119–130 (2010).
20. Buchanan, G. M., Grant, M. C., Sanderson, R. A. & Pearce-Higgins, J. W. The contribution of invertebrate taxa to moorland bird diets and the potential implications of land-use management.Ibis148,615–628 (2006).
21. Park, K. J.et al.The role of invertebrates in the diet, growth and survival of Red Grouse (Lagopus lagopus scoticus) chicks.J. Zool.254,137–145 (2001). 22. Pearce-Higgins, J. W. & Yalden, D. W. Habitat selection, diet, arthropod
availability and growth of a moorland wader: the ecology of European Golden PloverPluvialis apricariachicks.Ibis146,335–346 (2004).
23. Douglas, D. J. T. & Pearce-Higgins, J. W. Relative importance of prey abundance and habitat structure as drivers of shorebird breeding success and abundance.Anim. Conserv.17,535–543 (2014).
24. Coulson, J. C. The biology ofTipula subnodicornisZetterstedt, with comparative observations onTipula paludosaMeigen.J. Anim. Ecol.31,1–21 (1962).
25. Heinemeyer, A.et al.The MILLENNIA peat cohort model: predicting past, present and future soil carbon budgets and fluxes under changing climates in peatlands.Climate Res.45,207–226 (2010).
26. Wilson, L.et al.Recovery of water tables in Welsh blanket bog after drain blocking: discharge rates, time scales and the influence of local conditions.
J. Hydrol.391,377–386 (2010).
27. Holden, J., Wallage, Z. E., Lane, S. N. & McDonald, A. T. Water table dynamics in undisturbed, drained and restored blanket peat.J. Hydrol.402,103–114 (2011).
28. Holden, J., Chapman, P. J. & Labadz, J. C. Artificial drainage of peatlands: hydrological and hydrochemical process and wetland restoration.Prog. Phys. Geog.28,95–123 (2004).
29. Weiss, R.et al.Simulation of water table level and peat temperatures in boreal peatlands.Ecol. Model.192,441–456 (2006).
30. Perry, M. & Hollis, D. The generation of monthly gridded datasets for a range of climatic variables over the UK.Int. J. Climatol.25,1041–1054 (2005). 31. Holden, J. & Burt, T. P. Runoff production in blanket peat covered catchments.
Water Resour. Res.39,1191 (2003).
32. Jones, P. D., Kilsby, C. G., Harpham, C., Glenis, V. & Burton, A.UK Climate Projections science report: Projections of future daily climate for the UK from the Weather Generator(University of Newcastle, 2009).
33. Brown, A. & Shepherd, K.Breeding Birds of the South Pennine Moors. Report No. 7 (Joint Nature Conservation Committee, 1991).
34. Carr, G. & Middleton, P.Breeding bird survey of the Peak District moorlands. Report No. 1 (Moors for the Future Partnership, Derbyshire, UK, 2004). 35. Hagemeijer, W. J. M. & Blair, M. J.The EBCC Atlas Of European Breeding
Birds: their Distribution and Abundance(T. & A. D. Poyser, 1997). 36. Tharme, A. P., Green, R. E., Baines, D., Bainbridge, I. P. & O’Brien, M. The
effect of management for red grouse shooting on the population density of breeding birds on heather-dominated moorland.J. Appl. Ecol.38,439–457 (2001).
37. Pearce-Higgins, J. W. & Grant, M. C. Relationships between bird abundance and the composition and structure of moorland vegetation.Bird Study53,
112–125 (2006).
38. Amar, A.et al.Exploring the relationships between wader declines and current land-use in the British uplands.Bird Study58,13–26 (2011).
39. Pearce-Higgins, J. W. & Yalden, D. W. Golden PloverPluvialis apricaria
breeding success on a moor managed for shooting Red GrouseLagopus lagopus.
Bird Study50,170–177 (2003).
40. Yalden, D. W. & Pearce-Higgins, J. W. Density-dependence and winter weather as factors affecting the size of a population of Golden PloversPluvialis apricaria.Bird Study44,227–234 (1997).
41. Calladine, J., Garner, G., Wernham, C. & Thiel, A. The influence of survey frequency on population estimates of moorland breeding birds.Bird Study56,
381–388 (2009).
42. Pearce-Higgins, J. W., Yalden, D. W. & Whittingham, M. J. Warmer springs advance the breeding phenology of Golden PloversPluvialis apricariaand their prey (Tipulidae).Oecologia143,470–476 (2005).
43. Pearce-Higgins, J. W. & Yalden, D. W. Variation in the growth and survival of Golden PloverPluvialis apricariachicks.Ibis144,200–209 (2002).
44. Fletcher, K., Howarth, D., Kirby, A., Dunn, R. & Smith, A. Effect of climate change on breeding phenology, clutch size and chick survival of an upland bird.
Ibis155,456–463 (2013).
45. Cattadori, I. M., Haydon, D. T. & Hudson, P. J. Parasites and climate synchronize red grouse populations.Nature433,737–741 (2005). 46. Beale, C. M., Dodd, S. & Pearce-Higgins, J. W. Wader recruitment indices
suggest nesting success is temperature-dependent in DunlinCalidris alpina.Ibis
148,405–410 (2006).
47. Mustin, K., Sutherland, W. J. & Gill, J. A. The complexity of predicting climate-induced ecological impacts.Climate Res.35,165–175 (2007).
48. Clark, J. M.et al.Model inter-comparison between statistical and dynamic model assessments of the long-term stability of blanket peat in Great Britain (1940-2099).Climate Res.45,227–248 (2010).
49. ECN Data Centre. Available at http://data.ecn.ac.uk.
50. Milne, A., Laughlin, R. & Coggins, R. E. The 1955 and 1959 population crashes in the leatherjacket,Tipula paludosaMeigen, in Northumberland.J. Anim. Ecol.
34,529–544 (1965).
51. Meats, A. The relation between survival and water loss in larvae ofTipula oleraceaandTipula paludosa(Diptera) on exposure to unsaturated air.J. Insect Physiol.13,1119–1131 (1967).
52. Venables, W. N. & Ripley, B. D.Modern Applied Statistics with S,4th edn (Springer, 2002).
53. R Development Core Team.R: A Language and Environment for Statistical Computing(R Foundation for Statistical Computing, 2013).
54. Kellner, E. & Halldin, S. Water budget and surface-layer water storage in a
Sphagnumbog in central Sweden.Hydrol. Process.16,87–103 (2002). 55. Holden, J. Peatland hydrology and carbon release: why small-scale process
matters.Philos. Trans. A Math. Phys. Eng. Sci.363,2891–2913 (2005). 56. Wood, S. N. Fast stable restricted maximum likelihood and marginal likelihood
estimation of semiparametric generalized linear models.J. Roy. Stat. Soc. Series B73,3–36 (2011).
Acknowledgements
We thank owners and managers for access to field sites: Mike Walker and the RSPB for Lake Vyrnwy (mid Wales); Sara Barrett of Natural England, John Eardley, Chris Bush and the Knowsley Estate for Wood Moss (South Pennines); and Peter Wilkinson, Roy Brown, Paul Wilson, Murray Wilson and Rogan Wheelan for Bransdale Moor (North York Moors). Pippa Gillingham, Graeme Glover and Katrina Spinney assisted fieldwork. Field site support was also provided by UKPopNet, co-funded by NERC and English Nature (now Natural England). Lake Vyrnwy dipwell data were provided by the EU LIFE Active Blanket Bog in Wales project and the RSPB; the LIFE Active blanket bog in Wales Project was a partnership between EU LIFE-Nature, RSPB, Countryside Council for Wales (now Natural Resources Wales), the Environment Agency and the Forestry Commission Wales (now NRW). We thank Fiona Walker for her role in collecting and processing Lake Vyrnwy dipwell data. The Environmental Change Net-work provided access to ECN data (Environmental Change NetNet-work 2012. Available at http://data.ecn.ac.uk—data citation code: ‘ECN:AH2/12’). MILLENNIA was developed with funding from NERC, UKPopNet (NERC R8-H12-01) and Defra (BD5104); we thank Simon Croft for help with model development. We thank Natural England and Andy Brown for access to 1990 bird survey data. We thank Moors for the Future and Jon Walker for access to 2004 bird survey data; data are available for non-commercial purposes at http://www.moorsforthefuture.org.uk/data-requests. We thank Phil Ineson, Peter Mayhew, Murray Grant and Steven Ewing for constructive comments during development of this work. M.J.C. was funded by a NERC CASE PhD studentship with the RSPB (NE/G524236/1). P.D. contribution was supported by Aberystwyth and Bangor Universities, CIRRE Research and Enterprise Partnership, funded by the Welsh Government. Collection of water-table data from Oughtershaw Moss was funded via a NERC Fellowship to J.H. (NER/I/S/2001/00712). Thumbnail image by Andy Hay (rspb-images.com).
Author contributions
M.J.C., A.H., J.W.P.-H., P.D. and C.D.T. designed research; M.J.C., A.H. and C.W. carried out hydrological modelling; M.J.C. and A.H. analysed hydrological modelling data; M.J.C. carried out cranefly and bird modelling; J.H. and Z.E.W. designed and carried out hydrological monitoring in northern England; all authors interpreted results; M.J.C., A.H., J.W.P.-H., P.D. and C.D.T. drafted the manuscript; and all authors commented on the manuscript.
Additional information
Supplementary Informationaccompanies this paper at http://www.nature.com/ naturecommunications
Competing financial interests:The authors declare no competing financial interests.
Reprints and permissioninformation is available online at http://npg.nature.com/ reprintsandpermissions/
How to cite this article:Carroll, M. J.et al.Hydrologically driven ecosystem processes determine the distribution and persistence of ecosystem-specialist predators under cli-mate change.Nat. Commun.6:7851 doi: 10.1038/ncomms8851 (2015).