This is a repository copy of The MAGIC meteoric smoke particle sampler.
White Rose Research Online URL for this paper: http://eprints.whiterose.ac.uk/85142/
Version: Accepted Version
Article:
Hedin, J, Giovane, F, Waldemarsson, T et al. (13 more authors) (2014) The MAGIC meteoric smoke particle sampler. Journal of Atmospheric and Solar-Terrestrial Physics, 118 (Part B). 127 - 144. ISSN 1364-6826
https://doi.org/10.1016/j.jastp.2014.03.003
© 2015, Elsevier. Licensed under the Creative Commons Attribution-NonCommercial-NoDerivatives 4.0 International http://creativecommons.org/licenses/by-nc-nd/4.0/
[email protected] https://eprints.whiterose.ac.uk/ Reuse
Unless indicated otherwise, fulltext items are protected by copyright with all rights reserved. The copyright exception in section 29 of the Copyright, Designs and Patents Act 1988 allows the making of a single copy solely for the purpose of non-commercial research or private study within the limits of fair dealing. The publisher or other rights-holder may allow further reproduction and re-use of this version - refer to the White Rose Research Online record for this item. Where records identify the publisher as the copyright holder, users can verify any specific terms of use on the publisher’s website.
Takedown
If you consider content in White Rose Research Online to be in breach of UK law, please notify us by
1 2 3 4 5 6 7 8 9 10 11 12 13 14 15 16 17 18 19 20 21 22 23 24 25 26 27 28 29 30 31 32 33 34 35 36 37 38 39 40 41 42 43 44 45 46 47 48 49 50 51 52 53 54 55 56 57 58 59 60
1
2
The MAGIC meteoric smoke particle sampler
34
Jonas Hedina*, Frank Giovaneb,c, Tomas Waldemarssona,b, Jörg Gumbela, Jürgen 5
Blumd, Rhonda M. Stroude, Layne Marlinb, John Moserb, David E. Siskindb, Kjell 6
Janssonf, Russell W. Saundersg, Michael E. Summersh, Philipp Reissausi, Jacek 7
Stegmana, John M. C. Planeg, Mihály Horányij. 8
9
a Department of Meteorology, Stockholm University (MISU), 10691 Stockholm, Sweden.
10
b Space Science Division, Naval Research Laboratory (NRL), Washington D.C., USA.
11
c Virginia Polytechnic Institute, Physics Department, Blacksburg, VA, USA.
12
d Technical University Braunschweig, Braunschweig, Germany.
13
e Materials Science and Technology Division, Naval Research Laboratory, Washington
14
D.C., USA.
15
f Department of Materials and Environmental Chemistry, Stockholm University,
16
Stockholm, Sweden.
17
g School of Chemistry, University of Leeds, Leeds, U.K.
18
h Georg Mason University, Fairfax, VA, USA.
19
i Space Technologies & Applications Division, Kayser-Threde GmbH München, 81379
20
München, Germany.
21
j University of Colorado, Boulder, CO, USA.
22 23 24 25
Corresponding author: 26
Jonas Hedin, [email protected], tel: +46-8-164232, fax: +46-8-157185 27
Department of Meteorology, Stockholm University, 10691 Stockholm, Sweden 28
29 30 31
Manuscript for submission to the special issue 32
Smoke and Ice in the Mesosphere
33
in Journal of Atmospheric and Solar-Terrestrial Physics
34
November 2013 35
36 37 *Revised manuscript
1 2 3 4 5 6 7 8 9 10 11 12 13 14 15 16 17 18 19 20 21 22 23 24 25 26 27 28 29 30 31 32 33 34 35 36 37 38 39 40 41 42 43 44 45 46 47 48 49 50 51 52 53 54 55 56 57 58 59 60
Abstract
38
Between a few tons to several hundred tons of meteoric material enters the 39
Earth s atmosphere each day, and most of this material is ablated and vaporized 40
in the 70 to 120 km altitude region. The subsequent chemical conversion, re-41
condensation and coagulation of this evaporated material are thought to form 42
nanometre sized meteoric smoke particles (MSPs). These smoke particles are 43
then subject to further coagulation, sedimentation and global transport by the 44
mesospheric circulation. MSPs have been proposed as a key player in the 45
formation and evolution of ice particle layers around the mesopause region, i.e. 46
noctilucent clouds (NLC) and polar mesosphere summer echoes (PMSE). MSPs 47
have also been implicated in mesospheric heterogeneous chemistry to influence 48
the mesospheric odd oxygen/odd hydrogen (Ox/HOx) chemistry, to play an 49
important role in the mesospheric charge balance, and to be a significant 50
component of stratospheric aerosol and enhance the depletion of O3. 51
Despite their apparent importance, little is known about the properties of MSPs 52
and none of the hypotheses can be verified without direct evidence of the 53
existence, altitude and size distribution, shape and elemental composition. The 54
aim of the MAGIC project (Mesospheric Aerosol Genesis, Interaction and 55
Composition) was to develop an instrument and analysis techniques to sample 56
for the first time MSPs in the mesosphere and return them to the ground for 57
detailed analysis in the laboratory. MAGIC meteoric smoke particle samplers 58
have been flown on several sounding rocket payloads between 2005 and 2011. 59
Several of these flights concerned non-summer mesosphere conditions when 60
pure MSP populations can be expected. Other flights concerned high latitude 61
summer conditions when MSPs are expected to be contained in ice particles in 62
the upper mesosphere. In this paper we present the MAGIC project and describe 63
the MAGIC MSP sampler, the measurement procedure and laboratory analysis. 64
We also present the attempts to retrieve MSPs from these flights, the challenges 65
inherent to the sampling of nanometre sized particles and the subsequent 66
analysis of the sampled material, and thoughts for the future. Despite substantial 67
experimental efforts, the MAGIC project has so far failed to provide conclusive 68
results. While particles with elemental composition similar to what is to be 69
1 2 3 4 5 6 7 8 9 10 11 12 13 14 15 16 17 18 19 20 21 22 23 24 25 26 27 28 29 30 31 32 33 34 35 36 37 38 39 40 41 42 43 44 45 46 47 48 49 50 51 52 53 54 55 56 57 58 59 60
challenges with different types of contamination and uncertainties in the sticking 71
efficiency of the particles on the sampling surfaces. 72
1 2 3 4 5 6 7 8 9 10 11 12 13 14 15 16 17 18 19 20 21 22 23 24 25 26 27 28 29 30 31 32 33 34 35 36 37 38 39 40 41 42 43 44 45 46 47 48 49 50 51 52 53 54 55 56 57 58 59 60
1. Introduction
74
The Earth´s atmosphere is constantly bombarded by meteoric material. The total 75
amount of this incoming material is a subject of controversy (Plane, 2012) with 76
estimates ranging from a few tons to several hundred tons per day (Hughes, 77
1978; Love and Brownlee, 1993; Ceplecha et al., 1998; Cziczo et al., 2001; 78
Mathews et al., 2001; Gabrielli et al., 2004; Plane, 2004; von Zahn, 2005). Most of 79
this material is expected to vaporise in the altitude region 70 120 km during 80
atmospheric entry (e.g. Ceplecha et al., 1998; Vondrak et al., 2008). It is well 81
known that this ablation is the source of the global layers of metal atoms and 82
ions that are observed by ground-based (e.g. Chamberlain et al., 1958; Bowman 83
et al., 1969; Kane and Gardner, 1993; Alpers et al., 1996; Eska et al., 1998; Plane, 84
2003) and satellite- and rocket-borne (e.g. Donahue and Meier, 1967; Donahue et 85
al., 1972; Newman, 1988; Kopp, 1997; Aikin et al., 2004; Fussen et al., 2010; 86
Hedin and Gumbel, 2011) instruments in the mesosphere and lower 87
thermosphere (MLT) region. Chemical conversion and subsequent re-88
condensation and coagulation of the vaporised material is thought to give rise to 89
tiny nanometre size meteoric smoke particles, MSPs, which are then subject to 90
further coagulation, sedimentation and global transport by the mesospheric 91
meridional circulation (e.g. Rosinski and Snow, 1961; Hunten et al., 1980; 92
Kalashnikova et al. 2000; Gabrielli et al., 2004; Megner et al., 2006; 2008a; 93
2008b). The general circulation of the atmosphere transports the MSPs away 94
from the summer pole towards the winter pole and into the polar winter vortex 95
(Megner, 2007; Bardeen et al., 2008; Megner et al., 2008a; 2008b), thus 96
producing a strong annual variation. The general composition of the meteoric 97
smoke material is thought to reflect the composition of the incoming meteorite 98
material. However, due to differential ablation processes and the altitude-99
dependent chemical environment, the detailed smoke composition is expected to 100
depend on the history of the individual meteoric particles (e.g. McNeil et al., 101
1998; Kalashnikova et al., 2000). Considering the meteoric influx, major vapour 102
components are presumably silicon, iron and magnesium, with minor 103
contributions from other metals like sodium, aluminium, potassium, calcium, 104
lithium etc. Following gas phase chemical transformation prior to re-105
1 2 3 4 5 6 7 8 9 10 11 12 13 14 15 16 17 18 19 20 21 22 23 24 25 26 27 28 29 30 31 32 33 34 35 36 37 38 39 40 41 42 43 44 45 46 47 48 49 50 51 52 53 54 55 56 57 58 59 60
hydroxides and carbonates in the resulting smoke particles (e.g. Plane, 2003; Self 107
and Plane, 2003; Plane and Whalley, 2012). 108
Basic information about MSP properties is today available from optical 109
occultation measurements (Hervig et al., 2009, 2012) and, more indirectly, as a 110
fraction of the particles is expected to be charged by the surrounding plasma, 111
from measurements of heavy charge carriers from sounding rockets (Schulte and 112
Arnold, 1992; Havnes et al., 1996; Gelinas et al., 1998; Horányi et al., 2000; 113
Croskey et al., 2001; Robertson et al., 2004, 2009, 2013; Lynch et al., 2005; 114
Barjatya and Swenson, 2006; Smiley et al., 2006; Havnes and Næsheim, 2007; 115
Amyx et al., 2008; Strelnikova et al., 2009; Rapp et al., 2005, 2010, 2012; Havnes 116
et al., 2013), and from incoherent scatter radars (Rapp et al., 2007; Strelnikova et 117
al., 2007; Fentzke et al., 2009). Experimental studies have been performed in the 118
laboratory (Saunders and Plane, 2006; 2011), but much of the existing 119
knowledge about MSPs relies on model results (e.g. Hunten et al., 1980; Megner 120
et al., 2006, 2008a, 2008b; Bardeen et al., 2008). It has been shown that 121
substantial amounts of particles of meteoric origin are present in the 122
stratosphere (e.g. Murphy et al., 1998; Cziczo et al., 2001) and that meteoric 123
smoke particles reach the Earth´s surface (e.g. Gabrielli et al., 2004; Lanci and 124
Kent, 2006; Dhomse et al., 2013), but no equivalent measurements of particles 125
have ever been achieved in the mesosphere. Attempts were made in the 1960s to 126
sample mesospheric aerosol from sounding rockets (e.g. Hemenway et al., 1964; 127
Soberman and Hemenway, 1965; Farlow et al, 1970), but none of the 128
measurements resulted in any conclusive results. Very recently, a student 129
experiment attempted to sample particles from a sounding rocket launched 130
within the REXUS/BEXUS (Rocket/Balloon Experiment for University Students) 131
programme, a bi-lateral cooperation between the Swedish National Space Board 132
(SNSB) and the German Aerospace Center (DLR), but results from the analysis is 133
not yet available (see Reid et al. (2013) for details about the experiment). 134
Although there is only indirect evidence of their existence in the mesosphere, 135
MSPs have been proposed as a key player in the formation and evolution of 136
several observed mesospheric phenomena. Smoke particles are today recognised 137
as the most likely candidate for condensation nuclei for mesospheric ice particles 138
1 2 3 4 5 6 7 8 9 10 11 12 13 14 15 16 17 18 19 20 21 22 23 24 25 26 27 28 29 30 31 32 33 34 35 36 37 38 39 40 41 42 43 44 45 46 47 48 49 50 51 52 53 54 55 56 57 58 59 60
(Gadsden and Schröder, 1989; Thomas, 1991), or polar mesospheric clouds, 140
PMC, and polar mesosphere summer echoes, PMSE (Rapp and Lübken, 2004). 141
These water ice particles (Hervig et al., 2001) are probably not pure ice with just 142
one MSP as nuclei, but more likely dirty ice particles with a large amount of 143
MSPs embedded in them along with metal atoms and molecules from meteoric 144
ablation (Havnes and Næsheim, 2007; Hervig et al., 2012; Kassa et al., 2012; 145
Havnes et al., 2013). Smoke particles are also believed to be responsible for the 146
polar mesosphere winter echoes (PMWE) observed by radars outside the PMSE 147
season (e.g. Zeller et al., 2006). With the advent of more powerful radars, these 148
winter echoes have now been observed also during summer below the much 149
stronger PMSE (Latteck et al., 2012). Heterogeneous chemistry has been 150
suggested to take place on the surfaces of smoke particles. An example is the 151
proposed catalytic recombination of O and H2 as a local source of water vapour 152
in the mesosphere to explain observations of mesospheric HOx chemistry and 153
unexpectedly high water concentrations (Summers and Siskind, 1999; Conway et 154
al., 2000). By scavenging various gas-phase products of meteoric ablation, MSPs 155
are thought to act as a sink in mesospheric metal chemistry (Plane, 2004). Smoke 156
particles can also efficiently scavenge free electrons and ions and can thus play a 157
substantial role in the D-region charge balance (Rapp and Lübken, 2001; Rapp, 158
2009; Friedrich et al., 2011). This charging may in turn strongly affect smoke 159
coagulation and ice particle nucleation processes (Gumbel and Megner, 2009; 160
Megner and Gumbel, 2009). The strong downward circulation in the winter polar 161
vortex can efficiently transport MSPs down into the winter stratosphere. Here, 162
MSPs can be involved in stratospheric chemistry and the microphysics of polar 163
stratospheric clouds (PSC) and thus have important effects on ozone chemistry 164
(e.g. Murad et al., 1981; Curtius et al., 2005; Voigt et al., 2005, Saunders et al., 165
2012). Very recently Dhomse et al. (2013) predicted high deposition of MSPs to 166
occur at middle latitudes, providing a significant source of Fe fertilization to the 167
Southern Ocean. 168
Despite their apparent importance, little is known about the properties of 169
meteoric smoke particles and none of the hypotheses above can be verified 170
without direct evidence of their existence, altitude and size distribution, and 171
1 2 3 4 5 6 7 8 9 10 11 12 13 14 15 16 17 18 19 20 21 22 23 24 25 26 27 28 29 30 31 32 33 34 35 36 37 38 39 40 41 42 43 44 45 46 47 48 49 50 51 52 53 54 55 56 57 58 59 60
Interaction and Composition) was to quantitatively answer fundamental 173
questions about the properties of MSPs in the mesosphere: 174
‚ Do re-condensed smoke particles of meteoric origin exist in the 175
mesosphere? 176
‚ What is their number density, shape and size distribution? 177
‚ What is their spatial distribution and how are they transported? 178
‚ What is their elemental and molecular composition? 179
‚ How do they interact with their mesospheric and ionospheric 180
environment? 181
182
To address these questions, an instrument was designed and built to directly 183
sample meteoric smoke particles in the mesosphere and return them to the 184
ground for detailed laboratory investigations. In this paper we describe the 185
MAGIC meteoric smoke particle sampler and present attempts to directly sample 186
MSPs. In section 2 the ideas behind the MAGIC project are presented and the 187
MAGIC sampler is described in detail. Section 3 then describes the measurement 188
campaigns and results are presented and discussed. Section 4 provides a 189
summary and conclusion with some thoughts for the future. 190
2. The MAGIC Idea
191
2.1 The challenge
192
In order to understand the role of meteoric smoke particles in the mesosphere 193
and their impact on that environment their presence must be certified and their 194
physical characterization (number density, size distribution, shape, composition 195
etc.) determined. The in situ detection of neutral nanometre-size particles is 196
however very difficult. They are too small for optical detection and their 197
momentum is not sufficient to produce electrical pulses upon impact. A way to 198
obtain maximum information about particle properties is by direct collection 199
followed by detailed laboratory analysis. However, the sounding rocket 200
approach, which is the only practical method to carry out a sampling experiment 201
at mesospheric altitudes, is subject to critical limitations imposed by 202
1 2 3 4 5 6 7 8 9 10 11 12 13 14 15 16 17 18 19 20 21 22 23 24 25 26 27 28 29 30 31 32 33 34 35 36 37 38 39 40 41 42 43 44 45 46 47 48 49 50 51 52 53 54 55 56 57 58 59 60
rocket payload structure rather than reaching the detector surface, their 204
sampling is a substantial experimental challenge and careful aerodynamic design 205
is of critical importance for smoke particle experiments. The interpretation of 206
the particle measurements also requires a detailed understanding of the specific 207
detector response, which is far from trivial. Basic questions are e.g. how 208
measured particle concentrations and properties are related to the particle 209
concentrations and properties in the undisturbed atmosphere. 210
Around the turn of the century, significant progress was made in the analysis of 211
aerodynamic influences on sounding rocket measurements (Gumbel et al., 1998; 212
Gumbel, 2001) and the fate of atmospheric particles approaching a rocket 213
detector (Horányi et al., 1999; 2000). Based on these results, the fundamental 214
concept of the MAGIC instrument design was to minimize the aerodynamic 215
perturbations by the use of a small sampling probe extending forward of the 216
rocket payload. By using a collection surface of 3 mm diameter, the sampling 217
probe dimension is reduced to the order of the molecular mean free path, which 218
minimizes flow effects on incident particle trajectories in the vicinity of the 219
probe. In order to characterize the sampling process, Hedin et al. (2007b) 220
performed simulations of the trajectories of nanometre-sized dust particles 221
towards the MAGIC detectors with a statistical particle motion model for the 222
conditions of the first rocket launch at Esrange in January 2005. An important 223
feature of this model is the Brownian motion of the particles due to thermal 224
collisions of the gas molecules (Hedin et al., 2007a). Figure 1 shows trajectories 225
of simulated particles of 0.4, 0.6 and 0.8 nm radii towards the MAGIC sampling 226
surface at an altitude of 80 km for the conditions of the Esrange 2005 flight (but 227
with a zero degree angle of attack). The flow is from the left and the grey scale is 228
the air number density normalized to the unperturbed free-stream conditions. It 229
can be seen here that even particles as small as 0.4 nm radius will impact on the 230
sampling surface at this altitude. As a result from this simulation, a detection 231
efficiency for the MAGIC detector as a function of altitude and particle size is 232
obtained (Fig. 2). These simulations confirm that particles of radii down to 0.75 233
nm impact on the sampling surface with an efficiency exceeding 80% over the 234
entire mesospheric altitude range of interest. 235
1 2 3 4 5 6 7 8 9 10 11 12 13 14 15 16 17 18 19 20 21 22 23 24 25 26 27 28 29 30 31 32 33 34 35 36 37 38 39 40 41 42 43 44 45 46 47 48 49 50 51 52 53 54 55 56 57 58 59 60
2.2 The MAGIC sampler
237
The MAGIC detector concept was developed in collaboration between the Naval 238
Research Laboratory (NRL) in Washington D.C. and German and Swedish 239
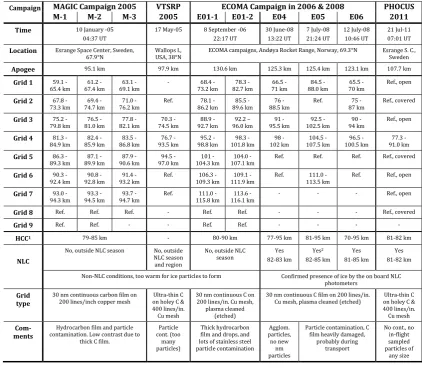
scientists (Gumbel et al., 2005) and four MAGIC collection instruments were built 240
at NRL. In collaboration with the Department of Meteorology at University of 241
Stockholm (MISU), the first flight of the MAGIC collectors took place on a rocket 242
launched at Esrange Space Center, Sweden, in January 2005 (the MAGIC 243
campaign). The second flight was in collaboration with the Virginia Polytechnic 244
Institute and took place in May 2005 with a launch at Wallops Island, USA. In 245
September 2006, August 2007 and June/July 2008 MAGIC collectors were 246
launched as part of the German-Norwegian ECOMA project at Andøya Rocket 247
Range, Norway. The last flight of a MAGIC collector was on the Swedish PHOCUS 248
campaign at Esrange, Sweden, in July 2011. 249
As the rocket payload transits the mesosphere, the MAGIC collector sequentially 250
extends a number of sampling probes at specific altitude windows. On the 251
exposed face of the probes, transmission electron microscopy (TEM) grids were 252
mounted to collect particles in a directly analysable form, thus minimizing the 253
risk of particle loss and contamination. Up to nine sampling pins (of which at 254
least one is used as reference, i.e. not exposed to the atmosphere) are mounted in 255
a revolver mechanism (Fig. 3). This pin-revolver mechanism is driven by a worm 256
gear, which allows sequential positioning of the pins with high precision under 257
the pin exit hole of the revolver-chamber. Once in position, a chain drive 258
mechanism is used to extend a piston, which pushes the collection pin upward 259
through the exit hole in the top of the MAGIC instrument (Figs. 4 and 5). Particles 260
that impact the TEM grid while extended outside of the MAGIC instrument are 261
expected to stick by van der Waals forces. After a few seconds the pin is retracted 262
back into its original position in the pin-revolver. A pair of permanent magnets 263
provides the necessary coupling of the extension piston to the sampling pin, so 264
that the sampling pin can be retracted into the revolver. The extension piston 265
detaches from the magnet when the collection pin is completely back in its 266
compartment in the revolver. The worm gear then drives the pin-revolving 267
1 2 3 4 5 6 7 8 9 10 11 12 13 14 15 16 17 18 19 20 21 22 23 24 25 26 27 28 29 30 31 32 33 34 35 36 37 38 39 40 41 42 43 44 45 46 47 48 49 50 51 52 53 54 55 56 57 58 59 60
altitude intervals in the mesosphere can be analysed when the TEM grids are 269
returned to Earth. 270
The pin exit hole is opened by removing a vacuum plug that is used to seal the 271
exit hole during launch. This plug mechanism is controlled by a rod, which is 272
extended through the pin-revolver mechanism s axis This rod is driven by a 273
lead-screw that lifts the plug out of the exit hole. The plug is then rotated with 274
the revolver mechanism, until it returns to its original position at the end of the 275
sampling sequence near the apogee of the flight. At this point the plug is 276
reinserted to vacuum seal the chamber thus preventing water or other 277
contaminants from entry into the MAGIC instrument on landing. 278
Nominally the MAGIC collection system is completely self-contained, i.e. it has it 279
own power supply (rechargeable batteries), microprocessor and requires no 280
telemetry. A signal is sent from the rocket service module at a pre-set time after 281
the launch to start the sampling sequence as programmed in the microprocessor. 282
For the purpose of real time monitoring of the MAGIC instrument during flight, 283
two signals have been transmitted by telemetry, (1) pressure inside instrument 284
and (2) status signal indicating when a collection pin is in the extended position. 285
Monitoring of these two signals during flight and subsequent instrument checks 286
are performed to confirm that the instrument functioned as expected. After the 287
ECOMA campaign in 2006, the electronics were remodelled and the internal 288
power supply was removed. From then on, the MAGIC samplers were powered 289
from the rocket service module. 290
2.3 Sampling surface
291
The appropriate choice of collection surface for nanometre-size particles is 292
crucial. With regard to the anticipated laboratory analysis, the use of carbon film 293
coated TEM grids as sampling surfaces has been the primary choice. An 294
important benefit of using TEM grids as sampling surfaces, is that additional post 295
flight treatment of collected particles, such as separating and moving the 296
nanometre size particles from the sampling surfaces is not required. 297
Two experimental investigations have been made to test the sticking efficiency of 298
the TEM grids for nanometre size particles (Reissaus et al., 2006). Using a 299
1 2 3 4 5 6 7 8 9 10 11 12 13 14 15 16 17 18 19 20 21 22 23 24 25 26 27 28 29 30 31 32 33 34 35 36 37 38 39 40 41 42 43 44 45 46 47 48 49 50 51 52 53 54 55 56 57 58 59 60
few nanometres were produced at speeds of 1 km/s. The laboratory impact 301
experiments demonstrated that nanoparticles, both as single particles and fractal 302
agglomerates, do stick on carbon surfaces after high velocity impacts with 303
moderate efficiency (14%) for Al2O3 and moderate to high efficiency (24 83%) 304
for C. The higher collection efficiency for C particles may be due to that they 305
chemically bind to the C on the TEM grids. Unfortunately, the relevance of these 306
numbers for the mesospheric MAGIC measurements remains unclear as the 307
overall sticking probabilities determined in the laboratory may be dominated by 308
large agglomerates of nanometre particles that were formed in the molecular 309
beam prior to impact on the grids. As an additional finding, the experiments 310
confirmed that at speeds of the order of 1 km/s the particles do not penetrate the 311
carbon film on the TEM grid. These experiments were made with a 0° angle of 312
attack, i.e. the particles impacted the surface with normal incidence. At angles of 313
attack of 10-20° or larger, which is typical for sounding rocket experiments 314
without attitude control, the sticking efficiency will be different (most likely 315
smaller). 316
Other probe materials have been considered during the development of the 317
measurement concept, most notably aerogel. While sticking probability in the 318
aerogel matrix is close to unity, the difficulty in removing nanometre particles 319
from the aerogel for electron microscopy analysis made the choice of this 320
material not feasible. On 16 November 2012, a student experiment was launched 321
on a sounding rocket from Esrange Space Center within the REXUS/BEXUS 322
program with the objective to collect particles in the mesosphere and 323
stratosphere. The sampling probes contained collection surfaces of three 324
different types: standard TEM grids, glass fibre filter paper, and silicone gel (Reid 325
et al., 2013). Results from the analysis of these surfaces are not yet available. 326
327
2.4 Measurement procedure
328
In the preferred payload configuration at least two MAGIC collectors are used 329
where the instruments alternate the sampling pin extension to ensure that there 330
are no gaps in the sampling procedure. Before flight the instruments are 331
carefully prepared in a clean room environment. By using specific mounting 332
1 2 3 4 5 6 7 8 9 10 11 12 13 14 15 16 17 18 19 20 21 22 23 24 25 26 27 28 29 30 31 32 33 34 35 36 37 38 39 40 41 42 43 44 45 46 47 48 49 50 51 52 53 54 55 56 57 58 59 60
not in direct contact with any other surface. On every flight, each MAGIC 334
instrument had (at least) one collection pin with a TEM grid that was only to be 335
used as a reference surface and that was therefore never extended during the 336
collection sequence. This unexposed reference TEM grid is attached and 337
removed together with the ordinary TEM grids used in the collection sequence. 338
Any contamination from the instrument itself or from TEM grid mounting and 339
removal procedures will thus be detected on this reference grid. Once the 340
sampling procedure during flight is completed the MAGIC unit closes the vacuum 341
seal and is kept under the low vacuum acquired during the time of the sampling 342
operation in the mesosphere. After the recovery of the payload, the MAGIC 343
instruments are kept under vacuum until the first examination of the TEM grids. 344
To avoid the use of additional transfer or storage containers before the first 345
examination of the reference and collection surfaces, the TEM grids can be 346
removed adjacent to the transmission electron microscope. In this way, once a 347
grid is removed from the MAGIC instrument, it can be mounted immediately in 348
the transmission electron microscope. 349
It is important to note that the small collector dimensions are a decisive 350
difference between the current approach and efforts to sample NLC particles in 351
the 1960s [e.g., Hemmenway et al., 1964a; Farlow et al., 1970]. The aerodynamic 352
conditions for these large earlier collectors a priori prevented a detection of 353
particles in the nanometre size range. In addition, the smallness of the MAGIC 354
collection system concept is a precondition for efficiently keeping sampling 355
surfaces clean and under vacuum. 356
357
2.5 Data analysis
358
The analysis of the MAGIC smoke samples after recovery is primarily based on 359
detailed transmission electron microscopy (TEM) studies mainly at the Materials 360
Science and Technology Division of NRL and, since 2008, at the Electron 361
Microscopy Centre (EMC) in the Department of Materials and Environmental 362
Chemistry at Stockholm University. The TEM analysis is intended to provide 363
particle numbers, sizes and shapes, while the combination of the TEM technique 364
with energy-filtered imaging and energy-dispersive x-ray spectroscopy (EDS or 365
1 2 3 4 5 6 7 8 9 10 11 12 13 14 15 16 17 18 19 20 21 22 23 24 25 26 27 28 29 30 31 32 33 34 35 36 37 38 39 40 41 42 43 44 45 46 47 48 49 50 51 52 53 54 55 56 57 58 59 60
and compositional analysis studies were performed using a JEOL JEM-2200FS 367
200-kV (NRL) and a JEOL JEM-2100F 200-kV (EMC) field emission scanning TEM 368
(STEM), with an EDX system and high-angle annular dark-field (HAADF) imaging 369
capability. The grids were imaged in conventional bright-field and HAADF modes 370
to determine particle sizes, shapes and number density. 371
Energy filtered images can be obtained by selecting only the transmitted 372
electrons that interact inelastically with the sample and thus exhibit an energy 373
loss characteristic of the elements present in the sample. The energy-filter 374
window can be tuned to a specific elemental edge so that the image intensity 375
directly reflects the concentration of the chosen element. Advantages with this 376
technique are that it is sensitive to light elements including C, N and O, and that it 377
is relatively fast. EDX can then determine the quantitative elemental and 378
molecular composition. EDX analysis utilizes the characteristic x-ray 379
fluorescence emission from the sample due to absorption of energetic electrons 380
to accurately determine the sample composition. Elements as light as boron can 381
be detected while quantitative results are obtained for carbon and heavier 382
elements. These measurements are more time intensive than energy-filtered 383
imaging, but can be used to determine the composition of the particle to less than 384
0.01 atom %, if appropriate calibration standards are used. 385
3. Results and discussion
386
3.1 First flights
387
There were two flights of MAGIC instruments in 2005. The first took place in the 388
MAGIC sounding rocket campaign at 04:37 UT (05:37 LT) on January 10 from 389
Esrange Space Center, Sweden (68°N, 21°E). On this flight three MAGIC collection 390
instruments were flown along with the Hygrosonde water vapour instrument 391
(Khaplanov et al., 1996; Lossow et al., 2008) and two charged aerosol detectors 392
(Gumbel et al., 2005; Amyx et al., 2008). As can be seen in Fig 4, the three MAGIC 393
instruments were mounted symmetrically around the centrally located 394
Hygrosonde. Continuous 30 nm carbon film coated Cu TEM grids (Fig. 5a) were 395
exposed between 59 km and the apogee of 95 km. The second flight took place 396
1 2 3 4 5 6 7 8 9 10 11 12 13 14 15 16 17 18 19 20 21 22 23 24 25 26 27 28 29 30 31 32 33 34 35 36 37 38 39 40 41 42 43 44 45 46 47 48 49 50 51 52 53 54 55 56 57 58 59 60
Tech Student Sounding Rocket Project (VTSRP). One MAGIC collector was flown 398
on this flight (Fig. 6), which reached an apogee of 98 km. Three pins with ultra 399
thin 3 nm continuous carbon film on a holey carbon film (or carbon mesh) coated 400
Cu TEM grids (Fig. 5b) were exposed between 70 and 97 km (in Fig 5b, the holey 401
carbon film or carbon mesh is the dark grey net supporting the light grey ultra 402
thin continuous carbon film). 403
Technical issues associated with the collection TEM grids hampered initial 404
results from the Esrange grids. The 30 nm thick continuous carbon film resulted 405
in low contrast between the film and the collected particles. Hydrocarbon build 406
up during TEM analysis reduced the contrast even further, which consequently 407
made the analysis more difficult. In spite of this, HAADF images show particles in 408
the 1-10 nm radius size range. Figure 7 shows particles found on the Esrange 409
grids. Panels a) to d) in Fig. 7 are images of the grids exposed at altitudes 410
between 86.3 and 94.5 km, where panel a) shows a high-resolution bright-field 411
image and the other three are HAADF images. Panels a) and b) are images of the 412
same region. EDX spectra show weak signal from Si. The square patterns with 413
reduced contrast in panels c) and d) show the effect of the thin film of 414
hydrocarbons present on the grid. The reference grids do not show any of these 415
nanometre-sized particles, but their origin is not known. Larger particles were 416
seen on both exposed (panels e) and g), exposed at 90.3-94.3 and 93.3-94.5 km, 417
respectively) and reference grids (panels f) and h)) and are likely contamination. 418
The large particles shown in panels e) and f) contain Ti, Si, Na, K, Ca and Al, while 419
the particles in panel g) and h) contain Fe, Si, Al, Ca and Cr. The two on board 420
Colorado dust detectors (CDDs) indicated particles in the altitude range 79 to 85 421
km (Amyx et al., 2008) which was covered by pins three and four of each of the 422
three MAGIC samplers, as can be seen in Fig. 8. 423
For the Wallops flight a switch was made to a new type of TEM grid with a 424
carbon film thickness of only ~3 nm, about ten times thinner than the Esrange 425
grids. These new TEM grids gave a much-improved contrast, but came with the 426
disadvantage of the presence of some silica left from the manufacturing process. 427
All of the TEM grids from 2005 reveal nanometre particles, however, the imaging 428
contrast is best on the 3 nm thick regions of the Wallops flight grids shown in 429
1 2 3 4 5 6 7 8 9 10 11 12 13 14 15 16 17 18 19 20 21 22 23 24 25 26 27 28 29 30 31 32 33 34 35 36 37 38 39 40 41 42 43 44 45 46 47 48 49 50 51 52 53 54 55 56 57 58 59 60
were converted to colour using the colour gradient tool in Photoshop CS. This 431
transformation retains the intensity information of the raw images, in which 432
contrast is directly proportional to variation in sample thickness and depends 433
inversely on the square of the atomic number density of the sample. Based on the 434
1% area analysed, several distinct classes of particles types could be identified. 435
The most common morphologies are clusters, 10 nm to several microns across, 436
comprised of aggregated particles of 0.5-2 nm in radius (Fig. 9), which in the EDX 437
spectra appear to be primarily Si and O. The HAADF images show a range of 10-438
50% coverage of the grid film with clusters, corresponding to approximately 104 -439
105particles m-2 in the 0.5-2 nm range, and an atmospheric abundance of 106 -440
107 cm-3, assuming 100% collection efficiency. The images indicate a sharp drop-441
off in abundance for particle >2 nm. However, due to the presence of silica left 442
from the manufacturing process, it is not possible to show that these particles 443
were collected during flight. 444
Other particle morphologies occur at orders of magnitude lower abundance (see 445
Fig. 10) than the 0.5-2 nm radius particles. These include isolated 2.5-5 nm 446
radius particles, holes produced by particles that breached the support film, 447
particle rings, 25-125 nm monolithic particles, and micrometre-sized particles 448
and aggregates. The isolated 2.5 - 5 nm particles are dense spheres with varying 449
concentrations of Si, O, Ca, Al, Fe, and S, consistent with material of meteoric 450
origin. The holes (vertical arrows, Fig. 10), presumably produced by particles 451
that breached the support film, are 25-75 nm in radius and are rimmed with 452
material; possibly peeled back carbon film. The particle rings (angled arrow in 453
Fig. 10, and Fig. 11) have a diffuse circular perimeter that is sometimes studded 454
with high-density aggregates. Monolithic particles ranging from 25-125 nm in 455
radius appear to be individual mineral grains, composed e.g. of silicates and 456
magnesium aluminium oxides, and faceted surfaces consistent with an origin as 457
matrix materials from incompletely ablated micrometeorites. There are also of 458
the order of 10 particles per collection grid in the micrometre size range. These 459
are most likely contamination, as the presence of particles of this size is common 460
in the terrestrial environment, even in the clean room environment of the 461
1 2 3 4 5 6 7 8 9 10 11 12 13 14 15 16 17 18 19 20 21 22 23 24 25 26 27 28 29 30 31 32 33 34 35 36 37 38 39 40 41 42 43 44 45 46 47 48 49 50 51 52 53 54 55 56 57 58 59 60
compositions and morphologies consistent with an origin as meteoroid 463
fragments or interplanetary dust particles (IDPs). 464
The unexpectedly diverse morphologies of the collected material present some 465
questions that have not yet been resolved. The different morphologic groups 466
must result from diverse origins and atmospheric processes. The fact that the 467
most abundant particles observed are in the 0.5-1.5 nm size range is generally 468
consistent with expectations (e.g. Hunten et al., 1980; Kalashnikova et al., 2000; 469
Bardeen et al., 2008; Megner et al., 2008b), i.e., an exponentially decreasing 470
particle abundance with increasing size. However, the absolute abundance 471
observed (>106 particles cm-3) is greater than predicted by the atmospheric 472
models by one or more orders of magnitude. The clustering of the particles into 473
what appears to be porous clusters, or fluffy aggregates, was not considered in 474
the above models (e.g. Hunten et al., 1980; Kalashnikova et al., 2000; Bardeen et 475
al., 2008; Megner et al., 2008b). It is unclear what the high surface area of the 476
fluffy aggregates will do to their aerodynamic and chemical properties, e.g., 477
settling times and surface reactivity, as this will depend on the mass of the three 478
dimensional particle and it surface area. It is possible that the clustering into 479
fluffy aggregates occurred on the sampling grids rather than being created in the 480
atmosphere. 481
The less abundant particle morphologies require separate explanation. The 482
spherical 2.5-5 nm radius particles could represent the upper end of the size 483
distribution of individual condensates of ambient ablated meteoritic materials. 484
Their larger size causes a faster settling rate and less time for incorporation into 485
aggregates, which may explain their isolated occurrence. The 75-150 nm 486
diameter holes in the 3-nm thick carbon support films may be produced by 487
dense particles rather than fluffy aggregates. These particles are possibly the 488
same type of particles as the observed 25-125 nm dense monoliths. The material 489
in the rims around the holes could be small grains adhered to the surface of the 490
monoliths that were collected on the film as the monoliths breached the film. 491
Alternatively, the material in the rims could result from deformation of the 492
carbon support film at the breach. The holes are observed on the 76.7 93.5 km 493
and 94.5 97.0 km Wallops collection grids. The rings (see Fig. 11) appear to 494
1 2 3 4 5 6 7 8 9 10 11 12 13 14 15 16 17 18 19 20 21 22 23 24 25 26 27 28 29 30 31 32 33 34 35 36 37 38 39 40 41 42 43 44 45 46 47 48 49 50 51 52 53 54 55 56 57 58 59 60
of the liquid concentrated inclusions of sub-nm to 1.5 nm particles at the 496
perimeter, producing the diffuse ring. This phenomenon is commonly observed 497
during TEM analysis of solvent-dispersed synthetic nanoparticles. In the present 498
case, the source of the liquid is not obvious; melting of a solid particle upon 499
impact or upon return of the rocket to Earth are possibilities. No residue was 500
found on the TEM grid that would readily allow the determination of the 501
composition of the incident particle. Water ice particles are considered very 502
unlikely as atmospheric temperatures at the collection altitudes are well above 503
the ice sublimation point. In the cases for which large particulate agglomerates 504
are observed at the perimeter, it appears most likely that these agglomerates 505
were deposited by the incident particle as it liquefied, since adjacent regions of 506
the support film do not contain particles of this size. 507
It must be remembered that observations reported here stem from only a limited 508
1% study of the returned data. When additional studies were to be performed 509
after some time on the Wallops grids and lower altitude Esrange grids, the TEM 510
carbon film had broken in many places during the storage and further analysis 511
was not possible. 512
513
3.2 ECOMA
514
In 2006, 2007 and 2008, MAGIC was launched within the ECOMA program 515
(ECOMA = Existence and charge state of MSPs in the middle atmosphere) from 516
the North-Norwegian Andøya Rocket Range (69°N, 16°E). The ECOMA project 517
was an international research program led by the Leibniz-Institute of 518
Atmospheric Physics (IAP) in Germany and the Norwegian Defence Research 519
Establishment (FFI) in Norway and brought together scientists from Germany, 520
Norway, Sweden, Austria, and in 2008 also from the USA. The general objective 521
was the study of MSPs and their relationship to ionospheric processes 522
(Strelnikova et al., 2009; Rapp et al., 2010, 2012). 523
The main instrument on board the payloads was the ECOMA detector from IAP; a 524
classical Faraday cup detector combined with a Xenon flash-lamp for the active 525
photo-ionization/photo-detachment of MSPs and the subsequent detection of 526
resulting photoelectrons (Rapp and Strelnikova, 2009). During all three 527
1 2 3 4 5 6 7 8 9 10 11 12 13 14 15 16 17 18 19 20 21 22 23 24 25 26 27 28 29 30 31 32 33 34 35 36 37 38 39 40 41 42 43 44 45 46 47 48 49 50 51 52 53 54 55 56 57 58 59 60
were provided by IAP, and ionization conditions were studied in terms of 529
ionospheric composition and turbulence by the Technical University Graz, 530
Austria, and FFI. Figure 12 shows the front deck configuration (under the 531
nosecone) of the ECOMA payloads. Both the 2007 and 2008 campaigns were 532
conducted during the NLC season and the presence of ice particles was 533
monitored by on-board NLC photometers from MISU. In 2008 additional 534
detectors for charged particles were flown by Dartmouth College, USA, and the 535
University of Tromsø, Norway. The rocket-borne measurements were 536
complemented by the comprehensive ground-based instrumentation at Andøya 537
Rocket Rage, in particular the ALOMAR lidars and radars, as well as the EISCAT 538
radar facility. 539
540
3.2.1 ECOMA 2006 Campaign
541
The 2006 ECOMA campaign was planned to feature three launches with two 542
MAGIC detectors on each payload (Fig. 12a-b). The four MAGIC instruments were 543
jointly prepared by NRL and MISU. In an attempt to clean the grids from Si and 544
other contamination in the carbon film, the grids were treated at NRL with a 545
chemical etching using a gas mixture of CF4 and Ar under plasma cleaning 546
conditions. After this the grids were oxidized by plasma cleaning in an 547
atmosphere of O2 and Ar. The first payload and set of two MAGIC detectors were 548
to be refurbished and launched a second time as launch number three. The 549
ECOMA-01 payload was launched on September 8, 2006 at 22:17:00 UT (LT = UT 550
+ 2 h) and reached an apogee of 130.6 km. All instruments performed nominally 551
and the two on-board MAGIC instruments performed the sampling sequence 552
with 7 pins each covering more or less the entire altitude region from 68 to 116 553
km. The ECOMA detector measured photoelectrons from the photo-554
ionization/photo-detachment of MSPs from 80 km altitude on the ascent 555
(Strelnikova et al., 2009). The TEM grids used on this flight were the same type of 556
TEM grids that was used on the earlier MAGIC campaign at Esrange (continuous 557
30 nm carbon film on a 200 lines/inch Cu mesh). The chemical etching of the 558
carbon film before flight also made the carbon film thinner thus improving the 559
1 2 3 4 5 6 7 8 9 10 11 12 13 14 15 16 17 18 19 20 21 22 23 24 25 26 27 28 29 30 31 32 33 34 35 36 37 38 39 40 41 42 43 44 45 46 47 48 49 50 51 52 53 54 55 56 57 58 59 60
The ECOMA-02 payload was launched nine days later on September 17, 2006 at 561
21:06:45 UT and reached an apogee of 130.3 km. The two on-board MAGIC 562
instruments sampled the atmosphere from 68 to 120 km altitude using the same 563
type of grids as was used on the Wallops Island launch in 2005 (ultra thin carbon 564
film on a holey carbon support film and Cu mesh). Unfortunately, this payload 565
was lost to the bottom of the sea due to a malfunction of the payload recovery 566
system, and consequently two MAGIC collectors were lost and analysis of these 567
grids was not possible. This malfunction led to the premature termination of the 568
2006 campaign to investigate the failure and hence, no third launch was carried 569
out. 570
The ECOMA-01 MAGIC sampling grids all suffered from heavy contamination. In 571
addition to the film-like hydrocarbon contamination that was seen on the grids 572
from the 2005 MAGIC campaign there were hydrocarbon blobs: dark, opaque, 573
roundish blobs and lighter, irregularly shaped blobs with central dark spot (Fig. 574
13a-b) Also snow flake shaped hydrocarbon contamination was seen (Fig. 575
13c). The EDX data of the hydrocarbon contamination showed abundance of C 576
and F which is consistent with the lubrication used on the O-rings in the MAGIC 577
housing. So the source of the thick hydrocarbon contamination was most likely 578
vaporising of the O-ring lubricant and melting of the O-rings near the pin exit 579
hole during re-entry into the denser atmosphere. On ECOMA-01 the MAGIC 580
samplers were mounted in a less protected manner than in the two flights in 581
2005 and, hence, where more susceptible to air frictional heating during re-entry 582
(see Fig. 12a-b). 583
Although the hydrocarbon contamination made EDX difficult, abundant spherical 584
particles with radii in the 0.5-5 nm size range were also found on the ECOMA-01 585
MAGIC grids. The most abundant type was Fe-rich particles composed of Fe and 586
Cr with some Ni and Mo. Cr, Ni and Mo are common components of stainless 587
steel, but Mo has a very low abundance in meteoritic material. Also the Cr 588
content (~10-20%) was much higher than what is found in chondrites, or 589
expected in meteoric smoke particles, but consistent with stainless steel. This 590
indicates that these particles are stainless steel and thus most likely 591
contamination. As opposed to the hydrocarbon contamination, the source of the 592
1 2 3 4 5 6 7 8 9 10 11 12 13 14 15 16 17 18 19 20 21 22 23 24 25 26 27 28 29 30 31 32 33 34 35 36 37 38 39 40 41 42 43 44 45 46 47 48 49 50 51 52 53 54 55 56 57 58 59 60
were performed of the composition of suspect parts used in the MAGIC sampling 594
unit and the ECOMA detector, but none of the parts contained Mo. The 595
conclusion was that the stainless steel particles do not come from the MAGIC 596
units, nor from the ECOMA detector, but must come from somewhere on the 597
rocket. A possible explanation was the presence of nanosize steel spheres in a 598
lubricant applied in the payload s nosecone separation system It is also possible 599
that the rocket motor passed the payload after separation due to aerodynamic 600
effects or afterburning. This has happened in some cases in the past, which 601
means that the motor ends up upstream of the payload and all kinds of debris 602
will reach the payload. The first MAGIC grid was exposed between 68 and 73 km 603
while the motor was separated later, at an altitude of 75 km. The second and 604
third TEM grids of that same MAGIC instrument was exposed after the 605
separation (between altitudes 78 and 86 km, and 89 and 93 km, respectively) 606
show at least an order of magnitude more particles per unit area than what is 607
seen on the first grid (see Fig. 14). The second MAGIC instrument exposed its 608
first TEM grid between 78 and 82 km and has the same amount of particles as 609
the subsequent second and third grids. This is consistent with the idea that the 610
contamination could come from the motor. However, even though the grid 611
exposed before motor separation shows much less particles, there were still 612
stainless steel particles with Mo on this grid. Also the reference grids show 613
abundant nanometre sized stainless steel particles containing Mo. The top ring of 614
the front deck of the ECOMA payload (onto which the nosecone is mounted, see 615
Fig. 12a) is made of stainless steel that does contain Mo. It is however not known 616
what process would produce nanometre-sized particles from this surface. If the 617
particles were exclusively from the atmosphere, and assuming a 100% sticking 618
efficiency, the amount of particles on the first, second and third grids of the 619
second MAGIC sampler would correspond to an atmospheric number density of 620
~1.5×104 cm-3 for particles of radius 1 nm and larger (a factor of about two 621
orders of magnitude smaller than for the Wallops Island flight). The second most 622
abundant type of particles was larger in size (~50-100 nm radii) and contained 623
Ca and S with K and/or Na (or possibly Zn). The source of these is not known. No 624
signs were found of ring structures or holes in the film similar to what was seen 625
1 2 3 4 5 6 7 8 9 10 11 12 13 14 15 16 17 18 19 20 21 22 23 24 25 26 27 28 29 30 31 32 33 34 35 36 37 38 39 40 41 42 43 44 45 46 47 48 49 50 51 52 53 54 55 56 57 58 59 60
After the 2006 ECOMA campaign, O-rings and lubricant were changed to more 627
heat resistant types. Also an extension to the MAGIC instrument was added to 628
protect the pin exit hole and the volume around it from the possible airflow 629
through the ECOMA detector (see Fig. 12c). These extensions also served as heat 630
shields of the upper MAGIC housing during re-entry. 631
632
3.2.2 ECOMA 2007 Campaign
633
Similar to the 2006 ECOMA campaign, the 2007 campaign was planned to feature 634
three launches with two MAGIC detectors on each payload. On August 3, 2007 at 635
23:22:00 UT the ECOMA-03 payload was launched and reached an apogee of 126 636
km. Unfortunately, also this payload was lost to the bottom of the sea due to a 637
malfunction of the payload recovery system. The decision was made to terminate 638
the campaign prematurely to investigate the malfunction, and return in 2008. 639
Now all four MAGIC collectors originally manufactured at NRL had been lost. 640
Thanks to the efforts of NRL, MISU and DLR Moraba, two new MAGIC samplers 641
could be built mainly from spare parts. 642
643
3.2.3 ECOMA 2008 Campaign
644
MAGIC particle samplers were flown on three payloads during the ECOMA 645
campaign in June/July 2008. One MAGIC instrument for each rocket payload was 646
jointly prepared by NRL and Stockholm University, again with the first payload 647
and MAGIC collector to be refurbished and launched a second time. The three 648
launches (ECOMA-04, -05 and -06) took place on June 30 at 13:22 UT, July 7 at 649
21:24 UT, and July 12 at 10:46 UT, respectively (LT = UT + 2h). The payloads 650
performed nominally and were successfully recovered by boat after the water 651
landing. The scientific conditions for all flights were interesting. All three went 652
into NLC ice particle layers as confirmed by the on-board photometers from 653
Stockholm University. For the first and third flights, sampling was performed 654
below (one grid), within (one grid) and above (two grids) the NLC on each flight. 655
On the second flight, the opening of the extension of the first pin was delayed for 656
some unknown reason and the sampling started inside the NLC. Two additional 657
pins in each MAGIC collector were prepared with grids and used as reference (i.e. 658
1 2 3 4 5 6 7 8 9 10 11 12 13 14 15 16 17 18 19 20 21 22 23 24 25 26 27 28 29 30 31 32 33 34 35 36 37 38 39 40 41 42 43 44 45 46 47 48 49 50 51 52 53 54 55 56 57 58 59 60
during the first and third flight and completely absent during the second. The 660
ECOMA detector reported the presence of particles above 77 km for ECOMA-04, 661
above 81 km for ECOMA-05, and above 70 km for ECOMA-06 (Rapp et al., 2010). 662
Above 90-95 km the ECOMA photoelectron measurement is most likely 663
contaminated by photoelectrons from the photo-ionisation of NO (Rapp and 664
Strelnikova, 2009; Rapp et al., 2012). 665
The TEM grids used for these flights were the 30 nm continuous carbon film on 666
Cu support grids also used earlier. Also this time the grids were pre-treated at 667
NRL to reduce Si and other contaminants and to improve the contrast by making 668
them thinner. The grids were then characterised at Stockholm University before 669
launch to determine the quality of the carbon film, the number of particles and 670
their chemical composition. This analysis was made in the four central squares of 671
each grid and in one grid that is covered by the Cu masks (Fig. 15a). The grid 672
square covered by the Cu mask was used as an on-grid reference area. This 673
characterisation was then used to rank the quality of the TEM grids and to 674
determine which ones should be mounted in the MAGIC collector. The same 675
analysis was then also made after the flights. The set of six TEM grids from the 676
ECOMA-04 flight was analysed at Stockholm University, while the two sets from 677
the ECOMA-05 and -06 flights were directly shipped back to NRL for analysis. 678
During the pre-flight analysis, the only elements that could be observed in the 679
carbon film above the detection limit were C (film and some flakes), O, F, Si 680
(particles smaller than 5 nm) and Cu. F and possibly O originate from the plasma 681
cleaning process, while Si is still some contamination left from the grid 682
manufacturing process also after the plasma cleaning. The Cu signal originates 683
from the fluorescence of the surrounding support grid and possibly from 684
deposition onto the film by the plasma cleaning process. In STEM-HAADF mode 685
small particles could be observed that by spot measurements give EDX spectra 686
that locally indicate high concentrations of the elements Na, Al, Mg, Si, Cr, Mn, Fe 687
and Ni. After the launch the same characterisation was performed on the 688
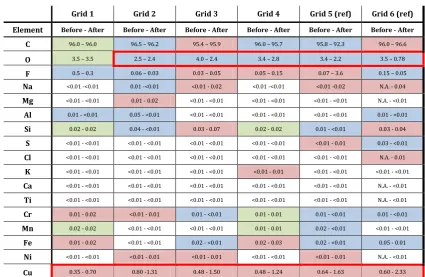
ECOMA-04 grids at Stockholm University. Table 1 summarizes the elemental 689
composition analysis of the TEM grids before and after launch. The conclusions 690
from this characterisation are that the grids survived almost intact with no 691
1 2 3 4 5 6 7 8 9 10 11 12 13 14 15 16 17 18 19 20 21 22 23 24 25 26 27 28 29 30 31 32 33 34 35 36 37 38 39 40 41 42 43 44 45 46 47 48 49 50 51 52 53 54 55 56 57 58 59 60
the carbon film was the same, with the exception of an increase of Cu and a 693
reduction of O (highlighted with red squares in Table 1). There were no signs of 694
hydrocarbon contamination or stainless steel particles on any of the grids. 695
Hence, the change of O-ring lubricant and the addition of the extension as a 696
protection and heat shield after the ECOMA-01 launch helped. However, no 697
flight-sampled nanometre-sized particles could be identified. 698
The increase of Cu on the carbon film is significant, and it increases with altitude. 699
However, the highest concentrations are observed on the reference grids that 700
were not exposed. The increase in Cu content is seen as an addition of small sub-701
nanometre to nanometre particles onto the carbon film. Except on the first grid, 702
the oxygen content of the carbon film decreases significantly with exposure 703
altitude, including the reference grids. The concentrations of the other elements 704
were more or less constant. A large number of STEM-HAADF images of the 705
carbon film were recorded with the aim to calculate the number of collected 706
particles and their sizes. The general observation was that with increasing Cu 707
content the number of particles also increased. This causes a problem in 708
identifying smoke particles by EDX as the noise from the Cu contamination 709
drains the signal from the other elements. 710
On the grid that was exposed when the payload passed through the NLC layer, 711
large spherical agglomerates (radii ~0.5 - 0.8 m) were found after the flight. 712
Energy filtered imaging (Fig. 16) shows that they contain Na, S, Si and O with 713
some Cl, K, Ca, Mg, Cr, Mn and Fe in both the centre and outer parts of the 714
agglomerated material. The number of such agglomerates was estimated to 715
about four in each of the four central squares. Similar agglomerates were, 716
however, also found on the reference square under the Cu mask (Fig. 17a). The 717
Cu mask was not mounted completely flush to the TEM grid, so there is a 718
possibility for particles to enter in the space between them and end up on a grid 719
square under the mask. More careful studies showed appearance of this type of 720
particles also on the two unexposed reference grids (Fig. 17b-c). It is possible 721
that, even if they were not observed before flight, they could have been there 722
from the beginning. These agglomerates are very similar in shape and size to the 723
patterns seen on the surfaces exposed to NLC in the 1960s (Hemenway et al., 724
1 2 3 4 5 6 7 8 9 10 11 12 13 14 15 16 17 18 19 20 21 22 23 24 25 26 27 28 29 30 31 32 33 34 35 36 37 38 39 40 41 42 43 44 45 46 47 48 49 50 51 52 53 54 55 56 57 58 59 60
from the 1 km thick ice layer as seen by the on-board NLC photometer, the 726
number density derived from the second grid is 0.5 cm-3 (if the sticking efficiency 727
is 100 %). This is a factor of about two orders of magnitude smaller than for 728
typical NLCs (e.g. von Cossart et al., 1999; Baumgarten et al., 2008). 729
The grids from ECOMA-05 and -06 that were shipped to NRL were not in the 730
same good condition when they arrived as the grids that were analysed at 731
Stockholm University. There were many places were the carbon film had 732
ruptured, and this most likely happened during transport. An attempt was made 733
to calculate the number of nanometre sized particles and their size distribution 734
on the ECOMA-06 grids. The results are summarised in Table 2 and from this it 735
can be seen that the particles on all grids are almost identical, with similar mean 736
radius and spread. The atmospheric particle number densities calculated 737
assuming 100% sticking efficiency are several orders of magnitude higher than 738
what is expected from models for particles of this size and for polar summer 739
conditions (Megner et al., 2008a). This all suggests that these particles are in fact 740
contamination. 741
742
3.3 PHOCUS
743
The last flight of a MAGIC sampler was on the PHOCUS sounding rocket launched 744
from Esrange Space Centre, Sweden, on July 21, 2011, at 07:00:53 UTC into a 745
strong NLC. PHOCUS, which is an acronym for Particles, Hydrogen and Oxygen 746
Chemistry in the Upper Summer mesosphere, was a Swedish sounding rocket 747
project led by MISU with contributions from Norway, Germany, Austria and the 748
USA (Gumbel et al., 2013; Havnes et al., 2013; Hedin et al., 2013; Sternovsky et 749
al., 2013). In this context, particle species comprise ice particles, smoke particles 750
of meteoric origin, and possibly other background particles formed by 751
conversion from trace gases. Important questions concerned both the properties 752
of particle layers and their interaction with various phenomena in the 753
mesosphere and lower thermosphere. This includes the relationship between 754
smoke and ice, ice particle nucleation and evolution, and the possible influence of 755
these particle species on chemistry. Both the German/Norwegian ECOMA project 756
and PHOCUS aimed at the characterization of smoke and ice particles and their 757