This is a repository copy of
Applying the Rasch Model to Measure Kansei Responses to
Fabric Seats
.
White Rose Research Online URL for this paper:
http://eprints.whiterose.ac.uk/91123/
Version: Accepted Version
Proceedings Paper:
Camargo,, FR, Kawano,, K, Motohata,, K et al. (2 more authors) (2014) Applying the
Rasch Model to Measure Kansei Responses to Fabric Seats. In: The Proceedings of the
Kansei Engineering and Emotion Research International Conference 2014. Kansei
Engineering and Emotion Research, 10-13 Jun 2014, Linkoping, Sweden. .
This is an author produced version of a paper presented at Kansei Engineering and
Emotion Research Conference 2014.
[email protected] https://eprints.whiterose.ac.uk/
Reuse
Unless indicated otherwise, fulltext items are protected by copyright with all rights reserved. The copyright exception in section 29 of the Copyright, Designs and Patents Act 1988 allows the making of a single copy solely for the purpose of non-commercial research or private study within the limits of fair dealing. The publisher or other rights-holder may allow further reproduction and re-use of this version - refer to the White Rose Research Online record for this item. Where records identify the publisher as the copyright holder, users can verify any specific terms of use on the publisher’s website.
Takedown
If you consider content in White Rose Research Online to be in breach of UK law, please notify us by
KEER2014, LINKÖPING | JUNE 11-13 2014
INTERNATIONAL CONFERENCE ON KANSEI ENGINEERING AND EMOTION RESEARCH
Applying the Rasch Model to Measure Kansei
Responses to Fabric Seats
FR Camargo1, K Kawano2, K Motohata2, K Hayashi2, B Henson3and T Kawai4
1
University of Leeds, School of Mechanical Engineering, United Kingdom,[email protected]
2Toyota Boshoku Corporation, Evaluation and Engineering Division, Japan 3
University of Leeds, School of Mechanical Engineering, United Kingdom
4Toyota-Boshoku Corporation, BR-SNW Department, Japan
Abstract:This paper is concerned with the empirical development of a scale to measure tactile interaction based on users’ experience with fabric seats. Volunteers slid their fingertips over samples of fabric, giving their ratings against kansei statements. Physical interaction was
established by the friction coefficient of the contact measured through two different devices. Firstly, a commercially available metallic probe was used. The mechanism is designed to collect data within the frequency range that can be perceived by humans. Secondly, a tactile tribometer using a multiple layer model to mimic human characteristics was used. Scales of measurement were
established through the Rasch model. As a result, a linear metric was obtained for samples of fabric, which allowed the alignment of the responses with the physical properties associated with the materials’ roughness and coefficient of friction.
Keywords:Kansei Measurement, Evaluation, Rasch Model, Fabric Seats, Friction.
1. INTRODUCTION
The development of new tactile features for fabric of car seats requires better understanding of the kansei attributes associated with the users’ experience. However, these underlying attributes solely exist as an element of a premise or a concept, called latent trait or construct, such as attractiveness or pleasantness. Those attributes cannot directly be measured and inferences based on their assessment are error-prone. One solution to overcome the difficulties for a more reliable interpretation of numerical outcomes is to establish theory-driven scales of measurement.
Physical interaction with the pieces of fabric was conceptualized in the study by the friction coefficient obtained through two mechanical devices designed for simulating the human fingertip friction. One of the mechanisms was a commercially available metallic probe designed to collect data within the frequency range that can be perceived by humans. The other mechanism was a tactile tribometer designed to mimic human characteristics. We adopted this approach to obtain frictional forces instead of touch-feel data from real people because a mechanical device could serve the purpose of a useful benchmark (Shao et al., 2009). It is noteworthy that the devices were used as two different alternatives to collect physical data. Nevertheless, the comparison of performance between the two devices was not part of the study’s scope.
In the investigation we used techniques based on kansei engineering to establish stimulus statements (Nagamachi, 2008). Kansei responses were subsequently transformed into objective measures using a rationale based on the Rasch model (RM) (Andrich, 1988). Objective measures are obtained when the comparison between a pair of variables is independent of the particular sample of persons taken as instrumental and the relative difference between any two persons is independent of the relevant variables taken as elements of comparison (Andrich, 1988). The RM refers to a family of probabilistic models that provide mechanisms to test the hypothesis that the observations meet the necessary assumptions for objective measurement.
The results have suggested that objective measures can be established for fabric seats after calibration of the scales. Furthermore, the calibrations developed in the research allowed the association of the coefficient of friction (COF) and characteristics of roughness of the materials with the kansei responses based on users’ experience.
2. KANSEI RESPONSES
Different aspects of the materials used in fabric of car seats ought to be considered when developing new features. One of them is the contribution of sensory information from the physical contact along with the users’ impressions of an underlying attribute of the product, called kansei responses in this study.
The most common framework for eliciting kansei responses to design elements is to identify adjectives that people use to describe the product and embody them into self-report questionnaires. A number of consumers are asked to give a rating of the degree to which each word describes a range of products. The responses to the questionnaires are turned into a measure of kansei responses using statistical techniques such as principal component analysis (PCA).
However, such procedures aggregate a considerable amount of inaccuracies in the measurement process. Inaccuracies can in many cases be associated with biased scales influenced by differences of sex, age groups and cross-cultural preferences, difficulty in establishing equal interval in scales, and qualitative dimensions identified in a study, which are subject to circumstances of sampling (Camargo and Henson, 2012). Consequently, it is difficult to interpret the results beyond the considered sample, limiting the understanding of a more general human–product interaction.
2.1. Measurement of kansei responses using the Rasch model
The RM is a probabilistic approach that yields interval measures and examines the alignment of those measures against scientific measurement principles based on additivity, a constant unit and invariant comparisons. The RM predicts response probabilities from two independent parameters, one for estimation ofitems, referred to as kansei words or statements henceforth, and another one for estimation of persons on the same scale.
The model embodies two key assumptions. The first assumption is that the response of a person to an item must not interfere with his or her response to another item within the same scale. The second assumption is that the scale ought to be unidimensional.
A number of RMs have been used in different applications. Camargo and Henson (2012) have adapted for applications in KE the many-facet Rasch model developed by Linacre (1989). Thus, assuming that the data fit the model, it is possible to transform a categorical scale into an interval level with the logit as unit of measurement.
3. METHOD
A two-stage experiment was designed to demonstrate the quantitative correspondence between users’ kansei responses and physical characteristics of some pieces of fabric. The first stage was used for calibrating a kansei metric and the second stage for collecting physical data.
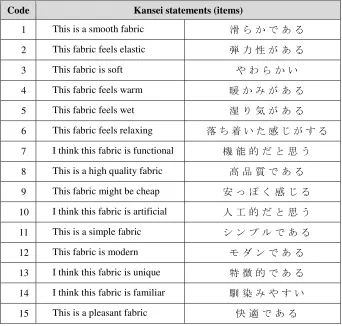
[image:4.595.127.469.439.765.2]We firstly established a preliminary pool of words to express the users’ experience associated with touch. Based on the understanding of the product context, 98 kansei words were obtained from catalogues of manufacturers, online consumers’ reviews, advertisement and scientific literature. Subsequently, we selected a pool of 15 statements as relevant to the application (Table 1).
Table 1: Preliminary pool of kansei statements.
Code Kansei statements (items)
1 This is a smooth fabric
2 This fabric feels elastic
3 This fabric is soft
4 This fabric feels warm
5 This fabric feels wet
6 This fabric feels relaxing
7 I think this fabric is functional
8 This is a high quality fabric
9 This fabric might be cheap
10 I think this fabric is artificial
11 This is a simple fabric
12 This fabric is modern
13 I think this fabric is unique
14 I think this fabric is familiar
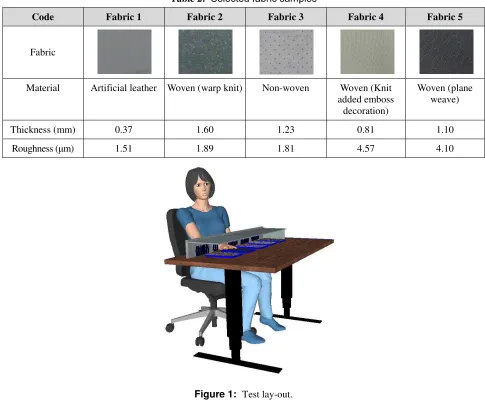
We selected five samples of fabric with the dimensions of 150mm x 150mm according to the material and characteristics of the surface (Table 2). A barrier was used to prevent visual contact of respondents with the samples. We asked participants to dry their fingers. They were also instructed through a demonstration to slide their index fingertip applying just sufficient force and slow speed ( 10 mms-1) to feel the sample (Figure 1).
[image:5.595.54.539.256.659.2]We collected data from 96 participants, 94.8% males, 50% in the age range from 18 to 35 and 50% over 35. The size of the sample was established according to the stability of the metric assuming a measurement error of 0.5 logit at 95% level of the confidence interval (CI). The participants gave ratings of their endorsement based on a five-point scale (i.e., strongly disagree, disagree, neutral, agree, and strongly agree) using computer-based self-report questionnaires (translated to Japanese language).
Table 2: Selected fabric samples
Code Fabric 1 Fabric 2 Fabric 3 Fabric 4 Fabric 5
Fabric
Material Artificial leather Woven (warp knit) Non-woven Woven (Knit
added emboss decoration)
Woven (plane weave)
Thickness (mm) 0.37 1.60 1.23 0.81 1.10
Roughness ( m) 1.51 1.89 1.81 4.57 4.10
Figure 1: Test lay-out.
3.1. Coefficient of friction and roughness for the samples using a metallic probe
Figure 2: Sensor us
The materials’ roughness was o graphical correspondence with ka KES®and the artificial fingertip.
3.2. Coefficient of friction fo
A multiple layer model was used encapsulated silicone with a thin combination of silicone gel base an simulate the bone, there is a hard testing system to measure the fric an X–Z motion table, an artificial Instruments LabVIEW® system (F was slid over the samples of fabric piece of fabric was computed alon
Figure 3: 3.3. Rasch analysis of kans
Calibration of the measurement Rasch model using the software p sources of misfit to the model, su and differential item functioning consistently greater ability to endo assumption of response independe an item determined the response t
Different indices were used as them was obtained through the item the degree of invariance across t differences between the observed based on the model. Non-significa
sor used with the Friction Tester KES® (Kato tech Co.
was obtained using the KES® system. The readin ith kansei responses and COF for both system
for the samples of fabric using an artif
s used to mimic the human’s fingertip sensitivity. T a thin polyurethane layer to represent skin. T ase and elastomer to represent soft tissue. To supp
hard core at the back of the artificial fingertip (Sh e friction force between the fingertip consisted of tificial fingertip, a controller and a software progra
em (Figure 3). The artificial fingertip was fixed to t fabric using speed of 10mms-1. The average of fo
along with their standard error.
3: Finger friction tribometer (Shao et al., 2010). nsei responses
ment scale for kansei responses was carried out are package RUMM2030®. Throughout the anal el, such as respondents’ inconsistent use of the oning for age groups (whether a person subg
endorse an item than another subgroup). Further pendency through of the degree of correlation in w onse to another item.
d as quality control for calibration of the measure he item-construct interaction using chi-square stat cross the construct (Andrich, 1988). The statistic served scores of all persons at 95% of the CI and th
gnificant variance across the construct was given
h Co. Ltd.)
eadings were used for the systems, the friction tester
tificial fingertip
ivity. The outer layer is an kin. The inner layer is a o support the fingertip and ip (Shao et al., 2010). The ted of a two-axis load cell, program using a National ed to the motion table and e of four readings for each
d out through the faceted e analysis we investigated the response categories subgroup demonstrated urthermore, we tested the n in which the response to
[image:6.595.209.388.392.534.2]quality control was the analysis of fit statistics for the person and item interaction with the model. Those statistics represented the residuals between the expected values by the model and the observed values obtained for each person computed over all items and for each item computed over all persons. The residuals were firstly transformed into a z-distribution. The perfect fit would be indicated by a mean of the residuals equal to zero with standard deviation (
) of one. In practice, however, we can only obtain an approximation from a perfect fit. Thus, an item-person interaction with fit residual statistic indicating
1.40 was deemed acceptable in this study. Individual person and item deviations from the model were indicated as chi-square statistics. Residuals
2.5 indicated misfit to the model, representing around 99% of the CI (Pallant and Tennant, 2007).Test for multi-dimensionality indicated whether the variables were measuring different underlying kansei constructs. We formally tested the dimensionality of the construct through PCA of the residuals, determining two subsets according to the pattern of first factor loadings. Using paired t-tests we examined the difference between person estimates for the two subsets. We deemed the construct as unidimensional when a proportion of the t-tests
0.05 fell outside of the t-range of ±1.96 for the CI (Tennant and Conaghan, 2007).4. RESULTS
4.1. Calibration of the metric
Data from the preliminary pool of items were initially tested, indicating inconsistent response patterns and, therefore, the system was re-scored into four categories. The response categories of Item 9 were additionally recoded by applying reversed order. That is, the statement “This fabric might be cheap” held an opposite vector when comparing with the other items in the pool, according to the preliminary analysis of the data.
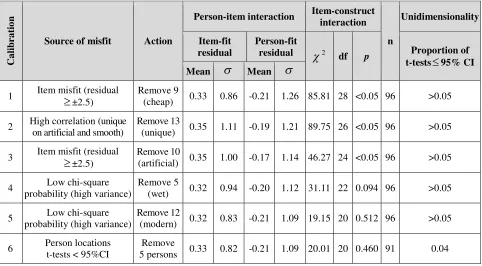
[image:7.595.58.540.508.774.2]Decision criterion to remove five items from the analysis was based on individual item-fit and high positive correlations of item-person residuals. The procedures for deletion of items can be traced throughout the sequence of calibrations (Table 3).
Table 3: Summary of the calibration steps and fit statistics
C
a
li
b
r
a
ti
o
n
Source of misfit Action
Person-item interaction Item-construct interaction
n
Unidimensionality
Item-fit residual
Person-fit residual
2df p Proportion of t-tests
95% CIMean
Mean
1 Item misfit (residual
±2.5)
Remove 9
(cheap) 0.33 0.86 -0.21 1.26 85.81 28 <0.05 96 >0.05
2 High correlation (unique
on artificial and smooth)
Remove 13
(unique) 0.35 1.11 -0.19 1.21 89.75 26 <0.05 96 >0.05
3 Item misfit (residual
±2.5)
Remove 10
(artificial) 0.35 1.00 -0.17 1.14 46.27 24 <0.05 96 >0.05
4 Low chi-square
probability (high variance)
Remove 5
(wet) 0.32 0.94 -0.20 1.12 31.11 22 0.094 96 >0.05
5 Low chi-square
probability (high variance)
Remove 12
(modern) 0.32 0.83 -0.21 1.09 19.15 20 0.512 96 >0.05
6 Person locations
t-tests < 95%CI
Remove
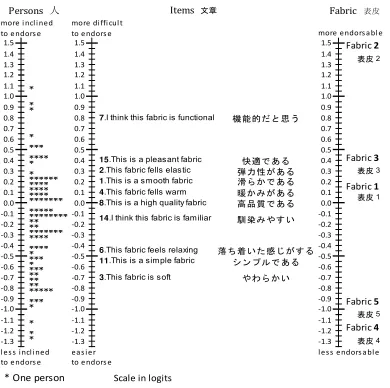
The metric is the representation of the relative locations of all facets on the same logit scale (Figure 4). In the metric, person locations are indicated in the first column. The relative locations indicate ordered levels of endorsement to the samples of fabric. The second column of the metric indicates the levels of difficulty of endorsement for items. Column Fabric presents the relative location of the samples of fabric on the continuum. Locations, standard errors of measurement and fit residuals are indicates in Table 4.
Figure 4: Metric with 10 calibrated items for the five samples of fabric 4.2. Relationship between kansei responses and friction
The metric for persons’ kansei responses and the coefficient of friction for the samples of fabric were, in this study, designed to share the physical characteristic obtained from the texture of surfaces (roughness). The correspondences were established according to the method adopted for computing the coefficient of friction.
4.2.1. Correspondence using KES® system
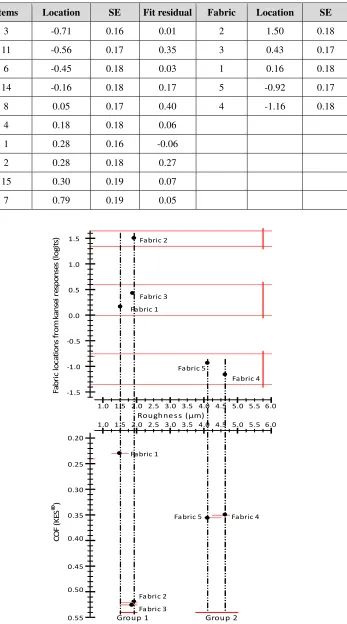
Figure 5 is a graphical representation of the correspondence between the metric for kansei responses and the KES® system used to obtain the measurement of the forces fxand fy , such
that = fx / fy represents the coefficient of friction. The linear metric for kansei responses,
represented by the vertical axis at the upper part of the graph, was obtained from Table 4. The
* * * * *** **** * * ****** **** **** **** ******* ***** ******** ** ** ******* **** **** * *** * *** ** ** ** ***** *** * * * *
* One person Scale in logits
2 3 1 5 4 1.3 1.3 -1.0 -1.1 -1.2 -1.3 -1.3 1.1 1.0 0.9 1.3 1.4
1.5 Fabric2
Fabric3
6.This fabric feels relaxing
7.I think this fabric is functional
15.This is a pleas ant fabric
0.8 0.9 1.0 -0.3 -0.4 -0.5 -0.6 1.1 1.0 0.9 -1.3 -1.0 -1.1
-1.2 Fabric4
Fabric5
1.4
1.5 1.5
1.4
Fabric1
3.This fabric is s oft
4.This fabric fells warm
8.This is a high quality fabric
11.This is a sim ple fabric
14.I think this fabric is fam iliar
-0.7 -0.8 -0.9 -0.1 -0.2 0.8 0.7 0.6 -0.4 -0.5 -0.6 -0.7 -0.8 -0.9 0.2 0.1 0.0 -0.1 -0.2 -0.3
1.This is a s mooth fabric
0.8 0.7 0.6 0.5 0.4 0.3 0.1 -0.7 -0.8 -0.9 -1.0 -1.1 -1.2 -0.1 -0.2 -0.3 -0.4 -0.5 -0.6 0.6 0.7 Fabric Items 1.1 0.0 0.1 0.2 0.3 0.4 0.5 Persons
more i ncl i ned to e ndors e
1.2 1.2 1.2
2.This fabric fells elas tic
0.5 0.4 0.3 0.2
0.0
l e s s i ncl i ned to e ndors e
more di ffi cul t to e ndors e
ea s i e r to e ndors e
Table 4: Locations in logits of items and fabric and their measurement errors
Items Location SE Fit residual Fabric Location SE
3 -0.71 0.16 0.01 2 1.50 0.18
11 -0.56 0.17 0.35 3 0.43 0.17
6 -0.45 0.18 0.03 1 0.16 0.18
14 -0.16 0.18 0.17 5 -0.92 0.17
8 0.05 0.17 0.40 4 -1.16 0.18
4 0.18 0.18 0.06
1 0.28 0.16 -0.06
2 0.28 0.18 0.27
15 0.30 0.19 0.07
7 0.79 0.19 0.05
Fa bri c 5
Fabric 5
Fabric 4
4.5 5.0 5.5
Fabric 4 Fa bric 1
Group 1 Group 2
Fabric 5 0.20
Fa bric 3 0.25
Fa bric 2
C
O
F
(K
E
S
®)
0.30
0.35
0.45
0.50
0.55 0.40
4.5 5.0 5.5 6.0 3.0 3.5 4.0
Roughne s s ( m)
1.0 1.5 2.0 2.5 3.0 3.5 4.0
1.0 1.5 2.0 2.5 6.0
F
a
b
ri
c
lo
c
a
ti
o
n
s
fr
o
m
k
a
n
se
i
re
sp
o
n
se
s
(l
o
g
it
s) 1.5 Fabric 2
1.0
0.5
Fabric 3
Fa bric 1 0.0
-0.5
-1.0
[image:9.595.185.409.257.704.2]-1.5
dashed, red lines indicate the location of a sample plus the standard error (SE). Samples were grouped when their SE overlapped. Three groups under this condition were established as follows: Sample 2, group formed by Samples 1 and 3 and group formed by Samples 4 and 5.
The roughness levels (Ra) are indicated by the horizontal axis. The vertical dashed, black lines indicate the bounds of roughness for samples based on the kansei responses. However, only one reading of roughness was obtained for each fabric and, therefore, the measurement error was not computed in the study. Two groups were formed: the group formed by Samples 1, 2 and 3, and the group established by Samples 4 and 5.
The lower part of Figure 5 represents the correspondence between the coefficients of friction and the locations of samples on the kansei continuum. However, only one reading of friction force was obtained for each fabric and, therefore, the measurement error was not computed in the study. Two groups of kansei responses associated with the roughness can be established: Group 1 formed by Fabric 1, 2 and 3 with roughness between 1.51 m and 1.89 m, and Group 2 formed by Fabric 4 and 5 with roughness between 4.10 m and 4.57 m. However, a range of COF was not identified within the discrimination of kansei responses.
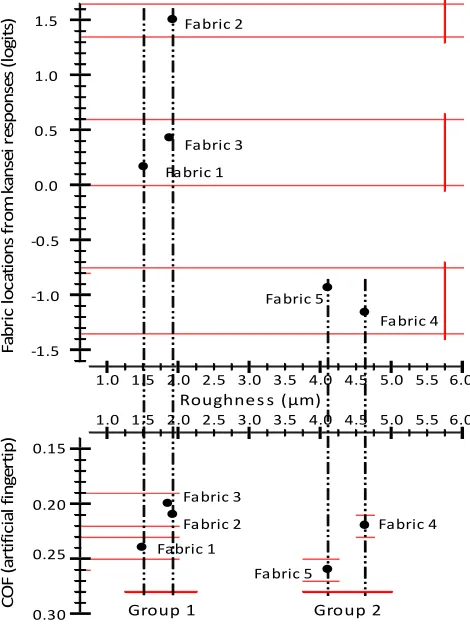
4.2.2. Correspondence using the artificial fingertip
Similarly, a graphical representation of the correspondence between the metric for kansei responses and the artificial fingertip system was established (Figure 6). At the upper part of Figure 6 the horizontal dashed, red lines indicate the lower and upper bound of kansei responses that can be associated with the interval of COF indicated at the lower part of the graph by the dashed, red lines. The red lines indicate the location of a sample plus the standard error (SE). Samples were grouped when their SE overlapped.
Fa bri c 5
Fa bric 5
Fa bric 4 -1.5
1.0 1.5 2.0 2.5 3.0 3.5 4.0
F a b ri c lo c a ti o n s fr o m k a n se i re sp o n se s (l o g it
s) 1.5 Fabric 2
1.0
0.5
Fabric 3 Fa bric 1 0.0
-0.5
-1.0
1.0 1.5 2.0 2.5 3.0
Fabric 4
Fa bric 5
Group 1
6.0 4.5 5.0 5.5 6.0
4.5 5.0 5.5
Roughne s s ( m)
3.5 4.0 0.30 C O F (a rt if ic ia l fi n g e rt ip ) 0.15 0.20 Fabric 1 0.25
Fa bric 3 Fa bric 2
[image:10.595.179.414.423.737.2]Group 2
Two groups of kansei responses associated with the roughness can be established: Group 1 formed by Fabric 1, 2 and 3 with COF from 0.20 to 0.23 using the artificial fingertip and with roughness between 1.51 m and 1.89 m, and Group 2 formed by Fabric 4 and 5 indicating COF from 0.22 to 0.26 using the artificial fingertip and with roughness between 4.10 m and 4.57 m.
5. DISCUSSION
The relationship between the kansei responses, the characteristic of roughness of each sample of fabric and its coefficient of friction has been made possible by overlapping the metrics. The metrics are assumed to be linear because all elements can be represented as fixed positions along one straight line. For the kansei responses, the linearity of the scale is a property of the RM. We used the procedures from Rasch analysis, called calibration, to verify empirically whether the data were conformed to the model, which allowed the control of variance and traceability in the study.
The sequence of calibrations using the RM produced a scale for some samples of fabric with a quantitative property. This property was achieved after fitting data to the model. In more typical statistical approaches in the domain, which fit a model to the data at hand, the assumption that data hold at least interval properties ought to be tested and not just assumed. The theoretical foundations of the RM, in contrast, provided mechanisms to examine whether the data fitted together and cooperated to define the kansei differences among the samples of fabric. Two of the main sources of misfit in the data set were the response dependence (i.e., when an item interfered with the response to another item) and the construct dependence (when the kansei statements represented more than one construct). After resolving for the misfits, an interval scale in logit was produced.
The log-odds unit, typically called logit, was the unit of measurement used by the model. Scores, which were transformed into locations in logit on the continuum, attain meaning when comparing a pair of persons, items or stimuli through the distance between locations. Ben Wright (1993) once stated the logit for latent variables is not more difficult to understand than the unit ampere for electric current. They not only measure an invisible, underlying variable but also they present the property of invariant comparisons. As a result from this property, particular differences between any pair of persons and any pair of samples of fabric have the same interpretation across the scale. Furthermore, if the calibrated items are fixed at their locations, estimates for a new reasonably targeted sample of persons can be obtained and valid comparisons can be established. Similar reasoning can be elaborated with regard to the samples of fabric.
6. CONCLUSION
In this research we investigated the users’ impression with regard to different textures and materials of fabric for car seats. The purpose was to demonstrate that distinct impressions could be measured by a scale based on kansei attributes.
kansei responses were identified. Furthermore, through overlapping metrics we distinguished two ranges of coefficients of friction related to the responses when using the artificial fingertip. However, no coefficient of friction brackets for the groups of kansei responses were found when using the KES® system.
The calibration procedures gave evidence that part of the data fitted the Rasch model, producing a linear scale for the kansei responses and achieving the model’s property of invariant comparisons. That is, particular differences between any pair of persons and any pair of stimulus objects have the same interpretation across the scale. Users’ distinction of different textures and materials of fabric can, therefore, quantitatively be made independently of any particular kansei attribute.
The model’s properties of invariant comparisons, same interval for the linear continuum and a constant unit in logit were achieved for the scale of fabric based on kansei attributes. As a consequence, we demonstrated the construction of the quantitative correspondence between the scale for kansei responses and the scale for physical characteristics related to the surfaces’ roughness and coefficients of friction.
ACKNOWLEDGMENTS
This research was supported by an agreement between Toyota Boshoku Corporation through the Internship Program and the University of Leeds. The authors gratefully acknowledge use of the facilities of the Division of Evaluation and Engineering in Japan.
REFERENCES
Andrich, D. (1988). Rasch models for measurement. Sage University Papers series on Quantitative Applications in the Social Sciences, No. 68, London: Sage Publications.
Camargo, F.R. and Henson, B. (2011). Measuring affective responses for human-oriented product design using the Rasch model. Journal of Design Research, 9(4), 360 – 375.
Camargo, F.R. and Henson, B. (2012). Invariant comparisons in affective design. In: Y.G. Ji (ed.), Advances in affective and pleasurable design (pp. 490 – 499). Boca Raton: CRC Press.
Camargo, F.R. and Henson, B. (2012). The Rasch probabilistic model for measuring affective responses to product features. International Journal of Human Factors and Ergonomics, 1(2), 204 – 219.
Linacre, J.M. (1989). Many-facet Rasch measurement. Chicago: MESA Press.
Nagamachi, M. (2008). Perspectives and the new trend of kansei/affective engineering. The TQM Journal, 20(4), 290 – 298.
Pallant, J.F. and Tennant, A. (2007). An introduction to the Rasch measurement model: an example using the Hospital Anxiety and Depression Scale (HADS). British Journal of Clinical Psychology, 46(1),1 – 19.
Shao, F., Chen, X., Barnes, C.J. and Henson, B. (2010). A novel tactile sensation measurement system for qualifying touch perception. Journal of Engineering in Medicine, 224(1), 97 – 105.
Shao, F., Childs, T.H.C. and Henson, B. (2009). Developing an artificial fingertip with human friction properties. Tribology International, 42 (11/12), 1575 – 1581
Tennant, A. and Conaghan, P.G. (2007). The Rasch measurement model in rheumathology: What is it and why use it? When should it be applied, and what should one look for in a Rasch paper? Arthritis & Rheumatism, 57(8), 1358 – 1362.