Supporting Information
for
Adv. Mater.,
DOI: 10.1002/adma.201404787
One Step Creation of Multifunctional 3D Architectured
Hydrogels Inducing Bone Regeneration
1
Copyright WILEY-VCH Verlag GmbH & Co. KGaA, 69469 Weinheim, Germany, 2014.
Supporting Information
With One Step to Multifunctional 3D Architectured Hydrogels Inducing Endogenous Regeneration
Axel T. Neffe, Benjamin F. Pierce, Giuseppe Tronci, Nan Ma, Erik Pittermann, Tim Gebauer, Oliver Frank, Michael Schossig, Xun Xu, Bettina Willie, Michèle Forner, Agnes Ellinghaus, Jasmin Lienau, Georg N. Duda, and Andreas Lendlein*
Supporting Information Figures
4000 3500 3000 2500 2000 1500 1000
Ab so rb an c e [a. u .]
Wavenumber [cm-1
]
4000 3500 3000 2500 2000 1500 1000
Abs o rban ce [ a .u.]
Wavenumber [cm-1
[image:2.595.92.484.297.478.2]]
Figure S1. IR spectra of the ArcGels after washing. No peak at 2250 cm-1 is present, which would indicate residual isocyanate.
Figure S2. Macroscopic form stability of the gelatin-based ArcGel G10_LNCO8 (corresponding to the direct step from a to f in Figure 2 in the main text). The ArcGel (I, dry) does not change its outer dimensions when taking up water (II, wet).
I
II
+ Water
[image:2.595.134.465.535.656.2]2
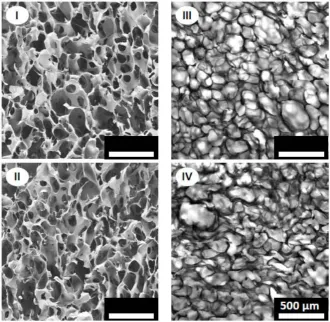
Figure S3. Form stability of pore morphology. The pictures from randomly chosen fields of view of a G10_LNCO5 ArcGel in the dry state (SEM, left, I & II) and wet state (CLSM, right, III & IV) illustrate that neither the pore sizes nor the wall thicknesses change upon water uptake. This can be explained by allocation of water molecules in the large free volume of the material.
0 5 10 15 20 25 30 35 40 0
50 100 150 200 250
I
[
a
.u.]
Scattering angle 2 [°]
[image:3.595.187.389.516.669.2]3
a
b
[image:4.595.70.525.69.524.2]c
d
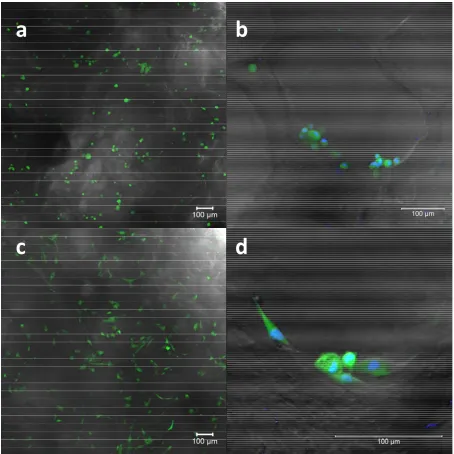
Figure S5. Initial stage of hMSC adhesion on G10_LNCO3. MSCs were stained with CFSE
4
Figure S6. Cytoskeleton organization of hMSCs on the ArcGel G10_LNCO3 after 24 h.
Representative confocal image of F-actin staining (Red).
[image:5.595.159.438.342.715.2]5
Experimental Section
Materials
The materials were purchased from the following companies: Gelatin (Typ A, 200
bloom) with low endotoxin content from GELITA AG (Eberbach, Germany) PEO-PPO-PEO
tri-block copolymer (Pluronic® F-108; short: PEPE) from Sigma-Aldrich Chemie GmbH
(Steinheim, Germany). LDI from Shanghai Infine Chemical Co., Ltd. (Shanghai, China), and
PBS buffer chemicals from Merck KGaA (Darmstadt, Germany).
Methods
One-step ArcGel Synthesis
LDI was added to an aqueous solution of gelatin and PEPE under mechanical stirring
in a flat flange cylindrical jacketed vessel with bottom outlet valve (HWS Labortechnik,
Mainz, Germany) at 45 °C, and after 3 to 6 minutes the obtained ArcGel was freeze-dried.
Hydrolytic Degradation
Investigation of degradation behavior of the ArcGels in aqueous environment was
performed in freshly prepared 1x PBS buffer solution (pH 7.4) at 37 °C in a moving water
bath. Samples were cut in approximately 1.5 cm x 1.5 cm x 1 cm blocks (6 replicas per time
point and composition for 10 weeks) and stored in 50 mL centrifuge tubes loaded with 14 mL
of buffer solution undergoing slight shaking. PBS buffer was exchanged once every week. At
each time point, six samples were removed from the water bath and freeze dried. Mass loss,
water uptake, pore sizes (SEM & μCT) and if possible compressive moduli were determined
6 Scanning Electron Microscopy (SEM)
Lyophilized ArcGels were sputtered with Gold-Palladium (Au 80% - Pd 20%) with a
Polaron SC7640 sputter coater (Quorum Technologies Ltd, Sample preparation division,
Ashford, Kent, UK) and investigated using a SUPRA 40 VP electron microscope with a
Schottky emitter at an acceleration voltage of 3 kV (Carl Zeiss NTS GmbH, Oberkochen,
Germany).
Water uptake (H)
Lyophilized ArcGels (1 cm x 1.5 cm x 0.5 cm) were immersed in water for 24 h, and
water from the pores was removed by carefully blotting from each side with filter paper. The
mass change was used to determine H using equation 1,
H =(Ws-Wd)/Ws x 100 (1)
with W
s and Wd being the weights of the swollen and dry samples, respectively. For each
composition, three replicas were used for the determination of H reported as averagestandard
deviation.
Wide angle X-ray scattering (WAXS)
WAXS measurements were performed with a two-dimensional detecting Bruker D8
Discover X-ray diffraction system from Bruker AXS (Karlsruhe, Germany). X-rays were
generated at operating voltage of 40 kV and working current of 40 mA, producing Cu Kα
-radiation with a wavelength of 0.154 nm.
ArcGels were investigated in transmission geometry with a collimator opening of 0.8 mm at a
sample-to-detector distance of 15 cm. Integration of the two-dimensional scattering pattern
7 Compression tests
Compression tests of the ArcGels were performed on a Zwick Z2.5 (Zwick GmbH,
Ulm, Germany). Specimens were cut in block shapes (1.5 cm x 1.5 cm x 1 cm). Samples were
equilibrated in distilled water for 24 h and compressed with a cross-head speed of 2 mm·min-1
to 50% of the original sample height (performed in triplicate, values reported as
averagestandard deviation).
The macroscopic compression modulus Ec was determined in the elastic regime of the
stress-strain curve (at stress-strains of 0.05-0.25%) using the equation Ec = σ/ε, where σ corresponds to the
force applied per sample area and ε corresponds to the compression distance divided by the
original sample length.
The shape fixity ratio Rf (from compression in the dry state) and shape recovery ratio Rr
(determined from compression in the wet state) have been calculated according to the
equations below.
with h0= initial sample height, hload = height after compression (with load), hfix = height after
compression and removal of load, and hrec= height after elastic recovery.
Micromechanical analysis of pore walls of ArcGels
AFM experiments were performed using a system combining an optical light
microscope (Zeiss Observer Z1, Jena, Germany) to locate the site of indentation and a
MFP-3D-Bio AFM (Atomic Force F&E GmbH, Mannheim, Germany) for performing the
indentation tests using a pyramidal I-Drive / BL-TR 400 PB AFM tip (Atomic Force F&E
GmbH). Sample pieces for the micromechanical analyses were cut to 3 mm x 10 mm x 1 mm
8
Samples were fixed on the bottom of the AFM cell and completely covered with water.
Suitable investigation areas on the sample surface were determined by optical light
microscopy followed by topographic AFM scanning to confirm a flat surface area.
Measurements (500 mV trigger point, 300 – 500 nm max. indentation) were performed within
a 6 x 6 points indentation grid (30 x 30 μm) and performed again for up to 4 additional
locations giving a maximum of 180 data points. The reduced elastic moduli Er were calculated
with Igor Pro AFM evaluation software, using a modified Hertz model (eq. 2) for conical
indenter geometry:
2
) tan(
2
Er
P (2)
where is the half-opening angle of the cone, is the indentation depth, and P is the loading force. Equation 1 was fitted to the force-distance curves (Figure 3 of the main manuscript)
and local Young’s moduli were then calculated from Er using the equation 3:
1 2 2 2 1 2 1 1 1 E E Er (3)
where E1 is the Young’s Modulus of the material and 1 the Poisson ratio of the material,
while E2 and 2 describe properties of the indenter. For the evaluation of the results obtained
for the ArcGel micromechanics, the histograms of relative frequency of the measured local E
moduli showed a bimodal distribution. The reported values for E are averaged from the more
populated (generally lower E modulus) value range. The set of data points with higher moduli
are likely to be systematic errors of the measurements, e.g. the cantilever and not the tip
interacting with the material. For G10_LNCO5, G10_LNCO8, and G13_LNCO8, values with
>40% frequency were found, with the remaining maxima each accounting for <5% of the
total counts. The values measured for G10_LNCO3 varied over a broader range, and the
9
Supporting Table S1. Averaged Young’s moduli determined from individual indentation
experiments. Primary and secondary Young’s moduli, as well as Young’s moduli of
G10_LNCO3 and G10_LNCO8 differ significantly (p < 0.0001).
Composition Primary E [kPa] Contribution Secondary E [kPa]
G10_LNCO3 1252 ± 140 26 % 231 ± 34
G10_LNCO8 56 ± 28 40 % -
hMSC experiments
Bone marrow samples were taken after written consent according to the guidelines
approved by the Ethic Committee on the Use of Human Subjects at the University of Rostock
(approval no. A21/2007). hMSCs were isolated and characterized following the protocol
described in R. Gaebel, D. Furlani, H. Sorg, B. Polchow, J. Frank, K. Bieback, W. Wang, C.
Klopsch, L.L. Ong, W. Li, N. Ma, G. Steinhoff, Cell Origin of Human Mesenchymal Stem
Cells Determines a Different Healing Performance in Cardiac Regeneration. PLoS ONE 6,
e15652 (2011). For proliferation experiments, ArcGels were cut into cubes (edge length of
~5 mm) and seeded with 2x10⁴ hMSCs. hMSCs were stained for the initial cell attachment
with carboxyfluorescein succinimidyl ester (CFSE) and Hoechst 33342, and counter stained
with propidium iodide (PI) for their viability. F-actin organization was examined by ActinRed
555 ReadyProbes (Life technologies). Samples were imaged with a confocal microscope (Carl
Zeiss, LSM 780, Jena, Germany). Images were sampled at a resolution of 1024 by 1024 pixels,
using a 10x objective, a 0.6-4 times software zoom and a z-step size of 2.57 μm with a
pinhole at 1 Airy unit. Maximum intensity projections of Z-stacks were generated by ZEN
2012 software (Carl Zeiss, Jena, Germany). After 9 days, hMSCs were stained with Hoechst
33258, quantified in randomly chosen three dimensional fields (630× magnification) and
10
Jena, Germany). For the osteogenic differentiation experiments, osteogenic supplement was
added to basal medium and applied to hMSCs within the ArcGels (R&D Systems,
Minneapolis, MN, USA). After three weeks, cells were stained for osteocalcin (polyclonal
rabbit anti-osteocalcin, R&D Systems) followed by anti-rabbit Alexa-Fluor 488 (Invitrogen,
Carlsbad, CA, USA) conjugated secondary antibody and counterstained with Hoechst 33258.
For quantification, the percentage of osteocalcin+ cells in three-dimensional fields (630×
magnification) was determined.
Bone grafts harvesting and treatment
The cancellous bone graft was from a 65 year old male donor, who died from cardiac
arrest (kindly provided by the University Tissue Bank, Institute of Transfusion Medicine,
Charité - Universitätsmedizin Berlin). Fat and connective tissue were removed with scalpels
and surgery forceps. Cancellous bone cylinders (2.5 mm diameter, 4 mm height) were
obtained using a bone marrow trephine, and were rinsed under pressure immediately with
prewarmed (37 °C) water to remove adhering material or blood. Bone cylinders were stored at
≤ -70 °C for at least 6 days. After thawing, cancellous bone cylinders were rinsed for 5 min
with sterile distilled water and transferred to an exsiccator containing a mixture of 2 volumes
of chloroform and 1 volume of methanol. The cancellous bone cylinders were covered with
the chloroform/ methanol mixture. After shaking for 2 h at RT, the cancellous bone cylinders
were rinsed eight times with methanol in an ultrasonic bath to remove chloroform, each time
for 15 min, followed by two washing steps with distilled water. Chloroform/methanol
extracted cylinders were dried under a laminar air flow hood and stored at ≤ -18 °C. After
defatting, cancellous bone cylinders were rinsed in sterile distilled water and then treated with
PES (2 volumes of peracetic acid 20 g/l H2O, 1 volume of 96% ethanol and 1 volume of aqua
ad injectionem) for 4 h at RT on a rocking platform. In the production process, the cylinders
11
remove PES. Finally, they were lyophilized and conserved in sterile double bags under sterile
conditions (clean room class 100).
Operative procedure and in vivoexperiments.
The operative procedure has been performed according to M. Mehta, H. Schell, C.
Schwarz, A. Peters, K. Schmidt-Bleek, A. Ellinghaus, et al. Arch. Orthop. Trauma Surg. 2011,
131, 121-9. In brief, female Sprague Dawley rats were administered an intraperitoneal
injection of a solution containing ketamine hydrochloride (60 mg·kg-1, ketamine 50 mg,
Actavis®, Island) and medetomidine (0.3 mg·kg-1, Domitor®, Pfizer, Karlsruhe). The
antibiotic clindamycin-2-dihydrogenphosphate (45 mg·kg-1, Ratiopharm, Ulm) was also
administered subcutaneously. An incision was made across the lateral aspect of the thigh,
through the fascia, exposing the femur by separating the gluteus superficialis and biceps
femoralis muscles. Four threaded titanium pins were manually screwed into the femur after
pre-drilling with a 0.9 mm drill bit resulting in a firm fixation. The external fixator was
attached, allowing a 7.5 mm offset. A 5 mm defect was created in the middle of the femur
using an oscillating saw by performing a double transverse osteotomy, after which time the
fascia and skin were sutured. The analgesic tramadol hydrochloride was administered
subcutaneously during the surgery (20 mg·kg-1, Grünenthal, Aachen) and over 3 days diluted
in the animals’ drinking water (25 mg·L-1, Grünenthal, Aachen). Immediately after surgery,
the rats were allowed to resume normal activity and given unrestricted access to food and
water.
ArcGels (n = 6 per composition) or allogenic bone grafts (n = 5) were implanted into 5
mm (critical-size) mid-diaphyseal femoral defects of 23 female Sprague Dawley rats (weight
at operation, 250 to 300 g). All animal experiments were carried out according to the policies
12
4, and 6 weeks post-operation, radiographs (LX-60,Faxitron Bioptics, Tucson, USA) of the
defect site were taken.
External fixator design
The femoral defects were stabilized by an external unilateral fixator (M. Mehta, H.
Schell, C. Schwarz, A. Peters, K. Schmidt-Bleek, A. Ellinghaus, et al. Arch. Orthop. Trauma
Surg. 2011, 131, 121-9). The fixator included a crossbar of stainless steel (22 mm x 5 mm x 2
mm), set at a 7.5 mm offset, the free length of the pins between the lateral surface of the rat’s
femur and the inner side of the fixator bar. Four titanium threaded (0.65 mm core diameter/1.2
mm outer diameter) pins, spaced 8 mm apart, were held between the two sides of the fixator
bar under compression. Previous in vitro experiments using rat femurs with these external
fixators have shown that with loading in axial direction of the bones, the load-deflection
curves showed a stiffness of 50 N·mm-1.
In vitro Micro-Computed Tomography for mineralized tissue formation and density
At 6 weeks post-operation, bone healing was assessed by microcomputed tomography
(vivaCT 40, Scanco Medical, 70 kV, 114 µA) at an isotropic resolution of 10.5 μm. For each
femora, the volume of interest was located in the periosteal and endosteal callus, excluding
the cortical bone. The volume of interest (VOI) included the 5 mm defect region and 0.5 mm
in the proximal and distal directions from the borders of the original osteotomy. A global
threshold of 50% of the tissue mineral density from the contralateral femur, equivalent to 353
mg hydroxyapatite per cm3 was used to distinguish mineralized tissue (bone and calcified
cartilage) from poorly mineralized and unmineralized tissue. Bone healing parameters
included mineralized callus volume (BV), total callus volume (TV), mineralized callus
volume fraction (BV/TV), tissue mineral density (TMD) and tissue mineral content (TMC),
13
threshold. Also, two voxels were removed from all bone surfaces prior to computing TMD in
order to reduce partial volume effects. Calculation of TMD and TMC was made possible by
density calibration data obtained from scans of a hydroxyapatite phantom provided by the