White Rose Research Online URL for this paper: http://eprints.whiterose.ac.uk/84181/
Version: Accepted Version
Article:
Killan, CF, Killan, EC and Raine, CH (2015) Changes in children's speech discrimination and spatial release from masking between 2 and 4 years after sequential cochlear implantation. Cochlear Implants International, 16 (5). pp. 270-276. ISSN 1467-0100
https://doi.org/10.1179/1754762815Y.0000000001
Reuse
Unless indicated otherwise, fulltext items are protected by copyright with all rights reserved. The copyright exception in section 29 of the Copyright, Designs and Patents Act 1988 allows the making of a single copy solely for the purpose of non-commercial research or private study within the limits of fair dealing. The publisher or other rights-holder may allow further reproduction and re-use of this version - refer to the White Rose Research Online record for this item. Where records identify the publisher as the copyright holder, users can verify any specific terms of use on the publisher’s website.
Takedown
If you consider content in White Rose Research Online to be in breach of UK law, please notify us by
Changes in children’s speech discrimination and spatial release from masking between 1
two and four years after sequential cochlear implantation 2
3
Catherine F Killana, Edward C Killanband Christopher H Rainea
4
5
a
Yorkshire Auditory Implant Service, Bradford Royal Infirmary, UK
6
b
Faculty of Medicine and Health, University of Leeds, UK
7
8
9
Correspondence to: Catherine Killan, Yorkshire Auditory Implant Service, Listening for Life
10
Centre, Bradford Royal Infirmary, Duckworth Lane, Bradford, West Yorkshire, BD9 6RJ,
11
UK.
12
Tel: +44 0 1274 364853
13
Email: [email protected]
14
15
No conflicts of interest to declare.
16
17
Funding: The Ear Trust, Registered Charity No. 1000929
18
19
Acknowledgement: We thank Nicola Royle for her contribution to spatial listening
20
assessment at the Yorkshire Auditory Implant Service.
ABSTRACT
23
24
Objective: To document changes in speech reception thresholds (SRTs) and spatial release
25
from masking (SRM) for sequentially implanted children at two and four years after they
26
received their second cochlear implant (CI2). 27
Methods: Participants were 17 children who consistently used two sequentially implanted and
28
optimally programmed cochlear implants. SRTs were measured monaurally in quiet and
29
binaurally in noise using the adaptive McCormick Toy Discrimination Test. Speech signals
30
were presented from 0° azimuth and noise from 0°, +90° or −90° azimuth. SRM was 31
calculated from SRTs in noise. Measurements were made at two and four years post-CI2. 32
Results: There were significant improvements over time in SRTs in quiet, SRTs in noise and
33
SRM. SRTs in quiet improved more for CI2than for the first implant (CI1). SRTs in noise and 34
SRM improved more when noise was presented closest to CI1 than when closest to CI2. 35
Performance became more symmetrical over time.
36
Discussion: Despite prolonged periods of unilateral auditory deprivation
sequentially-37
implanted children exhibited continued improvement in SRT and SRM. These results are
38
valuable in setting expectations for and counselling families of children considering
39
sequential cochlear implants.
40
41
Keywords: Cochlear Implants; Bilateral; Spatial Release from Masking; Speech
42
Discrimination; Sequential; Speech Reception Thresholds; Speech Intelligibility
43
INTRODUCTION
45
46
One advantage of binaural hearing is an increased ability to discriminate speech from
47
background noise due to spatial release from masking (SRM). SRM refers to the
48
improvement in speech discrimination obtained when speech and noise signals are spatially
49
separated, and has been attributed to the head-shadow effect and binaural processing (e.g.
50
Hawleyet al., 2004; Akeroyd, 2006). One aim of bilateral cochlear implantation in children
51
is to realize this benefit for profoundly deaf children. Bilateral cochlear implantation can be
52
performed simultaneously but is often performed sequentially (i.e. implantation occurs one
53
ear at a time, with the second implant, CI2, being implanted some time, often years, following 54
the first, CI1). As a result, sequentially-implanted children may experience prolonged and 55
asymmetrical auditory deprivation compared to normally-hearing children, children who use
56
bilateral hearing aids and children who undergo simultaneous cochlear implantation. As a
57
consequence, the development of binaural listening skills for sequentially-implanted children
58
is more likely to be limited by changes in plasticity in the maturing auditory system (Sharma
59
et al., 2007; Greenet al., 2011; Gordonet al., 2013; Sparreboom, 2013).
60
61
Several studies have described changes in speech discrimination for sequentially-implanted
62
children as a function of time up to two years post-CI2(Peterset al., 2007; Sparreboomet al., 63
2011; Strom-Roum et al., 2012). In general, these studies show improvements in monaural
64
and binaural speech reception thresholds (SRTs) in quiet and noise. Further, whilst children
65
tend to perform better when listening via CI1 alone compared to via CI2 alone, the greatest 66
improvements over time are seen for children listening via CI2. To date, longitudinal data 67
describing speech discrimination over a time period longer than two years post-CI2 have not 68
been reported in the literature. Even less is known regarding the development over time of
SRM for sequentially implanted children. A number of studies have shown that sequentially
70
implanted children display asymmetrical SRM, i.e. greater SRM is available when the noise
71
signal is closer to CI2compared to CI1(Litovskyet al., 2006; Van-Deunet al., 2010; Chadha 72
et al., 2011). The durations of bilateral implant use in these studies vary from three months to
73
five years, however no single study has reported changes in SRM over time for the same
74
children.
75
76
Given the potential influence of auditory system plasticity, it is not straight-forward to predict
77
the development trajectory of speech discrimination and SRM of sequentially-implanted
78
children based on data obtained during the first two years post-CI2. Knowledge of longer 79
term outcomes would inform clinicians’ management decisions for children with an existing
80
single cochlear implant, as well as provide realistic expectations for families of such children.
81
Therefore, this paper presents data from a small scale study conducted at our clinical centre
82
that describes monaural SRTs in quiet, binaural SRTs in noise and SRM outcomes for
83
sequentially implanted children at two and four years post-CI2. 84
METHODS
86
87
Data were collected from 17 (eight male, nine female) children who had received sequential
88
cochlear implants at our clinical service. For inclusion in this study we identified children
89
who were over four years of age, developmentally able to participate and consistent users of
90
both CI1and CI2. We included only children with monaural aided thresholds of 35 dB HL or 91
better at 0.25, 0.5, 1, 2, 4 and 6 kHz bilaterally. Data were collected for each child at two and
92
four years post-CI2 as part of their routine clinical management. Details regarding each 93
participating child are given in Table 1. The age range of children at two years post-CI2was 94
62 to 156 months (median = 119 months) and at 4 years post-CI2 was 85 to 182 months 95
(median = 142 months). The time between CI1and CI2ranged from 19 to 95 months (median 96
= 49 months). Based on information available in their medical records including audiological
97
test results, correspondence and parental reports children were assumed to have congenital
98
profound sensori-neural hearing loss. A number of children were notably older than others at
99
CI1(i.e. ID 16, 17, 18, 19, 22 and 24) due to a range of non-audiological factors (e.g. repeated 100
non-attendance at consultations, professional concern regarding family support). Table 1 also
101
shows the internal implants, external speech processors and processing strategies used by
102
each child in each ear at both test intervals. For the majority of participants these remained
103
constant across the time interval. However, two participants (ID 5 and 8) with devices by
104
Cochlear (Sydney, New South Wales, Australia) had changed from using FreedomTM to
105
CP810TM speech processors between assessments and one other participant (ID19) with
106
devices by MED-EL (Innsbruck, Austria) had changed speech processing strategy from
107
HDCISTM to FSPTM in one ear. Changes in speech processor hardware and processing
108
strategy can influence speech discrimination (e.g. Kleine Punte et al., 2014, Mosnier et al.,
109
2014.). However, the changes for these three children are considered to be relatively minor
and as such will account for only small changes in speech discrimination performance. The
111
effects of the other characteristics noted in Table 1 are effectively controlled for by the
112
longitudinal design of this study.
113
114
Measurement of SRT in quiet and noise was achieved using the IHR Automated McCormick
115
Toy Discrimination Test (Summerfield et al., 1994) presented via the York Crescent of
116
Sound (Kitterick et al., 2011). The York Crescent of Sound consists of nine Canton Plus
117
XS.2 loudspeakers (Niederlauken, Germany), each at a height of 1.1 metre, arranged in a
118
horizontal semi-circle of radius 1.45 metres from +90º (90 º to the right of the child) to −90º 119
azimuth (90º to the left of the child). Presentation of speech and noise signals was controlled
120
via system software and routed to the loudspeakers via a MOTU UltraLite Mk3 (Cambridge,
121
USA) audio interface and Alesis RA-150 dual-channel amplifiers (Cumberland, USA).
122
123
Speech signals were recorded by Summerfield et al. (1994) using a female voice. They
124
consisted of the introductory phrase “Point to the” followed by the name of one of 10 to 14
125
toys (phonemically paired e.g. “key” and “tree”) selected at random by system software. The
126
introductory phrase component of the speech signal had duration of 500 ms. The noise signal
127
was a burst of broadband (pink) noise with duration of 1400 ms (linear rise-fall = 200 ms;
128
steady-state = 1000 ms). The noise signal was presented 300 ms following the onset of the
129
speech signal so that it was at steady-state for the duration of the toy name component of the
130
speech signal.
131
132
All testing took place in a sound-attenuated room with the child seated so that their head was
133
an equal distance from all loudspeakers. Children were asked to select which toy name they
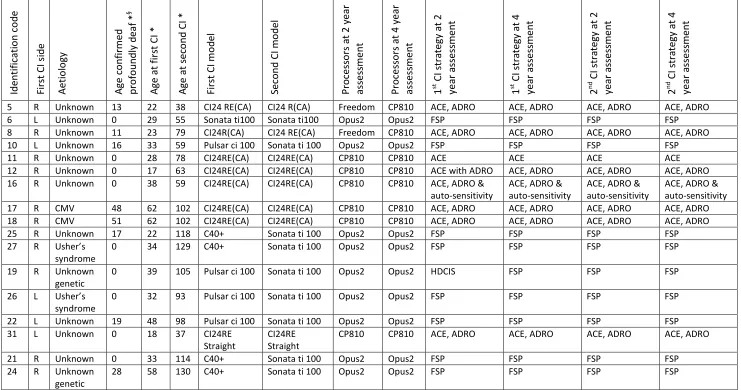
Table 1 Participants’ characteristics 135 Id e n ti fi ca ti o n co d e F ir st C I si d e A e ti o lo g y A g e co n fi rm e d p ro fo u n d ly d e a f * § A g e a t fi rs t C I * A g e a t se co n d C I * F ir st C I m o d e l S e co n d C I m o d e l P ro ce ss o rs a t 2 y e a r a ss e ss m e n t P ro ce ss o rs a t 4 y e a r a ss e ss m e n t 1 st C I st ra te g y a t 2 y e a r a ss e ss m e n t 1 st C I st ra te g y a t 4 y e a r a ss e ss m e n t 2 n d C I st ra te g y a t 2 y e a r a ss e ss m e n t 2 n d C I st ra te g y a t 4 y e a r a ss e ss m e n t
5 R Unknown 13 22 38 CI24 RE(CA) CI24 R(CA) Freedom CP810 ACE, ADRO ACE, ADRO ACE, ADRO ACE, ADRO
6 L Unknown 0 29 55 Sonata ti100 Sonata ti100 Opus2 Opus2 FSP FSP FSP FSP
8 R Unknown 11 23 79 CI24R(CA) CI24 RE(CA) Freedom CP810 ACE, ADRO ACE, ADRO ACE, ADRO ACE, ADRO
10 L Unknown 16 33 59 Pulsar ci 100 Sonata ti 100 Opus2 Opus2 FSP FSP FSP FSP
11 R Unknown 0 28 78 CI24RE(CA) CI24RE(CA) CP810 CP810 ACE ACE ACE ACE
12 R Unknown 0 17 63 CI24RE(CA) CI24RE(CA) CP810 CP810 ACE with ADRO ACE, ADRO ACE, ADRO ACE, ADRO 16 R Unknown 0 38 59 CI24RE(CA) CI24RE(CA) CP810 CP810 ACE, ADRO &
auto-sensitivity
ACE, ADRO & auto-sensitivity
ACE, ADRO & auto-sensitivity
ACE, ADRO & auto-sensitivity 17 R CMV 48 62 102 CI24RE(CA) CI24RE(CA) CP810 CP810 ACE, ADRO ACE, ADRO ACE, ADRO ACE, ADRO 18 R CMV 51 62 102 CI24RE(CA) CI24RE(CA) CP810 CP810 ACE, ADRO ACE, ADRO ACE, ADRO ACE, ADRO
25 R Unknown 17 22 118 C40+ Sonata ti 100 Opus2 Opus2 FSP FSP FSP FSP
27 R Usher’s syndrome
0 34 129 C40+ Sonata ti 100 Opus2 Opus2 FSP FSP FSP FSP
19 R Unknown genetic
0 39 105 Pulsar ci 100 Sonata ti 100 Opus2 Opus2 HDCIS FSP FSP FSP
26 L Usher’s syndrome
0 32 93 Pulsar ci 100 Sonata ti 100 Opus2 Opus2 FSP FSP FSP FSP
22 L Unknown 19 48 98 Pulsar ci 100 Sonata ti 100 Opus2 Opus2 FSP FSP FSP FSP
31 L Unknown 0 18 37 CI24RE Straight
CI24RE Straight
CP810 CP810 ACE, ADRO ACE, ADRO ACE, ADRO ACE, ADRO
21 R Unknown 0 33 114 C40+ Sonata ti 100 Opus2 Opus2 FSP FSP FSP FSP
24 R Unknown genetic
28 58 130 C40+ Sonata ti 100 Opus2 Opus2 FSP FSP FSP FSP
*Ages given in months.§Where profound loss confirmed on immediate follow-up after failing neonatal hearing screen, age of diagnosis given as
136
0 months. Profound deafness defined as an unaided loss of 90 dB HL or worse at 2 kHz and 4 kHz bilaterally.
heard by pointing to a toy on a table in front of them, or selecting an image of the toy on a
138
touch-screen.
139
140
Monaural SRTs in quiet were assessed first. Speech signals were presented from 0° azimuth
141
at an initial level of 45 – 55 dB SPL whilst only one cochlear implant was activated. To
142
encourage compliance with testing, the children were allowed to choose which speech
143
processor to remove first. A one-down, one-up adaptive procedure with step sizes of 6 dB
144
was used for the first two reversals, followed by six reversals using a two-down, one-up
145
adaptive procedure with step sizes of 3 dB. The last six reversals were used to estimate SRT.
146
The task was then repeated to measure SRT with only the other cochlear implant activated.
147
148
Binaural SRTs in noise were assessed next. First the speech signal and noise were presented
149
from 0° azimuth (S0N0) to ensure that one standard outcome of listening in noise was 150
obtained for each child should they withdraw co-operation before the end of the test session.
151
Subsequently the speech signal remained at 0° azimuth and the noise was presented from
152
−90° or +90° azimuth. Both −90° and +90° azimuth result in noise being closest to either CI1 153
or CI2. This is indicated within this paper by referring to these noise conditions as S0NCI1and 154
S0NCI2 respectively. The speech signal was fixed at 60 dB(A) SPL and the noise signal 155
varied from an initial level of 30 to 38 dB SPL using an adaptive procedure. The first two
156
reversals followed a one-down one-up procedure with step sizes of 6 dB. Six further
157
reversals using a two-down one-up procedure with step sizes of 3 dB were used to establish
158
SRT in noise, expressed as a signal to noise ratio (SNR). If the noise reached a maximum
159
level of 60 dB SPL, i.e. a SNR of 0 dB, the speech signal was presented at adaptively quieter
160
levels in order to adjust the SNR.
SRM was calculated for each participant by subtracting their SRT in noise for S0NCI1 and 163
S0NCI2 from their SRT for S0N0. This resulted in two SRM measurements for each 164
participant, i.e. SRM with noise located at CI1(SRMCI1) and noise located at CI2(SRMCI2). 165
166
Statistical analysis was performed using two-level regression modelling (e.g. Goldstein,
167
2011; Snijders and Bosker, 2011) with the levels of the model being measurement
(within-168
participant) and participant (between-participant). For each dependent variable (SRT in
169
quiet, SRT in noise and SRM) a series of models were used to explore the effect of
170
explanatory variables (i.e. time post-CI2, implanted ear and noise location). An advantage of 171
these models is their ability to incorporate the clustering of data inherent in repeated
172
measures experimental designs, and avoid violating the assumption of independence of data
173
that underpins single-level regression methods. Models were estimated by the maximum
174
likelihood method via an iterative generalised least squares procedure (e.g. Goldstein, 1986).
175
This allowed an estimate of model deviance to be made. The difference between the
176
deviance of two models (that differ simply by the addition of explanatory variables) can be
177
used as a test statistic to determine the effect of the explanatory variables on the dependent
178
variable. This deviance statistic has a 2 distribution with degrees of freedom equal to the
179
difference in number of variables included in the two models. In addition, regression
180
coefficients can be tested for significance via the Wald test (see Snijders and Bosker, 2011).
RESULTS
182
183
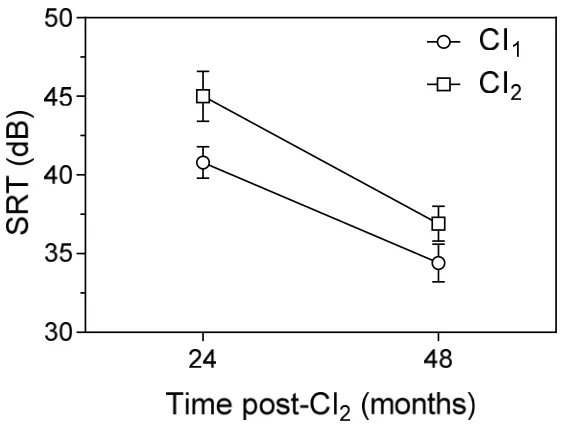
Figure 1 shows the mean (n = 17) monaural SRTs measured in quiet for CI1 and CI2 ears 184
(circles and squares respectively) at two and four years post-CI2. A number of trends are 185
clearly evident within the figure. CI1ears had lower mean SRT (i.e. better performance) than 186
CI2 ears at two years post-CI2. In addition, SRT for both ears reduced (i.e. improved) as a 187
function of time post-CI2. These observations were confirmed by two-level regression 188
modelling. Both the inclusion of ear ( 2 = 5.46, df = 1, p < 0.05) and time post-CI2 ( 2 = 189
37.84,df= 1,p< 0.0001) caused significant reductions in model deviance. Inspection of the
190
figure also suggests that the improvement in SRT over time was dependent on ear, with a
191
greater change seen for CI2 ears (8.1 dB) compared to the CI1 ears (6.4 dB). However, after 192
four years post-CI2, CI1 ears still had lower mean SRT than CI2 ears. Statistical modelling 193
including the interaction between ear and time post-second implant showed the difference in
194
SRT improvement over time to be non-significant ( 2= 0.76,df= 1,p= 0.39).1
195
1 For this and all subsequent models reported here, greatest variation was seen at the
196
Figure 1 Mean monaural SRT in quiet for CI1 (circles) and CI2 (squares) ears as a 197
function of time post-CI2. Error bars represent ± 1 standard error of the mean (SEM). 198
199
One participant (ID5) had incomplete SRT in noise data and was therefore not included in
200
subsequent analysis. The mean (n= 16) binaural SRTs measured in noise (expressed as SNR
201
in dB) at two and four years post-CI2 are shown in Figure 2. The figure shows the SNRs 202
obtained for the three locations of noise: S0N0 (circles), S0NCI1 (squares) and S0NCI2 203
(triangles). At two and four years post-CI2, lowest mean SNRs (i.e. better performance) were 204
measured at S0NCI2with highest SNRs measured at S0N0. For all three noise locations SNRs 205
reduced (i.e. improved) as a function of time post-CI2. The largest improvement was seen at 206
S0NCI1 (7.2 dB) followed by S0NCI2 (5.7 dB), with a smaller improvement (2.7 dB) seen at 207
S0N0. As a result, mean SRT in noise at S0NCI1was most similar to that obtained at S0N0at 208
two years but was closest to S0NCI2 at four years. These observations are confirmed by the 209
results of statistical modelling. Both noise location ( 2= 25.91, df= 2,p< 0.0001) and time
210
post-CI2 ( 2 = 51.30, df = 1, p < 0.0001) caused highly significant reductions in model 211
significant ( 2 = 10.05, df = 2, p < 0.01) confirming the difference in improvements seen
213
across the three conditions. The model also confirms the convergence of SRT in noise for
214
S0NCI1 and S0NCI2 as a result of the greater improvement seen for S0NCI1. Whilst SRT at 215
S0NCI1and S0NCI2were significantly different at two years post-CI2(t = 3.27,p < 0.001), the 216
difference was not significant at four years post-CI2(t= 1.81,p= 0.04).2 217
[image:13.595.137.430.231.441.2]218
Figure 2 Mean binaural SRT in noise measured for S0N0 (circles), S0NCI1 (squares) 219
and S0NCI2 (triangles) as a function of time post-CI2. Error bars represent ± 1 SEM. 220
221
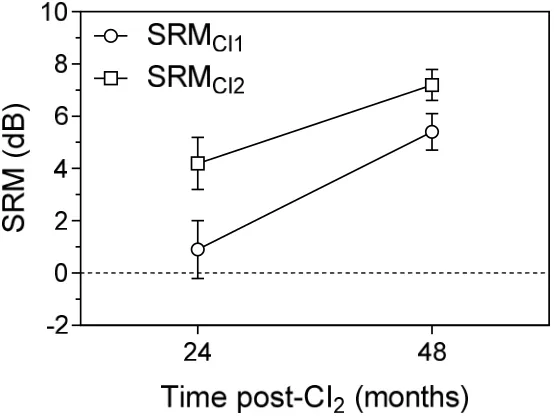
Finally, Figure 3 shows the mean (n = 16) SRM values obtained as a function of time
post-222
CI2. SRM values are shown for both noise locations, i.e. SRMCI1and SRMCI2. A clear trend 223
for both SRMCI1and SRMCI2to increase (improve) as a function of time post-CI2 is evident. 224
In addition, a notable difference exists between SRMCI1 and SRMCI2, with SRMCI2 having 225
larger values (i.e. more advantage) than SRMCI1 at two and four years. However, this 226
difference becomes smaller as a function of time post-CI2from 3.3 dB at two years to 1.8 dB 227
SRM across ears is observed to become more symmetrical over time. Statistical modelling
229
confirmed both noise location ( 2= 6.34,df= 1,p< 0.05) and time post-CI2( 2= 17.00,df= 230
1,p < 0.0001) had a significant effect on SRM. The interaction between noise location and
231
time was not significant ( 2 = 0.73, df = 1, p = 0.39), indicating that the time-dependent
232
improvements in SRMCI1and SRMCI2were not significantly different. 233
[image:14.595.147.424.227.437.2]234
Figure 3 Mean SRMCI1 (circles) and SRMCI2 (squares) as a function of time post-CI2. 235
Error bars represent ± 1 SEM. 236
DISCUSSION
238
239
To date, no longitudinal data have been reported that describe changes in SRM over time for
240
sequentially-implanted children. Previous investigators (Peters et al., 2007, Sparreboom et 241
al., 2011 and Strom-Roum et al., 2012) have described longitudinal changes in speech
242
discrimination abilities for this group of children, but these are limited to the first two years
243
post-CI2. The small scale longitudinal study described in this paper is the first to provide a 244
description of changes in speech discrimination in quiet and noise as well as SRM for
245
sequentially-implanted children at four years post-CI2. 246
247
Our findings demonstrate that the trajectory of improvement in speech discrimination
248
performance previously reported for up to two years post-CI2 (Peters et al., 2007; 249
Sparreboomet al., 2011; Strom-Roumet al., 2012) continues during the next two years. That
250
is, SRT in both quiet and noise continue to improve for both CI1 and CI2. Whilst better 251
performance is seen for CI1, CI2 shows the greatest improvement over time. This results in 252
more symmetrical performance across ears.
253
254
Similar findings were also obtained for SRM. Whilst our mean values measured at two years
255
post-CI2 were similar to those reported at the same time point by Litovskyet al. (2006) and 256
Sparreboomet al. (2011), substantial improvements in SRM for noise presented 90° towards
257
CI1 and CI2 were observed at four years post-CI2. The present data also shows that the 258
notable asymmetry in SRM evident at two years post-CI2(Litovskyet al, 2006; Van-Deun et 259
al, 2010; Chadha et al, 2011) becomes less marked by four years post-CI2. However, this 260
group of sequentially-implanted children did not gain the same symmetrical SRM reported
263
In summary, the present findings show that sequentially-implanted children who are
264
consistent users of two cochlear implants that provide access to sounds at 35 dB HL or better
265
bilaterally continue to experience substantial improvements in discriminating speech in noise
266
up to four years post-CI2, despite the extended period of auditory deprivation in their second-267
implanted ear. These findings, along with other evidence (e.g. Smulderset al., 2011) support
268
the recommendation that children with an existing single implant should be considered for
269
assessment for a second implant. As a tentative indication of the window of opportunity for
270
providing a second implant, children in this study who had used a single cochlear implant for
271
up to 95 months before receiving a second implant still experienced significant improvement
272
in speech discrimination abilities.
273
274
The increased knowledge of the development of speech discrimination provided by this paper
275
is useful when counselling families of children considering sequential implantation. As part
276
of managing expectations families can be made aware of the long time-scale over which
277
benefits may be obtained. Similarly, some children who have already received a second,
278
sequential implant struggle to establish consistent use of both devices (Galvin and Hughes,
279
2012; Fitzgeraldet al., 2013). For these families the knowledge that these improvements can
280
continue beyond two years post-CI2 may serve as motivation to persevere with using the 281
second cochlear implant and the associated rehabilitation.
282
283
Finally, in order to determine the trajectory of any further changes in speech discrimination
284
beyond four years post-CI2, it is recommended that further studies are undertaken with the 285
aim of measuring speech discrimination performance at longer intervals post-CI2. 286
REFERENCES
288
289
Akeroyd M.A. 2006. The psychoacoustics of binaural hearing. International Journal of 290
Audiology, 45(Supplement 1): S25-S33.
291
292
Chadha N.K., Papsin B.C., Jiwani S., Gordon K.A. 2011. Speech detection in noise and
293
spatial unmasking in children with simultaneous versus sequential bilateral cochlear implants.
294
Otology & Neurology, 32: 1057-1064.
295
296
Fitzgerald M.B., Green J.E., Fang Y., Waltzman S.B. 2013. Factors influencing consistent
297
device use in pediatric recipients of bilateral cochlear implants. Cochlear Implants 298
International,14(5): 257-265.
299
300
Galvin K.L., Hughes K.C. 2012. Adapting to bilateral cochlear implants: Early post-operative
301
device use by children receiving sequential or simultaneous implants at or before 3.5 years.
302
Cochlear Implants International,13(2): 105-112.
303
304
Goldstein, H. 1986. Multilevel mixed linear-model analysis using iterative generalized
least-305
sqaures.Biometrika73, 43-56.
306
307
Goldstein, H. 2011. Multilevel statistical models. Chichester: Wiley.
308
309
Gordon K.A., Wong D.D.E., Papsin B.C. 2013. Bilateral input protects the cortex from
310
unilaterally-driven reorganization in children who are deaf.Brain,136; 1609-1625.
Green K.M.J., Julyan P.J., Hastings D.L., Ramsden R.T. 2011. Cortical activations in
313
sequential bilateral cochlear implant users.Cochlear Implants International, 12(1): 3-9.
314
315
Hawley M.L., Litovsky R.Y., Culling J.F. 2004. The benefit of binaural hearing in a cocktail
316
party: Effect of location and type of interferer. Journal of the Acoustical Society of America,
317
115(2): 833-843.
318
319
Kitterick P.T., Lovett R.E.S., Goman A.M., Summerfield A.Q. 2011. The AB-York crescent
320
of sound: An apparatus for assessing spatial-listening skills in children and adults. Cochlear 321
Implants International,12(3): 164-169.
322
323
Kleine Punte A., De Bodt M., Van de Heyning P. 2014. Long-Term improvement of speech
324
perception with the fine structure processing coding strategy in cochlear implants.
325
Otorhinolaryngology, 76: 36-43.
326
327
Litovsky R.Y., Johnstone P.M., Godar S.P. 2006. Benefits of bilateral cochlear implants
328
and/or hearing aids in children.International Journal of Audiology; 45(Suppl 1), S78-S91.
329
330
Mosnier I., Marx M., Venail F., Loundon N., Roux-Vaillard S., Sterkers O. 2014. Benefits
331
from upgrade to the CP810TM sound processor for Nucleus® 24 cochlear implant recipients.
332
European Archives of Otorhinolaryngology, 271: 49-57.
333
334
Peters B.R., Litovsky R., Parkinson A., Lake J. 2007. Importance of age and postimplantation
335
experience on speech perception measures in children with sequential bilateral cochlear
336
implants.Otology & Neurotology,28: 649-657.
338
Sharma A., Gilley P.M., Martin K., Roland P., Bauer P., Dorman M. 2007. Simultaneous
339
versus sequential bilateral implantation in young children: Effects on central auditory system
340
development and plasticity.Audiological Medicine, 5: 218-223.
341
342
Smulders Y.E., MD; Rinia A.B., Maroeska M.D., Rovers M., van Zanten G.A., Grolman W.
343
2011. What is the effect of time between sequential cochlear implantations on hearing in
344
adults and children? A systematic review of the literature. The Laryngoscope, 121:1942–
345
1949.
346
347
Snijders, T.A.A., Bosker, R.J. 2011. Multilevel analysis: An introduction to basic and
348
advanced multilevel modeling. London: Sage Publications Limited.
349
350
Sparreboom M., Snik A.F.M., Mylanus E.A.M. 2011. Sequential bilateral cochlear
351
implantation in children: Development of the primary auditory abilities of bilateral
352
stimulation.Audiology & Neurotology, 16: 203-213.
353
354
Sparreboom M., Beynon A.J., Snik A.F.M., Mylanus E.A.M. 2013. Auditory cortical
355
maturation in children with sequential bilateral cochlear implants. Otology & Neurotology, 356
35: 35-42.
357
358
Strom-Roum H., Laurent C., Wie O.B. 2012. Comparison of bilateral and unilateral cochlear
359
implants in children with sequential surgery. International Journal of Pediatric 360
Otorhinolaryngology, 76: 95-99.
Summerfield Q., Palmer A., Foster J., Marshall D., Twomey T. 1994. Clinical evaluation and
363
test-retest reliability of the IHR-McCormick automated toy discrimination test. British 364
Journal of Audiology,28(3): 165-179.
365
366
Van-Deun L., van Wieringen A., Wouters J. 2010. Spatial speech perception benefits in
367
young children with normal hearing and cochlear implants.Ear & Hearing,31: 702-713.
368