This is a repository copy of
Locating Small Cells Using Geo-located UE Measurement
Reports & RF Fingerprinting
.
White Rose Research Online URL for this paper:
http://eprints.whiterose.ac.uk/84536/
Version: Accepted Version
Proceedings Paper:
Joyce, R and Zhang, LX (2015) Locating Small Cells Using Geo-located UE Measurement
Reports & RF Fingerprinting. In: 2015 IEEE International Conference on Communications
(ICC). IEEE International Conference on Communication, 08-12 Jun 2015, London, UK..
IEEE , pp. 3275-3280. ISBN 978-1-4673-6431-7
https://doi.org/10.1109/ICC.2015.7248829
© 2015, IEEE. This is an author produced version of a paper published in 2015 IEEE
International Conference on Communications (ICC). Uploaded in accordance with the
publisher's self-archiving policy.
[email protected] https://eprints.whiterose.ac.uk/
Reuse
Items deposited in White Rose Research Online are protected by copyright, with all rights reserved unless indicated otherwise. They may be downloaded and/or printed for private study, or other acts as permitted by national copyright laws. The publisher or other rights holders may allow further reproduction and re-use of the full text version. This is indicated by the licence information on the White Rose Research Online record for the item.
Takedown
If you consider content in White Rose Research Online to be in breach of UK law, please notify us by
Locating Small Cells Using Geo-located UE
Measurement Reports & RF Fingerprinting
Robert Joyce
University of LeedsLeeds, UK [email protected]
Li Zhang
University of LeedsLeeds, UK [email protected]
Abstract—This paper proposes a number of methods to determine potential small cell site locations using geo-located UE measurement reports in order to maximise the traffic offload from the macrocell network onto the small cells. The paper also shows how the information contained within the measurement
reports can be used to create “RF fingerprints” which in turn can be used to discard UE measurement reports with erroneous location information and by doing so increase the effectiveness of the small cell placement algorithm. Simulations are presented which suggest that when addressing traffic hotspots in central London using small cells with coverage radii of 50m and 100m, the gains provided by the placement algorithms using simple RF fingerprinting technique are significant for UE reports with large location errors (>100m RMS error) when compared to techniques not using RF fingerprinting.
I.INTRODUCTION
Mobile broadband data traffic is rapidly expanding across the globe as more and more users adopt feature phones, smart phones, connected laptops and tablets [1]. Not only are more users adopting these devices each month, but each month the users that already have adopted these devices consume increasing amounts of data [2]. To cope with this so called
“data tsunami” Mobile Network Operators (MNOs) are having
to rapidly increase the capacity of their cellular networks through the costly acquisition of more radio spectrum, through the use of more spectrally efficient radio access technologies such as fourth generation networks based on Long Term Evolution (4G/LTE) radio technology and through the deployment of more, and increasingly smaller, radio cell sites within their networks. This deployment of a layer of small cells under an existing macrocell layer will create a multi-layer network of varying cell sizes often called a Heterogeneous Network or “HetNet” for short. Given the number of small cells expected to be deployed [3] and the typical locations at which they are expected to be installed (dense urban areas, retail parks, shopping malls etc.) then small cell Base Transceiver Stations (BTSs) will have a much smaller physical size and in most cases a lower transmit power than their macrocell equivalents. For this reason the cell range of a small cell will be much smaller than that of a macrocell and therefore precisely where to deploy these small cells in order to capture enough traffic to make them cost effective is a key challenge facing many MNOs.
This paper shows that it is possible to determine small cell locations chosen from a limited set of potential locations (in this case existing central London lampposts) to maximise the traffic offload from the macrocell network using geo-located User Equipment (UE) measurement reports. The paper also shows how the Radio Frequency (RF) information contained within these measurement reports can be used to create “RF fingerprints” to discard UE measurement reports with erroneous location information and by doing so increase the effectiveness of the small cell placement algorithms based upon these location reports.
II.REVIEW OF PREVIOUS SMALL CELL PLACEMENT WORK
There have been many studies into methods of finding the most optimal location for both macrocells and microcells in cellular networks, however many references reviewed assume that a cell site can be placed anywhere and do not approach the problem given a limited set of potential small cell locations as considered here. Nor do any of the references found use a geo-located UE measurement based approach to create a traffic/user distribution on which to base the cell placement decisions.
In terms of macrocell placement there is a wealth of references on this matter, with all references worthy of note approaching the placement problem by assuming there is already a perfect pre-defined (albeit granular in some cases) traffic distribution map on which to base the placement decision, few if any specify how such a map could be generated. For example, in both [4,5] a divide and conquer approach is proposed which calculates optimum macro site placement across the whole network, but with no reference to available infrastructure or indeed existing cell sites. In [6] the existing cell sites are taken into consideration, however the placement of additional cells into the network is to improve coverage rather than improve capacity and the granularity of the traffic map is only suitable for macrocell placement. Finally [7] presents an example of a heuristic techniques (in this case simulated annealing) to select the optimum set of existing 2G/GSM cell sites on which to co-located 3G/WCDMA cells but the reference only considers macrocell placement.
small cells. In [9] heuristic techniques are this time proposed for the placement of small cells under a macrocell layer and the effectiveness of these techniques is modelled on a real network in a large European city but once again the technique is used to find only ideal locations rather than choose from existing available locations.
In summary, to date there appears to have been very little work undertaken considering the use of geo-located UE measurement reports to place small cells. Whilst some reference have addressed optimal placement, none have considered the problem of small cell placement on an existing set of fixed street furniture locations.
III.GEO-LOCATION OF UEMEASUREMENT REPORTS
The UE in a 2G, 3G or 4G cellular network regularly sends measurement reports relating to for example, the signal strength or quality of the serving and neighbour cells back to the network in order that the network can instruct the UE to reselect to a nearby cell with better coverage, an alternative carrier frequency, or a different radio access technology. Up until and including Release 9 (Rel. 9) of the 3GPP standard, UE measurement reports did not contain any information regarding the exact location of the UE. Given that all UEs within the network at some point are sending measurement reports back to the network, the opportunity to use these measurements to build up an exact picture of the actual coverage and performance of the network in real time is very appealing to network operators. Therefore a number of techniques have been proposed to augment the received UE measurements with geo-location data in order to build up a picture or what is termed here an Xmap (a map of processed geo-located measurements) in order to allow network operators to visualise the coverage and performance of their networks.
The most widely used techniques for geo-location of measurements for the Universal Mobile Telecommunications System (3G/UMTS) prior to the introduction of the Minimisation of Drive Test (MDT) feature [10] introduced in 3GPP Rel. 10 were proprietary techniques proposed by a number of vendors [11,12] which used network probes deployed typically on the Iub, Iur, Iu-cs and Iu-ps interfaces of the 3G network to collect network data. Data collected by these probes was then triangulated using proprietary methods typically based on Time of Arrival (TOA) techniques [13] to produce geo-locations for the measurements collected. These proprietary solutions then use the geo-located data to perform network analysis and recommend network changes in order to improve network quality.
In 3GPP Rel. 10 however the MDT feature was introduced for both 3G/UMTS and 4G/LTE in order to standardise the geo-location of UE measurement reports and is a mandatory feature in the UE from 3GPP Rel. 10 onwards. The main aims of MDT were to add the ability of the UE to include geo-location data in its measurement reports and to allow the UE to record radio measurements when in an idle state for subsequent transmission back to the network. MDT primarily uses the Global Positioning System (GPS) to geo-locate the UE but will fall back to other geo-location techniques such as Observed Time Difference of Arrived (OTDA) and Cell Identity (Cell-ID) described later, if GPS is not available.
Another interesting approach to the automatic collection of geo-located UE measurements is that based upon using smart phone applications to collect measurements from the UE and then send these back over the cellular network and internet to a remote server (not necessarily hosted by the network operator) for further analysis [14]. The benefits of this approach are that potentially a far greater range of measurements are available using a UE based application such as general user application behaviour and data transfer rate as well as the RF related measurements. The application based approach also primarily uses GPS to geo-locate the UE but again can fall back to OTDA and Cell-ID technique if GPS is not available.
Regardless of the techniques used to collect the geo-located data one thing is certain, depending on the geo-location technique used, there will always be some form of uncertainty relating to the accuracy of the geo-location measurement and being able to understand the impact this uncertainty has on for example the accurate placing of a 50m radius small cell on a traffic hotspot. The following sections provide an overview of the potential accuracy of the geo-location methods introduced so far.
A.Standalone UE Measurement Reports
Standalone UE measurement reports already provide a fairly crude estimation of the location of the UE since the network knows the location of serving cell site as it is included in the UE measurement report. The accuracy of the location estimation based on this method is therefore dependent on the size of the serving cell which in metropolitan areas can be as small as 50m but in rural area can be as large as 200km. However, even in city centres this method of geo-location still has its problems since not all UEs will be in a 50m radius microcell and surrounding overshooting cells can lead to some UEs still being a number of kilometres from their serving cells. Earlier work [15] suggests geo-location through the use of the knowledge of the serving cell alone provides a location accuracy of between 500m and 800m. Therefore this technique alone is not suitable for creating detailed coverage/traffic distributions on which to locate/optimise 100 - 200m radius small cells.
B.Time of Arrival & Observed Time Difference of Arrival TOA and OTDA use triangulation of either the uplink (computation performed in the network) or the downlink (computation performed in the UE) signals to estimate the
UE’s location. Various related techniques exist for 2G/GSM [16], 3G/WCDMA [17] and 4G/LTE [18], with median location accuracies for 3G/WCDMA and 4G/LTE being reported to be 75m [19] and 20m [20] respectively.
C.GPS Based Geo-location Techniques
D.RF Fingerprinting Techniques
In addition to the three techniques mentioned above a novel technique now being proposed in the literature and based primarily upon the analysis of RF measurement from the UE is RF fingerprinting [23, 24]. Here a database of expected serving and neighbour cells and their expected signal levels is constructed - ideally for all possible locations within network through dedicated measurement surveys or by the processing of geo-located UE measurement reports from a large based of users. This database can then be used to “look-up” UE locations based purely on the “RF fingerprint” reported by the UE. RF fingerprinting alone has been estimated to provide an accuracy of between 20-50% of the serving cell size [25] and therefore for a central London macrocellular network with a typical cell radius of 250m, this equates to a location accuracy of around 50m to 125m.
IV.USING INACCURATE UEMEASUREMENT REPORTS TO
FIND EFFECTIVE SMALL CELL LOCATIONS
It is therefore clear from the review of the different UE geo-location methods that no single geo-location method is available or accurate in all locations. For the majority of indoor users a reliable GPS fix will not be available and therefore other less accurate methods are expected to be utilised for geo-location in these area. Assuming that fall back to OTDA is possible for a 3G/4G UE in such circumstances then in most cases users without GPS will have a median location error of 75m [19] equating to a typical Root Mean Square (RMS) location error of between 90 - 100m [26].
In order to understand the effect that this UE measurement report location error had on the effectiveness of using geo-located UE measurement reports to locate small cell close to traffic hotspots, and also evaluate methods that could be used to mitigate against these location errors, a number of simulations were performed for a realistic central London small cell network using a bespoke 3G/4G Network Simulator developed at the University of Leeds. The following sections highlight the central London network, the generation of hotspots within the simulations and the different methods evaluated to locate the small cells close to the traffic hotspots based on the UE measurement reports received by the UEs within the hotspots.
A.Small Cell Network Simulation Area
[image:4.595.310.556.53.218.2]The small cell modelling detailed in this paper was performed upon the Kensington and Chelsea area of central London. The reason for the choice of this location was because both macrocell, lamppost location and configuration data had been made available for this area to the University of Leeds by Telefonica UK. The detailed small cell simulation area was a 3x3km area bounded by the UK Ordnance Survey grid lines E524000, N178000, E527000, N181000 containing 31 macrocell sites and 5832 lamppost (potential small cell locations). The location of the 31 macrocell sites and the 5832 lampposts within the simulation area are shown in Fig. 1. The 5832 lamppost within the simulation area varied in height between 8 and 10m. Lampposts less than 8m in height were not included in the simulations since these lampposts were considered too low for small cell deployment.
Fig. 1. Kensington 3x3km small cell simulation area showing the location of the 31 macrocells and the 5832 lampposts within the simulation area.
B.Generation of Traffic Hotspots within Simulation Area The simulator allowed 100x100m traffic hotspots to be randomly distributed across the simulation area. Within each of these hotspots any chosen number of users could also randomly distributed, with location errors applied to their reported location using a Weibull distribution with a shape factor of 2, where the probability of the location error (Error) being less than a given distance d was given by
2
_
1
)
(
y
Probabilit
RMS Errord
e
d
Error
(1)where
[image:4.595.316.546.481.673.2]RMS_Error was the RMS error to be applied to the UE location reports.
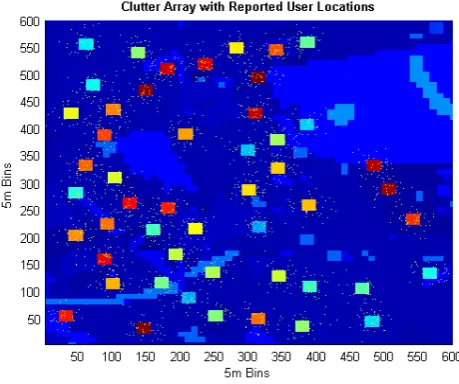
Fig. 2 shows the reported location of the users with the geo-location inaccuracies generated using the Weibull distribution approach described above with an RMS error of 100m.
Fig. 2. Erroneously reported user locations (yellow pixels) for 50 users located entirely withing 50 hotspots. Erroneous UE locations derived
C.Small Cell Placement Methods Considered
Three small cell placement methods were developed to estimate the hotspot locations through the use of geo-located UE measurement reports and then locate small cells on nearby lampposts to best capture traffic from the detected hotspots.
Method 1 simply evaluated the potential traffic/users captured by each of the 5832 lamppost in a post by post fashion using a fixed small cell radius around each post. The use of a fixed cell radius per small cell would be valid when deploying the small cells on a dedicated frequency carrier. Method 1 was used as the benchmark that other enhanced methods of small cell location were compared against.
Method 2 was a method that used 2D sliding window filtering of the reported user distribution matrix (Fig. 2) to try to identify the traffic hot spot locations. The potential traffic capture value tc for each bin (x,y) within the simulation area was calculated as
_ 2
2 _
2 _
2 _
) , ( _ _
) , (
size window x
size window x i
size window y
size window y j
j i matrix on distributi user
y x
tc (2)
where
window_size was the size of the sliding window applied to the user distribution matrix (150m was shown to be most effective).
Since the above calculation applies a square sliding window to the traffic and actually the theoretical small cell coverage footprint is circular, the sliding window method was further enhanced to apply a circular rather than a square sliding window by only considering values from the user distribution matrix within the square sliding window where
02
_ 2
2
2
x j y window size
i (3)
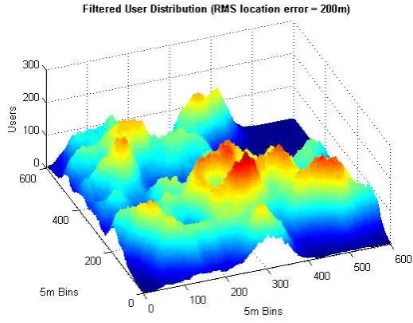
Examples of the output of Method 2’s sliding 2D circular
window filter for user location distributions with RMS location errors of 50, 100 and 200m are shown below in Figs. 3 to 5. Clearly it can be seen that as the RMS location error increases the ability of Method 2 to determine the centre of the traffic hotspot decreases.
The third method, Method 2+RF was an extension of Method 2 that also used RF fingerprinting techniques to discard UE location reports where the reported location did not match with the associated RF measurements. An RF fingerprint table was constructed for each location within the simulation area using coverage plots produced by the Network Simulator. It was assumed that the construction of such a table would be possible in a reality using an RF fingerprint matrix generated from a commercial RF planning tool combined over time with UE measurement reports known to have very accurate location information to correct any discrepancies between the planned and actual coverage arrays, similar to that proposed in [25].
[image:5.595.324.538.130.293.2]The RF fingerprint matrix generated by the Network Simulator contained an RF fingerprint for each 5x5m simulation bin containing Received Signal Code Powers (RSCP) values for the top five best serving macrocells. An example of such an RF fingerprint generated by the Network Simulator for a single bin is given in Table I.
[image:5.595.324.538.328.493.2]Fig. 3. Method 2’s circular sliding filter results (RMS location error = 50m).
Fig. 4. Method 2’s circular sliding filter results (RMS location error = 100m).
[image:5.595.327.534.530.691.2]TABLE I. EXAMPLE 3G/WCDMARFFINGERPRINT MATRIX ENTRY
Serving Cell Cell Scrambling Code Cell RSCP [dBm]
1st 49 -85.52
2nd 47 -94.51
3rd 33 -95.80
4th 34 -95.97
5th 58 -98.65
In order to discard erroneous user locations from the user distribution matrix used as input into the 2D circular filter process for Method 2+RF, each UE measurement report was given a location reliability rank (0 - 5) equal to the number of reported serving cells within the UE measurement report that matched the entry within RF fingerprint matrix for the UE’s reported location. It should be noted that only the order of the cells and not the actual RSCP levels were used in this case to perform the fingerprint look up and location report ranking. The reason for this was that it was felt that because of shadow fading and inaccuracies of the RSCP values actually reported by the UE (3GPP TS 25.133 [27] specifies a +/- 11dB absolute accuracy requirement and a +/- 3dB relative requirement) then the RF fingerprinting method proposed here was more likely to be practical in reality if it only considered the relative rankings rather than the absolute RSCP levels. That is not to say that methods based on both cell ranking and absolute or relative RSCP levels are not possible and this is definitely an area worthy of further investigation.
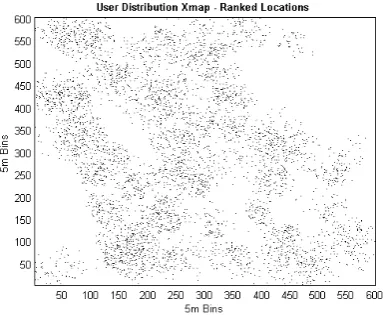
[image:6.595.56.273.71.170.2]Having given each UE location report a location reliability rank, it was then possible to build up user distribution matrices or Xmaps using only measurement reports with particular location reliability rankings. For example shown in Figs. 6 and 7 are examples of user distribution matrices constructed from the same reported UE locations but with location reliability rankings of 1 and 5 used to filter the user reports used to create the user distribution matrices. As can be seen clearly from these examples the higher the location reliability ranking threshold applied to the reports the much greater the location accuracy becomes of the retained samples.
[image:6.595.64.256.529.686.2]Fig. 6. User distribution matrix contructed using only UE reports with RF fingerprint reliability rank 1 retained. (RMS location error = 200m).
Fig. 7. User distribution matrix contructed using only UE reports with RF fingerprint reliability rank = 5 retained. (RMS location error = 200m).
V.SIMULATION RESULTS
Monte-Carlo simulations were undertaken to evaluate the ability of each of the three methods introduced earlier to select the most suitable lampposts for small cell deployment in order to maximise traffic capture. Runs were undertaken for reported UE locations with varying RMS location errors of between 0m and 200m. For each algorithm, the traffic/users were distributed across 50 100x100m hotspots, with 500 users per hotspot (a total of 25,000 users per Monte-Carlo snap shot) for the three fixed small cell radii of 50, 100 and 200m considered.
The overall results for all three methods for all small cell radii considered are given below Fig. 8. Starting with the 200m cell radius case, as seen for all methods, cells of this size tend to capture the majority of traffic because of their size compared to the inaccuracy of the hotspot location estimation. Although Method 2+RF does provide a gain over Method 1 at the largest RMS location error of 200m, it does not provide any gain over Method 2, and therefore it is concluded that no further gains are seen when applying RF fingerprinting to Method 2 in the case of the placement of 200m radius small cells. However for the cases of 50m and 100m radii small cell placement, whilst it is seen that for low RMS location error values Method 2+RF provides little benefit over that of Method 1, for larger RMS location errors of 100m or greater, significant captured traffic gains as high as 139% are possible especially for the largest RMS location error of 200m.
[image:6.595.316.558.559.675.2]VI.CONCLUSIONS
This paper has shown that geo-located UE measurement reports can be used to determine suitable locations for small cell deployment. The paper has proposed a number of methods based upon the use of geo-located UE measurement reports to maximise traffic capture onto the small cell layer from the overlaying macrocell layer. The paper has also shown that the use of RF fingerprinting techniques can be used to increase the accuracy of small cell placement based upon unreliable UE geo-location information.
It has been shown that when addressing 100x100m traffic hotspots using small cells with radii of 50m and 100m in a realistic central London small cell network, the additional gains provided by the simple RF fingerprinting technique are significant for UE measurement reports with large RMS location errors and that in these cases traffic gains of up to 56% (100m small cell radius) and 139% (50m small cell radius) are possible through the more accurate estimation of the traffic hotspot location using this technique.
In terms of further work, it should be noted that so far only RF fingerprinting techniques based on the order of the best servers reported by the UE were considered, and it is possible that further gains are possible by also considering the absolute or relative strengths/quality of the best servers’ signal levels. Also the RF fingerprinting was used to merely exclude UE location reports deemed to be too inaccurate to be used in the hotspot estimation calculation, but there may also be gains to be had by attempting to correct inaccurate UE location reports and adding these corrected reports to the reliable UE location reports prior to the 2D circular filter hotspot estimation algorithm.
REFERENCES
[1] GSMA, "The Mobile Economy 2013," GSMA, London, 2013.
[2] 4G Americas. (2013). Infographic: Mobile Broadband Connected Future [Online]. Available: http://www.4gamericas.org
[3] Informa Telecoms & Media, "Small Cell Market Status - November 2012," Informa Telecoms & Media, London, 2012.
[4] L. J. Ibbetson and L. B. Lopes, "An automatic base site placement algorithm," Proc. IEEE Vehicular Technology Conference Proceedings, Phoenix,1997, pp. 760-764.
[5] X. M. Huang et. al., "Automatic base station placement and dimensioning for mobile network planning," Proc. IEEE Vehicular Technology Conference-Fall, Boston, 2000, pp. 1544-1549.
[6] J. Cardeiro and L. M. Correia, "Optimisation of Base Station Location in UMTS-FDD for Realistic Traffic Distributions," Proc. International Symposium on Personal, Indoor and Mobile Radio Communications, Helsinki, 2006, pp. 1-5.
[7] I. Kocsis et. al., "3G base station positioning using simulated annealing,"
Proc. International Symposium on Personal, Indoor and Mobile Radio Communications, Lisbon, 2002, pp. 330-334.
[8] M. Unbehaun and M. Kamenetsky, "On the deployment of picocellular wireless infrastructure," IEEE Communications Magazine, vol. 10, pp. 70-80, Dec 2003.
[9] H. Liang et. al., "Optimal New Site Deployment Algorithm for Heterogeneous Cellular Networks," Proc. IEEE Vehicular Technology Conference-Fall,San Francisco, 2011, pp. 1-5.
[10] 3GPP Universal Terrestrial Radio Access (UTRA) and Evolved Universal Terrestrial Radio Access (E-UTRA); Radio measurement collection for Minimization of Drive Tests (MDT); Overall description; Stage 2 (Release 10), 3GPP 37.320, v10.4.0, 2012.
[11] Arieso. (2013). [Online]. Available: www.arieso.com [12] Astellia. (2013). [Online]. Available: www.astellia.com
[13] J. Winter and C. Wengerter, "High resolution estimation of the time of arrival for GSM location," Proc. Vehicular Technology Conference-Spring, Tokyo, 2000, pp. 1343-1347.
[14] Metricell. (2013). [Online] Available: www.metricell.co.uk/netcare.php [15] E. Trevisani and A. Vitaletti, "Cell-ID location technique, limits and
benefits: an experimental study.," Proc. Sixth IEEE Workshop on Mobile Computing Systems and Applications, Lake District National Park, 2004, pp. 51-60.
[16] L. Zimmermann et. al., "GSM mobile phone localization using time difference of arrival and angle of arrival estimation," Proc. International Multi-Conference on Systems, Signals and Devices, Chemnitz, 2012, pp. 1-7.
[17] B. Ludden and L. Lopes, "Cellular based location technologies for UMTS: A comparison between IPDL and TA-IPDL," Proc. IEEE Vehicular Technology Conference, Boston, 2000, pp. 1348-1353. [18] 3GPP Evolved Universal Terrestrial Radio Access Network (E-UTRAN);
Stage 2 functional specification of User Equipment (UE) positioning in E-UTRAN (Release 10), 3GPP 36.305, v10.5.0, 2013.
[19] S. Bohanudin et. al., "Simulation model and location accuracy for observed time difference of arrival (OTDOA) positioning technique in Third Generation system," Proc. IEEE Student Conference on Research and Development, Putrajaya, 2010, pp. 63-66.
[20] J. Medbo et. al., "Propagation Channel Impact on LTE Positioning Accuracy - A Study Based on Real Measurements of Observed Time Difference of Arrival," Proc. IEEE International Symposium on Personal, Indoor and Mobile Radio Communications, Tokyo, 2009, pp. 2213-2217.
[21] N. M. Drawil et. al., "GPS Localization Accuracy Classification: A Context-Based Approach," IEEE Trans. on Intelligent Transportation Systems,vol. 14, pp. 262-273, 2013.
[22] Informa Telecoms & Media, "Mobile Broadband Access at Home," Informa Telecoms & Media, London, 2008.
[23] U. Birkel and M. Weber, "Indoor localization with UMTS compared to WLAN," Proc. 2012 International Conference on Indoor Positioning and Indoor Navigation, Montbeliard, 2012, pp. 1-6.
[24] T. Wigren et. al., "Enhanced WCDMA Fingerprinting Localization Using OTDOA Positioning Measurements from LTE," Proc. IEEE Vehicular Technology Conference-Fall, Québec City, 2012, pp. 1-5. [25] T. Wigren, "Adaptive enhanced cell-ID fingerprinting localization by
clustering of precise position measurements," IEEE Trans. on Vehicular Technology, vol. 56, pp. 3199-3209, Sep 2007.
[26] Unknown. GPS Horizontal Position Accuracy [Online]. Available: http://www.leb.esalq.usp.br/disciplinas/Molin/leb447/Arquivos/GNSS/A rtigoAcuraciaGPSsemAutor.pdf