This is a repository copy of
Directors Trading and post-IPO performance
.
White Rose Research Online URL for this paper:
http://eprints.whiterose.ac.uk/98491/
Version: Accepted Version
Article:
Hoque, Hafiz Al Asad Bin orcid.org/0000-0002-4354-3895 and Lasfer, M. (2015) Directors
Trading and post-IPO performance. European Financial Management. pp. 178-204. ISSN
1468-036X
https://doi.org/10.1111/j.1468-036X.2013.12013.x
[email protected] https://eprints.whiterose.ac.uk/
Reuse
Items deposited in White Rose Research Online are protected by copyright, with all rights reserved unless indicated otherwise. They may be downloaded and/or printed for private study, or other acts as permitted by national copyright laws. The publisher or other rights holders may allow further reproduction and re-use of the full text version. This is indicated by the licence information on the White Rose Research Online record for the item.
Takedown
If you consider content in White Rose Research Online to be in breach of UK law, please notify us by
UNCORRECTED PROOFS
Directors
’
Dealing and Post
‐
IPO
Performance*
Ha
fi
z Hoque
School of Business and Economics, Swansea University, Singleton Park, Swansea, SA2 8PP, Wales, UK Email: [email protected]
Meziane Lasfer
Cass Business School, City University London, 106 Bunhill Row, London EC1Y 8TZ, UK Email: [email protected]
Abstract
We use a unique mainly hand‐collected dataset to assess the impact of directors’ trades on IPOs’long‐term returns. Wefind that IPOs where directors are net sellers are more likely to generate positive long‐run returns which occur mostly before the sell trades, suggesting that directors sell when their IPOs reach their optimal values. Conversely, IPOs where directors are net buyers underperform significantly. Our results are not consistent with insider trading in seasoned
firms, partly because the valuation uncertainty of IPOs and the specific motivations to trade weaken the precision of the trades’informativeness.
Keywords: long run IPO performance, insider trades, London Stock Exchange, market timing
JEL classification: G12,G14,G24
1. Introduction
Previous studies show that IPOs generate no or negative excess returns in the long run, despite their relatively high exposure to market risk and level of underpricing.1 This relatively low performance emanates from a combination of extreme differences of
We gratefully acknowledge comments from an anonymous referee, seminar participants at Cass Business School, Manchester Business School and Nottingham Business School. All remaining errors are our own responsibility. Correspondence: Meziane Lasfer.
1
Ritter and Welch (2002)find that the average beta of their IPOs in 1980‐2001 of 1.73. The asymmetric models suggest that IPOs underprice on purpose to subsequently be able to sell further shares at a higher price, and as a result, the long‐run returns should be high (e.g., Benveniste and Spindt, 1989; Jenkinson and Ljungqvist, 2001).
European Financial Management, Vol. 9999, No. 9999, 2013, 1–27 doi: 10.1111/j.1468-036X.2013.12013.x
UNCORRECTED PROOFS
opinion among investors, costly short selling, and small publicfloats on many IPOs.2In this paper, we contribute to this extensive literature by assessing whether the trading behaviour of insiders, defined as board members, affects IPO long‐run performance. We follow previous studies on insider trading (e.g., Seyhun, 1998; Lakonishok and Lee, 2001) and expect directors to know better the true value of their IPO than outside investors and their trades will be informative. Since IPOs underperform because of high information asymmetries (Ritter and Welch, 2002), we test the hypothesis that directors’ trades increase the long‐run stock price accuracy and discovery by mitigating the relatively significant information asymmetries inherent in IPOs, thus leading to a more efficient long‐run pricing.Huddart and Ke (2007) argue that, in the case of insider trading, both Grossman and Stiglitz (1980) price‐taking model and Kyle (1985) imperfect competition model, predict that higher information asymmetry leads to more positive (negative) abnormal returns following buy (sell) trades, and, thus, higher returns to directors. Given the great uncertainty about the value of their IPOs, directors are likely to benefit from their trades if they hold perfect information, suggesting that their trades will only affect strongly stock prices if their information is precise and credible, and if outsiders have lower information about the value of the IPO. Therefore, in line with previous studies (e.g., Lakonishok and Lee, 2001; Jenter, 2005), we expect directors to adopt contrarian strategies by buying (selling) shares in under‐(over‐) performing IPOs and those where they are net buyers (sellers) will generate positive (negative) long‐term returns. This post‐trade stock price behaviour will also be consistent with the agency theory framework (Jensen and Meckling, 1976) because directors’buy (sell) trades will lead to lower (higher) agency conflicts, and, consequently, to higher (lower) long‐term returns. However, if they trade for non‐private information reasons, such as liquidity and portfolio rebalancing considerations, or if they sell because the lockup has expired, then we expect weak or no relationship between insider trading and the long‐run returns of IPOs.
To test these hypotheses we construct a unique hand‐collected dataset of 830 UK IPOs containing all information from prospectuses and insider trading events, and assess their three‐year post‐IPO stock returns. Wefind contrasting results to our expectations as IPOs where directors are net sellers (Net Sell) generate positive returns, while those where they are net buyers (Net Buy) underperform substantially throughout the 36‐months post‐IPO period. We find similar results using the style‐adjusted, equal and value‐weighted cumulative abnormal returns, and the Fama and French (1993) three‐factor model. Our regression results provide further support for thesefindings, as the coefficient of the net purchase ratio,NPR, defined as directors’net purchases over total transactions, measured in terms of trading value or volume, is negative and significant, suggesting thatNet Sell
2
See Jenkinson and Ljungqvist (2001), Ritter and Welch (2002), Ritter (2003), and Eckboet al. (2007) for extensive reviews. Although the long‐run underperfromance is observed in many countries including the US (e.g., Ritter and Welch, 2002; Brav and Gompers, 1997), UK (Vismaraet al., 2012; Levis, 2011; Espenlaubet al., 2000; Goergen et al., 2007), Greece (Thomadakis et al., 2012), Switzerland (Kunz and Aggarwal, 1994), Finland (Keloharju, 1993), and Australia (Finn and Higham, 1988), its significance may suffer from econometrics misspecifications (Fama, 1998) and may be sample period dependent (Carteret al., 2011).
© 2013 Blackwell Publishing Ltd
UNCORRECTED PROOFS
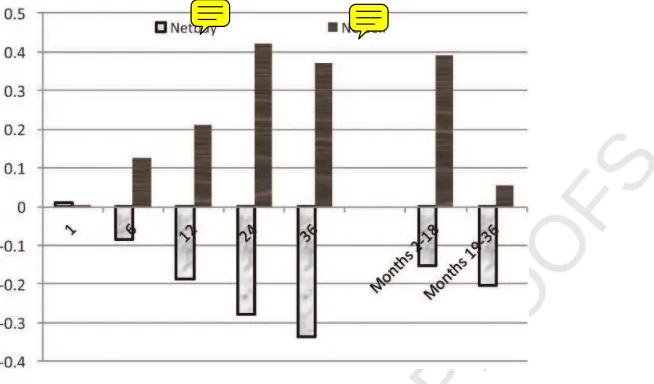
(Net Buy) IPOs generate positive (negative) long‐run returns, even after accounting for the IPOs’fundamental factors.Wefind that the directors’trades are not clustered around the lockup expiry dates; they are relatively evenly distributed across the 36 months sample period as the median number of years from the IPO date to the trading date is 1.45 years for both theNet BuyandNet Sell samples. We, thus, split our sample period into months 2 to 18 and months 19 to 36. We show that while the excess returns of Net Sell IPOs are positive in the first, but not significant in the second period, they are negative for theNet BuyIPOs in both sub‐ periods.
We investigate further the causality of our results, the drivers of this asymmetric performance, the timing ability of directors, and the information content of insider trading, by assessing the market reaction to each individual trade. Wefind that the pre‐sell trades’ excess returns are positive and significant. On the announcement date, share prices decrease, but, in the post trade period, they are mainly not significant, suggesting that directors time their trades by selling when they know that the price of their IPO is optimised. In contrast, for the buy trades, wefind significant negative excess returns in both the pre‐and post‐event periods.
We account for any look‐ahead bias in our results by running calendar time regressions with the Fama‐French calendar time 3‐factor model starting from the date of the trade rather than the IPO date. We expect the alpha of the buy (sell) trade portfolios to be positive (negative) and significant. Wefind similar results as the portfolio ofNet Sell(Net Buy) IPOs earns positive (negative) alphas in the 3‐factor regressions. Our results imply that directors’trades are a response to past performance, but they are less likely to be based on insider information and to predict future returns.
Overall, our results are puzzling as they indicate that the stock returns following the sell trades are not negative, and, for the buy trades, they are negative and significant in the pre‐ and the post‐trade periods. Our results are not consistent with the information content of insider trading in seasoned firms documented in the previous literature (e.g., Seyhun, 1986; Lakonishok and Lee, 2001; Jenter, 2005). While the buy trades of directors in failing IPOs may be consistent with the price support hypothesis3our results indicate that this aim is not achieved as the post‐trade returns are not positive,4suggesting that directors do not reverse the performance, systematically make losses on purchases, and the market does not value their trades. Similarly, the sell trades are not undertaken when the IPO is expecting bad news.
It is difficult to rationalise why the IPO directors adopt such perplexing strategies. One explanation could simply be that directors sell when they know that their IPO has reached its optimal valuation, but that they purchase more stock in their underperforming IPO to avoid admitting failure implicitly, in line with the disposition effect in behavioural
3
In general, underwriters can support prices by stimulating demand or by restricting supply in the aftermarket and in many countries temporary price support in IPOs is legal including the US (1934 Securities Act, Rule 10b‐7, since replaced by Regulation M) and UK (Securities and Investment Board Rules, chapter III, Part 10). We do not have data to test for such trading by the underwriters.
4
One might wonder why directors would support prices rather than initiate a share repurchase program. We do notfind evidence of share repurchases by thesefirms probably because of lack of the necessary cash.
© 2013 Blackwell Publishing Ltd
UNCORRECTED PROOFS
finance. While this may remain a possibility, we are not aware of other means of testing further this hypothesis.5An alternative explanation for our results may be specific to IPOs. Huddart and Ke (2007) argue that the impact of insider trading depends on two fundamental factors: the precision of the insider’s information and the level of uncertainty in the marketplace regarding thefirm’s value. We consider that, unlike seasonedfirms, in the case of IPOs, there is great uncertainty about the value of thefirm, and the directors’ signal is likely to be less precise, resulting in low excess returns, and thus lower informativeness and weak signal. Nevertheless, wefind thatNet BuyIPOs perform better thanNo TradeIPOs, suggesting that the former IPOs could have had a worst performance without the buy trades of directors. TheNet SellIPOs are likely to have low information asymmetries as they perform well before the sell trades, but their signal is also weak as the post‐trade returns are not negative, although the results suggest that these IPOs have reached their optimal valuation.
We contribute to two main areas of research that are not so far considered conjointly: IPO long‐run performance and insider trading. Since Ritter (1991) documented the long‐ run underperformance of IPOs, a number of studies have sought to link this intriguing performance puzzle to factors such as prestigious underwriters and venture capital (VC) backing (e.g., Brav and Gompers, 1997) and more recently to mergers and acquisitions activity (Brauet al., 2012). We show that the trading activity of directors can also explain this underperformance. Our regression results show that directors’trades are affected by the IPOs’ long‐run returns, but not strongly by the previously documented signalling factors such as underpricing (Jenkinson and Ljungqvist, 2001), overhang (Mikkelsonet al., 1997), reputation of underwriters (Carter and Manaster, 1990), venture capitalist (Brav and Gompers, 1997, Krishnan et al., 2011), and private equity backing (Levis, 2011).6Our results are also not consistent with the agency theory which predicts a positive relationship between ownership structure and IPO long‐run performance.7 Moreover, unlike previous insider trading literature, which focussed mainly on seasoned
firms (See Korczaket al. (2010) for recent review), we do notfind, as in Lakonishok and Lee (2001), that insider purchases, not sells, are more likely to predict future stock returns, and insider trading informativeness is not affected by free float, and is not more pronounced in smallerfirms or IPOs listed on the Alternative Investment Market (AIM), a 5
See Subrahmanyam (2007) and Barberis and Thaler (2003) for a review. Kaustia (2004) argues that the disposition effect is clearly identifiable in the IPO market because the offer price is a common purchase price. Hefinds that when the stock price is below the offer price the volume is low, but the volume increases when the price surpasses the offer price for the
first time, and when the stock achieves a new maximum and minimum price, consistent with the reference price effect. This may apply mainly to periods closer to the IPO date, and we think that the offer price cannot be considered as a reference price because three years’time is too long. Directors might also anchor on the initial price of their stock, which, unfortunately, is not available.
6
Doukas and Gonenc (2005) show that reputation of underwriters matters only for not VC backed IPOs.
7
Previous studies provide mixed evidence on this relationship. For example, Mikkelsonet al. (1997) show that the long‐run returns are unrelated to ownership structure, but Jain and Kini (1994)find a positive relation between post‐IPO operating performance and equity retention by original shareholders.
© 2013 Blackwell Publishing Ltd
UNCORRECTED PROOFS
relatively less regulated market for mainly small and high growthfirms. Our results also do not support Marin and Oliver (2008) whofind that insiders sell up to 12 months before large monthly price drops, but buy one month before large price jumps, and Jiang and Zaman (2010) who show that insiders’ability to predict future cashflow news, rather than their adoption of contrarian strategies, explains the predictive ability of their aggregate trades. Overall, our results are likely to be specific to IPOs but raise further the puzzle as to why the underperformance of IPOs does not revert after the directors’purchases and why IPOs do not underperform after their sell trades.The rest of the paper is structured as follows. Section 2 presents our data and the methodology. Section 3 provides the empirical results, and the conclusions are in Section 4.
2. 2. Data and Methodology
Wefirst gather the list of the 1,117 IPOs that went public in the London Stock Exchange, (LSE), in both the Main market and the Alternative Investment Market (AIM) between January 1999 and 2006 from the LSE website, together with the data on the quotation market (AIM or Main market), admission date, country of incorporation, issue price, market value, money raised, name of the broker, and for AIM IPOs, the advisor. We then download prospectuses from Perfect Filings database and hand‐collect all information relating to lockup arrangements, including lockup dates, directors’ownership before and after the IPO and the fraction of their shares locked up, percentage sold at the time of the IPO, institutional ownership, venture capital backing and names of underwriters. We extract any delisting dates, and other accounting and stock market data, which include daily stock prices and indices to compute the stock returns, market capitalisation, which we use as proxy for size, accounting return on assets to measure profitability, and price‐to‐book ratio to proxy for growth fromDataStream. We exclude 77 IPOs for which we could notfind the prospectuses, 15 with missing share price data, and 195 with no lockup date or ownership data from the prospectuses. Ourfinal sample includes 830 (74%)firms with complete data. We also obtain information on subsequent seasoned equity offerings (SEOs) from London Stock Exchange, and any M&A announcement from Thomson One Banker database.
Finally, we use a fifth database, Directors’ Deals, which records all the trades undertaken by directors in the UK market. The database includes news items on directors’ trades disclosed by UK quoted firms in the Regulatory News Service (RNS), such as transaction price, amount, and value, post‐transaction holding, change in holding, name and position of the director, and announcement and transaction dates.8We exclude a
8
The UK Model Code prescribes much faster reporting of directors’dealings. The directors must inform their company as soon as possible after the transaction and no later than thefifth business day after a transaction for their own account or on behalf of their spouses and children (Hillier and Marshall, 2002). In turn, thefirm must inform the LSE without delay and no later than the end of the business day following receipt of the information. This implies that the information reaches the market as late as 6 days after transaction. In contrast, in the USA, during the pre‐Sarbanes‐Oxley period, directors have to report their trades on the 10th of the month following the transaction, resulting in a maximum delay of between 10 and 42 days, depending on the trading date. As a result, most previous studies could not analyse insider‐ trading event on or before the lockup expiry date.
© 2013 Blackwell Publishing Ltd
UNCORRECTED PROOFS
number of observations not related to private information, such as exercise of options or derivatives, script dividends, bonus shares, rights issues, awards made to directors under incentive plans or reinvestment plans, and all directors’ transactions in investment companies. After this screening, we obtain 36,943 directors’trades. We check the data for errors and exclude 2,952 (8%) trades as the difference in announcement and transaction date is more than the 5 days legally required in the UK (Korczaket al., 2010). Ourfinal sample includes 33,991 directors’ trades in 2,664 listed companies, split into 26,268 (77%) buy, and 7,723 (23%) sell trades. We, then, match all director trading event dates with the dates of the IPOs, and select IPOs where directors’trading occurs during the three‐year period of IPO. Wefind 543 (65%)firms with at least one director trade during the 36 months period after IPO. We exclude 31 trades that occur on the same day. We identify 791 sell trades in 231 IPOs and 2,102 buy trades in 480 IPOs. Finally, we follow Lakonishok and Lee (2001) and define theNet Purchases Ratio, NPR, as:N PR¼Purchases Sells T otal T rades
Wefind 190 (35%) IPOs with negativeNPR, referred to asNet Sellsub‐sample, and 353 (65%) with positive NPR, classified asNet Buysub‐sample, using both the number of transactions (NPR transaction), and the value of the trades (NPR value).
We use various methodologies to test our hypotheses. Wefirst use the standard event study methodology to compute the cumulative abnormal returns over 3 years after thefirst month of the IPO. The abnormal returns are the monthly returns on each IPO lessthe return on theFinancial Times All Share Index, FTA, which is a more representative index as it includes small as well as large companies. We also use the AIM index for our AIM IPOs and FTA for IPOs on the Main market, and compute both the equally‐and value‐ weighted CARs. Following Ritter and Welch (2002), we compute the style‐adjusted CARs, and buy and hold returns, BHARs, as the difference between the returns on an IPO and a style‐matchedfirm, defined as the closest market capitalisation and book‐to‐market ratio listedfirm to our IPO. We select the controlfirm only once, and if it is delisted prior to the IPO returns’ending date, we replace it with another matchingfirm on a point‐forward basis. If the IPO is delisted, we compute the excess returns up to the date of delisting. We also use the market model to compute the abnormal returns over the event window [ 40,
þ40] relative to the trading date, and the lockup expiry date. Theaandbare from the regression of the security returns against the corresponding market indices, the AIM all share price9and FTA, for AIM and Main Market IPOs, respectively, over the period [ 290, 41] trading days relative to each event date. We estimate the Fama‐French (1993) calendar time regressions as in Ritter and Welch (2002):
Rpt Rf t¼aþbtðRM t Rf tÞ þbt 1ðRM t 1 Rf t 1Þ þgtSM Btþgt 1SM Bt 1
þdtH M Ltþdt 1H M Lt 1þept
whereRpt–Rftis the excess return over the risk free rate on a portfolio in time period t,RMt – Rft is the market risk premium, with FTA as a proxy for RMt, and Rft the 3 months Treasury bill rate.SMBtis the return on smallfirms minus the return on largefirms, and HMLtis the return on high book‐to‐market return minus the return of the low book‐to‐
9
We also use the Hoare Govett Smaller Companies Index as the market index. Our results are similar.
© 2013 Blackwell Publishing Ltd
UNCORRECTED PROOFS
market portfolio. We extract the relevant data for size and book‐to‐market indices from K. French data library: http://mba.tuck.dartmouth.edu/pages/faculty/ken.french/data_ library.html#International. Thebis the sum of bt andbt‐1. We use similar method toassess our IPOs’exposures to SMB and HML factors. The signalling and agency theory hypotheses predict thataNet Buy >aNet Sell.
We relate theCARstoNPRafter controlling for other factors defined in the previous literature, such as first day return, size, insider ownership (overhang), the underwriter reputation, venture capitalist backing, lockup length and expiry date returns, period dummies, and Seasoned Equity Offerings (SEO) to capture Myers and Majluf (1984) effects. We account for the impact of takeover activity, as reported by Brauet al. (2012) by using the actual takeover obtained from Thomson One Banker database, and by following Braret al. (2008) method. Wefirst build a two‐way matrix by size and growth in turnover. We consider that large and high (small and low) growthfirms are less (more) likely to be subject to a takeover bid, and thus assigned a value of zero (one). We then classifyfirms in the remaining two quadrants into yield groups: high yield IPOs have a higher probability, and, thus take a value of one, while those with low yield have a value of zero.
Finally, we run various logit regressions to determine the characteristics of theNet Sell and Net Buy subsamples. We use various explanatory variables to capture the IPO fundamentals. We use size, the log of market value of equity at the IPO date, to assess whether insider trading occurs in large, thus, less riskyfirms. We test for robustness by using a dummy variable forfirms listed on the Alternative Investment Market (AIM). In addition, we include risk, the standard deviation of the stock returns over the 36‐months period, andfirst day underpricing. We use market‐to‐book ratio, and CAR‐40,‐2relative to
trading dates, to assess whether directors are contrarians. We measure insider ownership structures using shares locked, and lockup lengths. We also account for ownership of outsiders, including VC backing, and institutional holding, and for liquidity using overhang and freefloat. Finally, we use takeover and SEO probabilities, to assess trading on insider information and prestigious underwriters to evaluate the impact of corporate brokers in the UK.
3. Empirical Results
3.1 Descriptive statistics
Table 1 provides the descriptive statistics of our samplefirms. Panel A. shows that the median length of the lockup is 365 days, in line with Espenlaubet al. (2001) and Hoque and Lasfer (2009),10and more than double the 180 days in the US (Brav and Gompers, 2003; Field and Hanka, 2001). The average free float, defined, in line with Levis (1993) and Goergenet al. (2006), as the proportion of money raised in IPO relative to total market value of the company at the time of IPO, amounts to 39.16%, and theOverhang, defined as shares retained to shares sold, amounts to 3.85%. The shares locked amount to 94.52% of the shares sold on the IPO date (equivalent to 29.5% of the shares outstanding). The underpricing of 22.5% is consistent with previous evidence (e.g., Chambers and Dimson, 2009). The
10
Espenlaubet al. (2001)find mean (median) lockup of 561 (730) days in 1992‐1998 when the lockup contracts are compulsory for mineral and scientific research basedfirms with less than three years trading records.
© 2013 Blackwell Publishing Ltd
UNCORRECTED PROOFS
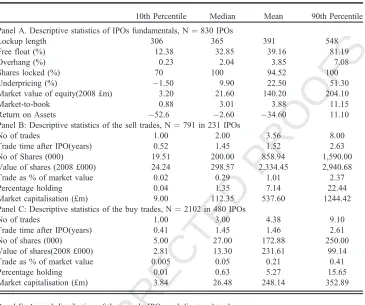
Table 1Descriptive statistics of IPOs and directors’trading
10th Percentile Median Mean 90th Percentile Panel A. Descriptive statistics of IPOs fundamentals, N¼830 IPOs
Lockup length 306 365 391 548 Free float (%) 12.38 32.85 39.16 81.19 Overhang (%) 0.23 2.04 3.85 7.08 Shares locked (%) 70 100 94.52 100 Underpricing (%) 1.50 9.90 22.50 51.30 Market value of equity(2008 £m) 3.20 21.60 140.20 204.10 Market‐to‐book 0.88 3.01 3.88 11.15 Return on Assets 52.6 2.60 34.60 11.10 Panel B: Descriptive statistics of the sell trades, N¼791 in 231 IPOs
No of trades 1.00 2.00 3.56 8.00 Trade time after IPO(years) 0.52 1.45 1.52 2.63 No of Shares (000) 19.51 200.00 858.94 1,590.00 Value of shares (2008 £000) 24.24 298.57 2,334.45 2,940.68 Trade as % of market value 0.02 0.29 1.01 2.37 Percentage holding 0.04 1.35 7.14 22.44 Market capitalisation (£m) 9.00 112.35 537.60 1244.42 Panel C: Descriptive statistics of the buy trades, N¼2102 in 480 IPOs
No of trades 1.00 3.00 4.38 9.10 Trade time after IPO(years) 0.41 1.45 1.46 2.61 No of shares (000) 5.00 27.00 172.88 250.00 Value of shares(2008 £000) 2.81 13.30 231.61 99.14 Trade as % of market value 0.005 0.05 0.21 0.41 Percentage holding 0.01 0.63 5.27 15.65 Market capitalisation (£m) 3.84 26.48 248.14 352.89 Panel E. Annual distribution of the sample IPOs and directors’trades
Year 1999 2000 2001 2002 2003 2004 2005 2006 IPOs 39 144 59 44 39 159 201 146 Average money raised (£m) 187.2 253.5 106.8 84.1 100.0 51.6 73.6 138.4 Lockup length 427 374 410 437 404 392 388 375 Buy Trades (%) 4 19 8 7 6 22 23 12 Sell Trades (%) 5 8 8 6 6 27 29 11 Net Buy (% IPO) 2 20 7 5 6 20 23 17 Net Sell (% IPO) 7 8 11 6 6 25 25 13
This table reports the descriptive statistics for 830 IPOs and directors trades in those IPOs from 1999 to 2006.Lockup lengthis lockup period in days,freefloatdefined as the proportion of money raised in IPO relative to total market value of the company, Overhangis the ratio of the proportion retained to the proportion sold,Shares lockedis the ratio of shares locked relative to shares sold in the IPO.Underpricingis the percent return on thefirst day from the offer price to the closing price,Market valueis the offer pricetimesshares outstanding in 2008 millions of Pound Sterling constant terms.Market‐to‐bookis the ratio of market capitalisation at the IPO divided by the book value of the equity in thefirst reporting period after IPO,Return on assetsis the net income divided by total assets in thefirst reporting period after the IPO. Panel B and C report the distribution of the buy and sell trades that occurred within 3 years of IPO.
Percentage Holdingis the percent of total shares owned by the director who traded.CAR‐42,‐2is the cumulative
abnormal return 40 day pre‐event window, where the abnormal returns are based on the standard event study methodology withaandbcomputed from a regression of stock returns on the FTSE All Share Price Index for main market companies and AIM All Share Price Index for AIM companies. In Panel E,Net Buy(Net Sell) is the proportion of IPOs with positive (negative) ratio of (Buys–Sells)/Total trade,Average Money Raisedis the ratio of money raised in 2008 £m over the number of IPOs.
© 2013 Blackwell Publishing Ltd
UNCORRECTED PROOFS
analysis of the fundamentals indicates that, while the average market value of equity of ourfirms is £140m (about $210m), our sample includes small as well as largefirms. Consistent with US evidence (e.g., Brav and Gompers, 2003), our IPOs are loss making as the average return on equity is‐34.6% and high growth as the average market‐to‐book ratio is 3.88.
Panels B. and C. report the distribution of the buy and sell trades during the three‐year post‐IPO period. On average, there are 3.56 sell and 4.38 buy trades, occurring roughly 1.5 years after IPO, suggesting that most of the trades occur after the lockup expiration date. The results indicate, however, that the number and value of shares sold are significantly higher than the buy trades; the value of shares sold of £2.3m is 10 times those bought of £0.23m. We also observe this difference (1.01% vs. 0.21%) when we scale the value of the trades by market capitalisation to account for size impact, as the average market value of IPOs subject to buy trades of £248m is significantly lower than the £538m for the sell trade IPOs. Overall, the buy trades are more frequent, but they appear to be smaller than the sell trades. Consequently, the average holding of directors is significantly larger in IPOs with sell trades. Panel E. reports the annual distribution of sample IPOs and directors’trades. Consistent with previous evidence (e.g., Chambers and Dimson, 2009), the volume of IPOs is relatively high in the‘Bubble’periods of 2000, and 2004‐2006, but 2001‐2003 is a relatively quiet period. The next row reports the distribution of the amount of money raised. IPOs appear to be relatively larger in 1999 to 2000 period, with an average of £200m per issue, compared to £88m in the post‐2001 period. In terms of the length of the lockup, the results show that the maximum of 437 days is in 2002 and the minimum of 374 is in 2000, but the distribution is relatively homogeneous, and in each year, the average is higher than 180 days documented in the USA. Interestingly, the analysis of the annual distribution of director trades and theNet Selland theNet Buysub‐samples, reported in the last two rows, indicates that both the buy and sell trades are more frequent in 2004‐2006, except for the 19% buy trades in 2000. In 1999, the total number of trades is 124, split into 84 (4% of 2,102) buy and 40 (5% of 791) sell trades, while the respective trades in 2005 are 483 (23%), and 229 (29%). Wefind similar distribution for the number ofNet BuyandNet SellIPOs. Only a small number of IPOs are subject to director trading activity in 1999‐2003, except 2000 with 166 IPOs (20%). We account for this time effect in our regressions.
3.2 The long‐run performance of IPOs
Table 2 reports the long‐run performance over various sub‐periods after the IPO date and over months 2 to 18, and 19 to 36, as Figure 1 shows that the periodicity of the buy and sell trades is relatively evenly distributed across these two sub‐periods. Following Ritter and Welch (2002), we report in Panel A. and B. the style adjusted buy and hold average returns (BHARs) and cumulative abnormal returns (CARs) where the style‐matchedfirm is the closest market capitalisation and book‐to‐market ratio listedfirm. In Panel C and D we report equally weighted and value weighted CARs witha¼ 0 andb¼1.11In Panel A
11
Wefind similar results when we compute the raw BHARs. Bravet al. (2000) argue that tests of underperformance based on BHARs are biased towards rejecting the null hypothesis of no underperformance. Moreover, the raw equally‐weighted returns may result in biased long‐ term returns as they are not compared to a benchmark and they may suffer from size effects. We report matched‐firm approach results as under this method the underperformance disappears or shrinks (e.g., Brav and Gompers, 1997; Ritter and Welch, 2002).
© 2013 Blackwell Publishing Ltd
UNCORRECTED PROOFS
Table 2
Long‐run IPO performance
Months Event windows
N 1 6 12 24 36 2‐18 19‐36
Panel A. Style‐adjusted BHARs
All IPOs 830 0.002 (0.27) 0.016 ( 0.50) 0.076*** ( 2.02) 0.139*** ( 3.15) 0.183*** ( 3.43) 0.055 ( 1.36) 0.226*** ( 2.62) AIM 691 0.013 ( 1.33) 0.013 ( 0.36) 0.070 ( 1.64) 0.150*** ( 2.96) 0.187*** ( 3.03) 0.045 ( 0.98) 0.267** ( 2.62) Main 139 0.049*** (3.19) 0.030 ( 0.48) 0.106 ( 1.44) 0.083 ( 1.09) 0.161** ( 1.92) 0.101 ( 1.47) 0.020 ( 0.25)
AIM‐Main (p‐value) 0.00 0.80 0.67 0.46 0.80 0.50 0.06
No trade IPOs 287 0.023 ( 1.46) 0.024 ( 0.34) 0.133*** ( 2.38) 0.340*** ( 5.55) 0.361*** ( 5.26) 0.229*** ( 3.96) 0.438** ( 1.89) AIM 257 0.032 ( 1.93) 0.035 ( 0.46) 0.135** ( 2.28) 0.344*** ( 5.14) 0.362*** ( 4.89) 0.224*** ( 3.59) 0.470* ( 1.85) Main 30 0.057 (1.45) 0.074 (0.44) 0.111 ( 0.685) 0.303** ( 2.44) 0.34** ( 2.50) 0.27* ( 1.83) 0.161 ( 0.77)
AIM‐Main (p‐value) 0.04 0.55 0.89 0.77 0.91 0.76 0.35
Net buy IPOs 353 0.012 (0.93) 0.086*** ( 2.28) 0.185*** ( 2.95) 0.277*** ( 4.09) 0.336*** ( 4.50) 0.152*** ( 2.55) 0.204*** ( 3.49) AIM 304 0.009 (0.64) 0.067 ( 1.54) 0.172** ( 2.44) 0.273*** ( 3.54) 0.336*** ( 3.98) 0.140** ( 2.09) 0.218*** ( 3.35) Main 49 0.033 (1.32) 0.199* ( 1.76) 0.271** ( 2.13) 0.297*** ( 3.16) 0.335*** ( 2.76) 0.223** ( 2.19) 0.114 ( 1.11)
AIM‐Main (p‐value) 0.41 0.33 0.50 0.84 0.99 0.50 0.39
Net Sell IPOs 190 0.001 (0.11) 0.127*** (2.89) 0.212*** (2.75) 0.421*** (4.08) 0.371*** (2.49) 0.390*** (3.95) 0.055 (0.70) AIM 130 0.025 ( 1.60) 0.160 (1.08) 0.295*** (2.92) 0.522*** (3.86) 0.508** (2.46) 0.530*** (3.98) 0.021 (0.21) Main 60 0.058 (2.67) 0.056*** (2.68) 0.032 (0.30) 0.201 (1.45) 0.073 (0.49) 0.085 (0.77) 0.128 (0.98)
AIM‐Main (p‐value) 0.01 0.19 0.07 0.10 0.09 0.02 0.52
Panel B. Style‐adjusted CARs
All IPOs 830 0.022* (1.89) 0.002 ( 0.05) 0.056 ( 1.37) 0.175*** (3.05) 0.261*** ( 3.72) 0.123** ( 2.54) 0.161*** ( 3.23) No Trade IPOs 287 0.012 (1.02) 0.058** ( 2.04) 0.274** ( 6.76) 0.420*** ( 7.32) 0.513*** ( 7.30) 0.321*** ( 6.64) 0.204*** ( 4.10) Net buy IPOs 353 0.026** (2.19) 0.017 ( 0.61) 0.107** ( 2.64) 0.280*** ( 4.88) 0.420*** ( 5.97) 0.192*** ( 3.98) 0.253*** ( 5.10) Net sell IPOs 190 0.027** (2.33) 0.082** (2.85) 0.145*** (3.45) 0.239*** (4.17) 0.239*** (3.40) 0.187*** (3.88) 0.024 (0.49)
Panel C. Equal weighted CARs
All IPOs 830 0.005 (0.36) 0.023 ( 0.71) 0.106** ( 2.33) 0.270*** ( 4.22) 0.365*** ( 4.66) 0.162*** ( 3.10) 0.208*** ( 3.75) No Trade IPOs 287 0.016 ( 1.19) 0.081*** ( 2.52) 0.219*** ( 4.85) 0.526*** ( 8.22) 0.679*** ( 8.66) 0.340*** ( 6.50) 0.324*** ( 5.84) Net buy IPOs 353 0.022* (1.65) 0.051 ( 1.59) 0.179*** ( 3.95) 0.375*** ( 5.85) 0.483*** ( 6.16) 0.251*** ( 4.80) 0.254*** ( 4.57) Net sell IPOs 190 0.000 (0.03) 0.078*** (2.45) 0.120*** (2.65) 0.149*** (2.33) 0.133* (1.70) 0.153*** (2.93) 0.020 ( 0.37)
©
2013
Blackwell
Publishing
Ltd
10
Ha
fi
z
Ho
que
and
Meziane
UNCORRECTED PROOFS
Table 2 Continued
Months Event windows
N 1 6 12 24 36 2‐18 19‐36
Panel D. Value weighted CARs
All IPOs 830 0.028 (1.16) 0.059 ( 0.99) 0.256*** ( 3.05) 0.399*** ( 3.37) 0.351** ( 2.41) 0.303*** ( 3.04) 0.076 ( 0.74) No Trade IPOs 287 0.003 ( 0.11) 0.061 ( 1.03) 0.274*** ( 3.27) 0.537*** ( 4.53) 0.530*** ( 3.65) 0.436*** ( 4.38) 0.092 ( 0.89) Net buy IPOs 353 0.056*** (2.29) 0.036 ( 0.60) 0.343*** ( 4.09) 0.639*** ( 5.39) 0.655*** ( 4.51) 0.487*** ( 4.89) 0.223** ( 2.17) Net sell IPOs 190 0.019 (0.76) 0.081 ( 1.37) 0.159* ( 1.89) 0.081 ( 0.68) 0.056 (0.38) 0.041 ( 0.41) 0.079 (0.77)
This table presents the buy‐and‐hold abnormal returns (BHARs) and cumulative abnormal returns (CARs) for UK IPOs for 3‐year post‐IPO period. The abnormal returns are based on the FTSE All Share Price Index for main market IPOs and AIM All Share Price Index for AIM IPOs. Panel A and B report the style‐adjusted (M/B and size) BHARs and CARs, respectively. All IPOsincludes 830 UK IPOs over the period 1999‐2006.No Trade(287 IPOs) include IPOs without any insider trading during 36 months period after IPO. IPOs with insider trades (543 IPOs) include any IPOs with at least one insider trade during 36 months period after IPO, split into 190Net SellIPOs and 353Net BuyIPOs. The former are IPOs with positiveNPRwhile the latter have negativeNPR, whereNPRis the difference between total value of purchases and sells divided by total value of shares traded over this 36 months period after IPO. The returns excludefirst day returns. ***, **,* denotes significant at 0.01, 0.05 and 0.10 level, respectively.
©
2013
Blackwell
Publishing
Ltd
Directors
’
Deal
ing
and
Post
‐
IPO
Performance
UNCORRECTED PROOFS
we compare IPOs listed on the AIM and the Main market. Since the impact of AIM is relatively marginal and the results are relatively similar across the estimation methods used, we do not distinguish between AIM and Main in the remaining panels and in the OLS regressions.Our results are relatively consistent across these different methodologies. Overall, they indicate that the excess returns are not homogeneous across our sample firms. In particular, the overall underperformance of our sample of IPOs appears to be driven by IPOs without insider trading andNet BuyIPOs which underperform consistently across all our sample period except thefirst few months of quotation, whileNet SellIPOs over‐ perform. For example, the style‐adjusted BHARs reported in Panel A in months 19 to 36 are‐22.6%,‐43.8%, and‐20.4%, forAll,No Trade, andNet BuyIPOs, respectively, while theNet SellIPOs generate positive returns throughout the sample period. We show these results in Figure 2. Overall, our results suggest that these trades are less likely to be informative, directors do not trade on insider information, but they are likely to sell when their IPOs reach their peak.
3.3 The timing of the excess returns
In this section, we assess whether the positive (negative) excess returns ofNet Sell(Net Buy) IPOs occur before or after the trades of directors. We assess directly the market reaction around each individual buy and sell trade undertaken by directors. Table 3, Panel A, shows that on the announcement date of buy trades, share prices increase substantially by 3.59%, compared to the 1.16% reported by Fidrmuc et al. (2006) for UK seasoned
firms. In the various pre‐event periods, the CARs are all negative and significant, suggesting that the trades occur when the IPO is underperforming. Interestingly, the post‐ event CARs are all negative suggesting that the positive signal of the buy trades is short‐ lived. For the sell trades, the pre‐event period CARs are positive and highly significant, but on the event and post‐event periods, they are not constantly negative and significant.
Fig. 1. Distribution of buy and sell trades
Thisfigure reports the distribution of the proportion of the buy and sell trades over the 36 months period after IPOs. The sample includes 2,102 buy trades and 791 sell trades undertaken in 830 UK IPOs over the period 1999–2006. The event periods 2 to 18 and 19 to 26 months show whether the trades occur during thefirst or second part of our sample period.
© 2013 Blackwell Publishing Ltd
UNCORRECTED PROOFS
These results suggest that, consistent with previous insider trading literature (e.g., Seyhun, 1986), directors adopt contrarian strategies by buying (selling) after significant share price decreases (increases), but the informativeness of these trades is weak, as stock prices do not increase (decrease) after their buy (sell) trades. Although the negative announcement dates abnormal returns implies that directors convey bad news to the market by selling shares, in line with Brau and Fawcett (2006), the impact is short lived. Our results also imply that since the returns in the period before the sell trades are positive, directors may have stopped the positive performance of the IPO. Without such trades, returns may have carried on increasing, although they are small.In Panel B, we aggregate these trades forNet BuyandNet Sellsub‐samples. The CARs for Net Buysub‐sample are all negative and significant, with the exception of the positive returns of 2.60% on the announcement dates. In contrast, for theNet Sellsample, the CARs are all positive, except for CAR‐1,þ1and CARþ2,þ40. However, the pre‐trade CARs are relatively
larger than the post‐trade CARs, suggesting that, in line with the last two columns in Table 2, the pre‐trade period is likely to drive the excess returns for theNet Sellsample.
3.4 Fama and French (1993) Results
[image:14.485.105.432.67.259.2]We expand our robustness checks using the Fama‐French (1993) regressions model. In line with previous insider trading literature, we use the director trading as event and calculate Fama‐French regressions using trade dates, because our results on CAR and BHAR using IPOs may suffer from the look‐ahead bias, as investors could not separate
Fig. 2. Style‐adjusted buy‐and‐hold long‐run returns of net buy and net sell IPOs
Thisfigure presents the Buy‐and‐hold returns relative to size and book‐to‐market controlfirms for 3‐ years post‐IPO period. We construct our samples as follows. Wefirst select IPOs with insider trades (543 out of 830), which include any IPOs with at least one insider trade during 36 months period after IPO. Then we compute the Net purchase ratio,NPR, as the difference between the total value of purchases and sells, divided by the total value of shares traded over this 36 months period after IPO. IPOs with positive (negative)NPRare classified asNet Buy(Net Sell) IPOs. We identify 190Net SellIPOs and 353Net Buy
IPOs. We compute thefirst month returns withoutfirst day returns to exclude any potential effects of the level of underpricing.
© 2013 Blackwell Publishing Ltd
UNCORRECTED PROOFS
Table 3
The behaviour of the equal weighted abnormal returns of directors’trades
N 1Y 6M ( 40–2) ( 1,þ1) (þ2,þ40) þ6M þ1Y þ2Y
Panel A. Cumulative abnormal returns around directors’trading announcements within 36 months post‐IPO period
Buy Trades 2,102 0.143*** ( 7.60) 0.125*** ( 10.64) 0.112*** ( 18.4) 0.0359*** (13.95) 0.0141** ( 2.94) 0.003 ( 0.11) 0.042** ( 2.32) 0.074* ( 1.93)
Sell Trades 791 0.364*** (16.34) 0.225*** (13.84) 0.0603*** (6.89) 0.0011 ( 0.55) 0.0247*** ( 3.54) 0.023 (1.65) 0.039* ( 1.73) 0.066 ( 1.08)
Panel B. Cumulative abnormal returns around aggregate directors’trading within 36 months post‐IPO period
Net Buy 1,622 0.179*** ( 8.25) 0.144*** ( 10.37) 0.0767*** ( 10.40) 0.0260*** (3.97) 0.0164** ( 2.40) 0.048*** ( 3.61) 0.128*** ( 6.10) 0.217*** ( 4.77)
Net Sell 1,271 0.231*** (11.44) 0.122*** (9.01) 0.0461*** (5.25) 0.001*** ( 3.60) 0.0146** ( 2.57) 0.072*** (6.00) 0.066*** (3.40) 0.126*** (2.92)
This table presents the cumulative average abnormal returns around directors’share trading. We use the market‐adjusted model with FTSE All Share Index and AIM all share price index as the proxy for market returns. We identify 2102 buy and 791 sell trades. ( 40‐2), (‐1þ1) and (þ2þ40) are for the cumulative abnormal returns over the 40 to 2 days, 1 toþ1 days andþ2 toþ40 days relative to announcement date of the trade. M is for month and Y for Year. Panel A presents the results for each individual trade. Panel B. presents the aggregated trades forNet BuyandNet SellIPOs. The sample period is limited to 36 months after the IPO to allow comparison with previous IPO studies. The sample period is 1999–2006. IPOs with positive (negative)NPRare classified asNet Buy(Net Sell), whereNPRis the difference between total value of purchases and sells divided by total value of shares traded over this 36 months period after IPO. We identify 190Net SellIPOs and 353Net BuyIPOs. The returns excludefirst day returns. ***, **,* denotes significant at 0.01, 0.05 and 0.10 level, respectively.
©
2013
Blackwell
Publishing
Ltd
14
Ha
fi
z
Ho
que
and
Meziane
UNCORRECTED PROOFS
IPOs on the basis of subsequent insider trading at the time of the IPO. We, therefore, assess the excess returns from the date of the buy and sell trades, rather than IPO date, to allow investors to trade on such information. We run the Calendar time portfolio regressions. The results in Table 4, Panel A, shows that the interceptawhich measures the abnormal returns, is negative for buy but positive for sell trades, confirming that directors earn negative returns on their purchases, but share prices do not decrease after the sell trades, in line with our results above.Panel B. reports the results based on equally weighted returns. For the sample as a whole, wefind but not report for space considerations thatais‐0.9%, equivalent to CAR1, 36of‐36% reported in Panel B, Table 2, andb, the sum ofbtandbt‐1is 1.66, in line with
Ritter and Welch (2002)findings of 1.73, suggesting that our IPOs have relatively higher risk and, thus, they should generate positive long‐term returns. Although this magnitude ofbis relatively homogeneous across all our sub‐samples, ranging between 1.45 forNet Buyand 1.66 forNet SellIPOs,ais‐1.9%,‐1.5% andþ2.1% forNo Trade,Net Buyand Net SellIPOs, in line with ourfindings in Table 2.
The remaining results are in line with Ritter and Welch (2002) in terms of signs, but the lagged coefficients of SMB are predominantly insignificant. Similarly, the coefficients of the lagged HML are predominantly not significant, but the coefficient of HML is more negative for theNet SellIPOs. These results suggest that the exposure of the returns to size and growth indices is only contemporaneous. The results based value‐weighted returns reported in Panel C show thatais not significant forNo TradeIPOs, but positive forNet Selland negative forNet BuyIPOs.
3.5 The determinants of the long‐run performance
In this section, we run a set of regressions to assess whether the difference in the performance ofNet BuyandNet SellIPOs holds after controlling for IPO fundamentals. Table 5 reports the cross‐sectional regressions results. We useNPR, the net purchase ratio based on number and value of the transactions to measure directors’trading activity, and a dummy variable for no insider trading. The last three columns replicate Regression (1) for Net Buy,Net SellandNo Tradesubsamples. The results indicate that all the three insider‐ trading variables affect negatively IPO long‐term performance. The negative coefficient of NPR implies that IPOs where directors are net buyers generate negative returns. Similarly,No Tradedummy is negative and significant, suggesting that IPOs not subject to insider trading underperform significantly more than their counterparts where directors trade. These insider trading variables have also increased the explanatory power of the regressions as previous studies report relatively much lower R2 of 1 to 8% (e.g., Levis, 2011; Goergenet al., 2007).12Overall, our results suggest that insider trading is an additional and significant explanatory variable of the long‐run performance of IPOs.
The remaining explanatory variables expand thefindings reported in previous studies. For example, the relationship between long‐run performance andUnderpricingis negative and significant in all our specifications, except in theNet Sellsubsample, in line with previous 12
Levis (2011) obtained an R2of 1.4% for Non‐private equity backed, 7.5% for venture capitalists‐backed and 0.05% for buyout IPOs. Goergenet al. (2007) report R2for allfirms of 8.45%. However, they report R2 of 6.38% and 13.58% for small firms and large firms respectively.
© 2013 Blackwell Publishing Ltd
UNCORRECTED PROOFS
Table 4
Fama French three‐factor regressions on calendar‐time portfolio returns (36 months)
a bt bt‐1 gt gt‐1 dt dt‐1 Adj. R
2
Panel A: Calendar time regressions 36 months post‐trading date
Buy trades 0.018*** 1.039*** 1.079*** 0.506*** 0.582
( 3.76) (12.52) (6.63) ( 2.88)
0.012*** 0.945*** 0.237*** 0.909*** 0.137 0.372** 0.421** 0.602 ( 3.06) (12.39) (3.12) (5.64) (1.32) ( 2.11) ( 2.41)
Sell trades 0.008 0.920*** 1.322*** 0.815** 0.550
( 1.54) (8.71) (4.65) ( 2.33)
0.016*** 0.692*** 0.116 1.265*** 0.508* 0.602 0.637** 0.534 (2.88) (5.64) ( 0.98) (4.08) (1.94) ( 1.56) ( 2.53)
Panel B. Equally weighted returns 36 months post‐IPO date
No trade IPOs 0.019*** ( 3.79) 0.909*** (7.24) 0.991*** (6.86) 0.495 ** ( 2.17) 0.59 0.018*** ( 3.75) 0.906*** (7.09) 0.203 (1.56) 0.868*** (5.65) 0.257** (2.02) 0.499** ( 2.30) 0.293 ( 0.093) 0.61 Net sell IPOs 0.021** (2.40) 1.197*** (8.38) 1.071*** (4.18) 1.286*** ( 3.53) 0.58 0.024*** (2.93) 1.193*** (6.11) 0.122 (0.716) 0.975*** (5.01) 0.157 (0.702) 1.278*** ( 3.401) 0.474 ( 0.97) 0.59 Net buy IPOs 0.015*** ( 3.56) 0.887*** (8.25) 1.101*** (7.50) 0.448* (1.87) 0.61 0.013** ( 2.95) 0.896*** (8.06) 0.309*** (2.83) 0.975*** (7.10) 0.241 (1.63) 0.532** ( 2.44) 0.125 ( 0.38) 0.65 Panel C: Value weighted returns 36 months post‐IPO date
No trade IPOs 0.008 ( 1.22) 1.534*** (5.20) 1.168*** (4.83) 1.457** ( 1.96) 0.50 0.005 ( 0.68) 1.547*** (5.45) 0.409 (1.22) 0.963*** (3.85) 0.153 (0.43) 1.499** ( 2.08) 0.088 ( 0.17) 0.51 Net sell IPOs 0.019** (2.39) 1.732*** (6.16) 0.908*** (3.62) 1.463*** ( 2.92) 0.52 0.020** (2.69) 1.761*** (5.95) 0.156 (0.56) 0.824*** (3.66) 0.149 (0.63) 1.475*** ( 2.99) 0.231 (0.408) 0.52 Net buy IPOs 0.011** ( 1.95) 1.697*** (9.05) 1.382*** (4.41) 0.031 ( 0.77) 0.65 0.006 ( 0.98) 1.681*** (9.72) 0.215 (1.11) 1.279*** (4.61) 0.138 ( 0.780) 0.096 ( 0.24) 0.630** ( 1.94) 0.65
This table reports the results of the following Fama and French (1993) three‐factor model.
Rpt Rf t¼aþbtðRM t Rf tÞ þbt 1ðRM t 1 Rf t 1Þ þgtSM Btþgt 1SM Bt 1þdtHM Ltþdt 1HM Lt 1þeptRpt–rftis the excess return over the risk free rate on a portfolio in time period t, RMt–Rftis the market risk premium in period t, SMBtis the return on smallfirms minus the return on largefirms, and HMLtis the return on high book‐to‐market portfolio minus the return of the low book‐to‐market portfolio and Rftis the 3 months Treasury bill rate. We follow Ritter and Welch (2002) and include also the lagged factors. The return on FTSE All Share Price Index is the market return.No TradeIPOs include 287 IPOs without any insider trades during 36 months period after IPO. The 353Net Buy(190Net Sell) IPOs are IPOs with positive (negative) Net Purchase Ratio,NPR, the difference between total value of purchases and sells divided by total value of shares traded over this 36 months period after IPO. The returns excludefirst day returns. Panel A. reports the returns 36 months after the date of the trade while Panel B. and Panel C. report the 36 months returns after IPO. ***, **,* denotes significant at 0.01, 0.05 and 0.10 level, respectively.
©
2013
Blackwell
Publishing
Ltd
16
Ha
fi
z
Ho
que
and
Meziane
UNCORRECTED PROOFS
Table 5
OLS regressions of 36 months IPO performance
(1) (2) (3) (4) (5) (6) Net buy Net sell No trade
Constant 2.35** (2.86) 2.25** (2.82) 1.79 ** (2.69) 1.86** ( 2.33) 1.78** (2.27) 1.22* (1.92) 2.94** (2.42) 0.84 (0.54) 0.146 (0.09)
NPR transaction 0.33*** ( 4.20) 0.28*** ( 3.79)
NPR value 0.34*** ( 5.42) 0.27*** ( 4.77)
No trade 0.39*** ( 3.78) 0.33** ( 3.36)
Underpricing 0.002** ( 2.31) 0.002** ( 2.11) 0.002 ( 2.81) 0.002** ( 1.97) 0.002* ( 1.83) 0.002** ( 2.48) 0.002* ( 1.87) 0.002 ( 1.53) 0.003** ( 2.11)
Log(size) 0.026 ( 0.79) 0.042 ( 1.23) 0.011 ( 0.37) 0.007 ( 0.23) 0.006 ( 0.18) 0.017 ( 0.65) 0.038 ( 0.81) 0.048 ( 0.67) 0.011 ( 0.17)
Overhang 0.009* ( 1.67) 0.010* ( 1.71) 0.011** ( 2.17) 0.011** ( 1.97) 0.011** ( 1.97) 0.011** ( 2.25) 0.007 ( 1.02) 0.012 ( 1.51) 0.016 ( 1.58)
Prestigious underwriter 0.13 (1.12) 0.16 (1.37) 0.16 (1.41) 0.04 (0.41) 0.07 (0.66) 0.09 (0.88) 0.11 (0.68) 0.25 (1.01) 0.15 (0.55)
VC backing 0.000 (0.001) 0.012 (0.10) 0.07 ( 0.65) 0.13 ( 1.04) 0.13 ( 1.11) 0.15 ( 1.46) 0.074 ( 0.41) 0.16 (0.65) 0.37 ( 1.35)
Lockup expiry return 1.26 (3.10) 1.23 (3.05) 1.02** (2.15) 1.48 (3.80) 1.45 (3.76) 1.01** (2.12) 1.19** (2.08) 1.63 (1.56) 0.56 (0.97)
Log(lockup length) 0.31** ( 2.45) 0.30** ( 2.43) 0.29** ( 2.42) 0.39*** ( 3.09) 0.37*** ( 3.03) 0.30** ( 2.75) 0.46** ( 2.39) 0.03 ( 0.13) 0.012 ( 0.05)
High tech dummy 0.55*** ( 3.19) 0.50*** ( 2.95) 0.57*** ( 4.00) 0.59*** ( 3.69) 0.55*** ( 3.48) 0.60*** ( 4.10) 0.58 ( 2.99) 0.37 ( 1.25) 0.58* ( 1.92)
Bubble dummy 0.49*** ( 3.47) 0.48*** ( 3.48) 0.52*** ( 4.75) – – – 0.46** ( 2.81) 0.58** ( 2.19) 0.39* ( 1.86)
Hot dummy 0.32*** ( 2.62) 031*** ( 2.73) 0.38*** ( 3.34) – – – 0.37** ( 2.22) 0.21 ( 0.97) 0.54** ( 1.98)
Takeover probability 0.007 (0.06) 0.022 (0.19) 0.13 (1.25) 0.06 (0.50) 0.07 (0.62) 0.16 (1.57) 0.03 (0.20) 0.002 (0.009) 0.32* (1.67)
SEO dummy 0.18 (1.17) 0.16 (1.10) 0.09 (0.69) 0.04 (0.32) 0.04 (0.28) 0.007 ( 0.06) 0.11 (0.63) 0.25 (0.93) 0.12 ( 0.47)
Year dummies No No No Yes Yes Yes No No No
Adjusted R2 (%) 12.8 14.5 10.9 19.7 20.6 15.5 8.4 3.1 6.5
This table reports the estimates of OLS regressions where the dependent variable for all regressions is 36 months cumulative abnormal returns for 830 IPOs that went public in London stock exchange from 1999 to 2006.NPR transaction(NPR value)is the number (value) of insider purchases minus the number (value) of insider sells divided by the total number (value) of insider transactions over 36 months after IPO.No Tradeis a dummy equal to 1 if the IPO does not have any insider trades within 36 months of IPO.Underpricingis the percent return on thefirst day from the offer price to the closing price.Sizeis the offer pricetimesshares outstanding in 2008 millions of Pound Sterling constant terms.Overhangis the ratio of proportion retained to proportion sold.Prestigious underwriteris a dummy equal to 1 if the IPO is underwritten by a global underwriter defined in Derrien and Kecskes (2007).VC backedis a dummy equal to one if the IPO is backed by venture capitalists.Lockup exp retis the cumulative abnormal return from 2 toþ2 days around the lockup expiration date.Lockup lengthis the number of days of lockup.High‐tech Dummyis equal to one if the IPO is in computer manufacturing, electronic equipment, computer and data processing services, and optical, medical and scientific equipment.Bubble periodis equal to 1 if the IPO is issued in the 1999–2000 period following Levis (2011).Hot marketis equal to 1 if the IPO is issued during the high volume period of January 1999 to March 2001 and January 2004 to end of 2006.Takeover Probabilityis a Dummy constructed by following Brar et al. (2008).SEO Dummyis equal to 1 if the IPO raised further equity within 3‐years of IPO. Thet–statistics are in parentheses. . ***, **,* denotes significant at 0.01, 0.05, and 0.1 levels, respectively.
©
2013
Blackwell
Publishing
Ltd
Directors
’
Deal
ing
and
Post
‐
IPO
Performance
UNCORRECTED PROOFS
evidence (e.g., Levis, 2011), suggesting that IPOs with highfirst day returns generate lower long‐term returns, in contrast to the predictions of the signalling models (Jenkinson and Ljungqvist, 2001). The results also indicate thatPrestigious UnderwritersandVC backing do not affect performance, in line with Levis (2011), but in contrast to Krishnanet al. (2011). Sizeis negative, but not significant, in contrast to Brav and Gompers (1997) who show that underperformance is concentrated in small firms. We also find a positive relationship between long‐term returns and the lockup expiry dates excess returns, suggesting that IPOs with high abnormal returns on the lockup expiry dates are more likely to have higher long‐ term returns, as insider are unlikely to have sold their holdings after the lockup, and, thus, lower agency conflicts. In addition, theLockup Length,High Tech,Hot marketandBubble dummies, affect negatively the long‐term returns, unlike Levis (2011) who reports a negative, but not significant, coefficient for bubble dummy. In unreported regressions, we include an AIM dummy, however, it is never significant. This is consistent with the univariate results in Panel A, Table 2, where wefind no difference in long term performance in IPOs listed on the AIM and Main Market.We test for liquidity of the shares usingFreefloat, the proportion of money raised in IPO relative to total market value of the company at the time of IPO, and Overhang, defined as shares retained to shares sold. In particular, we assess whetherNet SellIPOs have a higher freefloat, whileNet BuyIPOs have low freefloat, and following the buy trades, liquidity, trading, and research might dry up, and consequently, a drop in the stock price might follow. We find, but not report for space considerations, that free float is significantly correlated withOverhang(r ¼ 0.412, p¼0.000), but not significantly related to our dependent variable,CAR36in all our regressions. We think that the impact of liquidity is better captured by overhang which is significant in (3) to (5), but not in (6) and in the subsample IPOs. Overall, these results suggest that liquidity is less likely to drive our IPOs long‐term returns.
3.6 The determinants of insider trading in IPOs
In this section, we expand our analysis by assessing the likelihood of directors’trading through univariate analysis, and by running a set of logit regressions. We contrast further the fundamental characteristics of IPOs in three different samples:Net Sellvs.No Trade, Net Buyvs.No Trade, andNet Buyvs.Net Sell. Previous studiesfind that insiders do trade on private information (e.g., Seyhun, 1986; Korczaket al., 2010). The question is whether they trade shortly before news announcements and violate insider trading rules, with potential regulatory scrutiny and litigation, as well as potential political and reputational costs,13or whether the abnormal returns reflect the directors’superior knowledge about 13
See Korczak et al. (2010) for a recent review and the specificities of the UK vs. US regulatory regimes and the difficulties in identifying what constitutes private information and an insider, and thus, the complexities in enforcing the insider trading rules. UK regulation prohibits trading by directors who possess any price sensitive information, and insider trading is a criminal offence since the introduction of the Companies Act 1980. Unlike US, UK directors are banned from trading in‘prohibited periods’, which include‘close periods’of up to 60 days associated with earnings announcement, and any periods when there is‘any matter which constitutes inside information in relation to the company’. Directors have also to get clearance from the chairman.
© 2013 Blackwell Publishing Ltd
UNCORRECTED PROOFS
their firms’ prospects, and their ability to recognise pricing errors made by outside investors.We distinguish between these two possibilities by using SEO dummy and takeover dummy to proxy for trading on news releases, since prospects for future deals grows after IPO (Brau and Fawcett, 2006; Bancel and Mittoo, 2009) and, if they trade on mispricing, they are expected to adopt contrarian strategies by buying (selling) stocks with poor (good) past performance (e.g., Jenter, 2005; Lakonishok and Lee, 2001). To capture this effect, we use the cumulative abnormal return 40 days before the trading dates, CAR‐40,‐2,
and market‐to‐book ratio, to assess whether directors buy a stock when it is selling at a low valuation, and sell it when it has a high valuation over a longer horizon.
We also control for other fundamental factors that might affect directors’trading. While Peress (2010) reports thatfirm size affects trading propensity, Seyhun (1986)finds that insiders are more likely to buy in small and sell in large firms. We use the natural logarithm of market capitalisation, defined as the IPO offer pricetimesthe number of shares offered. In addition, previous studies also identified ownership as an additional factor that might affect the propensity of insiders to trade. For example, Ofek and Yermack (2000) report that executives with large shareholdings sell stock after receiving new equity incentives to diversify their portfolios. We useShares Locked,Lockup Length, free float, and Overhang. We control for outside ownership by including in our regressionsInstitutional holdings, andVC backing. We usePrestigious Underwriters,14 Standard Deviation of returns andUnderpricing to proxy for risk as previous studies report that risky IPOs are underpriced more (see Ljungqvist (2007) for a review) and Meulbroek (2000)finds that managers in more risky companies tend to sell equity more aggressively. We use time dummies to control for market conditions.15
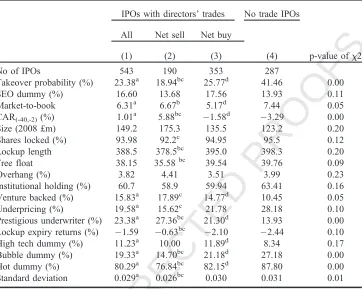
Table 6 reports the univariate analysis. Thefirst column reports the results for all IPOs with directors’ trades. Consistent with the proposition that directors do not trade on private information, IPOs where directors do not trade have a higher takeover probability. Moreover, compared toNo Tradesample, the results show that directors are more likely to trade in IPOs with low underpricing, standard deviation of returns, and market–to‐book, underwritten by prestigious underwriters, and backed by venture capitalists. These IPOs also generate higher returns before the trade and on the lockup expiry date, are high technologyfirms, but less likely to be issued in bubble period. These results appear to suggest that directors are likely to trade in low risk IPOs.
We then focus on differences betweenNet Sell,Net Buy, andNo Tradesamples. The results indicate thatNet SellIPOs have lower freefloat, lockup lengths and risk, higher pre‐trade returns and lockup expiry returns, are more likely to be underwritten by prestigious underwriters, less likely to be issued in bubble and hot periods, or to be taken over thanNet BuyandNo Tradesub‐samples. In addition, they have lower underpricing and fraction of shares locked, and less likely to be backed by venture capitalists, than the
14
Following Derrien and Kecskes (2007) these include global investment banks such as ABN AMRO (Hoare Govett), Cazenove & Co., Credit Lyonnais Securities, Dresdner Kleinwort Wassertein, HSBC Securities, Credit Suisse, Investec Hendersen Crosthwaite securities, KBC Securities, Peel Hunt, Lehman brothers, Nomura, Schroder Salomon Smith Barney, SG securities, UBS, West LB, Merrill Lynch International, Goldman Sachs.
15
Bubble period is 1999–2000 (Levis, 2011), and hot period is high IPO volume in 2000 and 2004–2006.
© 2013 Blackwell Publishing Ltd
UNCORRECTED PROOFS
Table 6Characteristics of IPOs with and without Director Trades within 3‐years of IPO
IPOs with directors’trades No trade IPOs
p‐value ofx2
All Net sell Net buy
(4)
(1) (2) (3)
No of IPOs 543 190 353 287
Takeover probability (%) 23.38a 18.94bc 25.77d 41.46 0.00
SEO dummy (%) 16.60 13.68 17.56 13.93 0.11
Market‐to‐book 6.31a 6.67b 5.17d 7.44 0.05
CAR(‐40,‐2)(%) 1.01a 5.88bc 1.58d 3.29 0.00
Size (2008 £m) 149.2 175.3 135.5 123.2 0.20
Shares locked (%) 93.98 92.2c 94.95 95.5 0.12
Lockup length 388.5 378.5bc 395.0 398.3 0.20
Free float 38.15 35.58bc 39.54 39.76 0.09
Overhang (%) 3.82 4.41 3.51 3.99 0.23
Institutional holding (%) 60.7 58.9 59.94 63.41 0.16
Venture backed (%) 15.83a 17.89c 14.77d 10.45 0.05
Underpricing (%) 19.58a 15.62c 21.78 28.18 0.10
Prestigious underwriter (%) 23.38a 27.36bc 21.30d 13.93 0.00
Lockup expiry returns (%) 1.59 0.63bc 2.10 2.44 0.10
High tech dummy (%) 11.23a 10.00 11.89d 8.34 0.17
Bubble dummy (%) 19.33a 14.70bc 21.18d 27.18 0.00
Hot dummy (%) 80.29a 76.84bc 82.15d 87.80 0.00
Standard deviation 0.029a 0.026bc 0.030 0.031 0.01
This table presents the characteristics of IPOs with and without directors’trades within 3‐years of IPO. The sample includes 287 IPOs without insider trading, and 543 IPOs with insider trading, split into 190Net Selland 353Net Buy
IPOs.Takeover Probabilityis a dummy constructed by following Brar et al. (2008).SEO Dummytakes value of one if the IPO raised further Equity within 3‐years of IPO. CAR(‐40,‐2)are the cumulative abnormal return over pre‐event
window. For the no trade sample, we measure the 39‐day abnormal return as the abnormal return over the whole period standardised to 39 days.Sizeis the market value of equity in 2008 constant terms.Shares lockedis the ratio of shares locked relative to shares sold in the IPO.Lockup lengthis the lockup period in days. Freefloatdefined as the proportion of money raised in IPO relative to total market value of the company.Overhangis the ratio of proportion retained to proportion sold.Institutional Holdingis the proportion of companies where institutions hold more than 3%.
Venture‐backedis the proportion of IPOs backed by venture capitalist.Underpricingis the percent return on thefirst day from the offering price to the closing price.Prestigious underwriteris equal to 1 if a global investment bank defined in Derrien and Kecskes (2007) has underwritten the issue.Lockup expiry returnsis the Cumulative abnormal return over 2 toþ2 around lockup expiration.High‐tech Dummyis equal to one if the IPO is in computer manufacturing, electronic equipment, computer and data processing services, and optical, medical and scientific equipment.Bubble periodis equal to 1 if the IPO is issued in 1999–2000 period following Levis (2011).Hot marketis equal to 1 if the IPO is during January 1999 to March 2001 and January 2004 to end of 2006.Cold marketis the remaining sample period.Standard Deviationof returns is measured across the 36 months after the IPO. We reportp‐
values for the mean difference test between different subsamples.a, b, c, dindicate significant differences between IPOs with insider trading vs.No Trade,Net Sellvs.Net Buy,Net Sellvs.No Trade, andNet Buyvs.No Trade, respectively.
x2 tests for homogeneity across theNo Trade,Net Sell, andNet Buysamples. ***, **, * denotes significant at 0.01,
0.05, and 0.1 levels, respectively.
© 2013 Blackwell Publishing Ltd
UNCORRECTED PROOFS
No TradeIPOs, but a higher risk thanNet BuyIPOs. Compared to theNo TradeIPOs, the Net BuyIPOs are more likely to be underwritten by prestigious underwriters and backed by venture capitalists, more likely to be high tech but less likely to be issued in hot period or to be taken over. They also generate relatively higher returns before the trades, but they have low market‐to‐book ratio, suggesting that they are likely to be undervalued. These results suggest that directors sell in IPOs with relatively shorter lockup lengths and a smaller proportion of shares locked, but they appear to undertake their trades after the lockup expiry date, as the abnormal returns on that date are significantly lower than the remaining IPOs. In addition, they have the best underwriters, have low risk and generate highest returns, suggesting that the underwriters are likely to be happy for them to sell, as the usual negative signal of sell trades is likely to be small. In contrast, theNet BuyIPOs have strong underwriters, but more risky and generate low returns before the trade and their low market‐to‐book ratio suggest that they are undervalued. These results imply that directors buy stocks to support the decrease in prices. Contrary to Seyhun (1986), our results do not suggest that directors buy in small IPOs.Table 7 reports the logit results.16For each group, we run two regressions to account for multicollinearity, particularly betweenSizeandPrestigious Underwriters. In equation (1) and (2), we assess the probability that directors are net sellers by comparingNet SellIPOs, set equal to 1, againstNo TradeIPOs, equal to 0. The results indicate that the pre‐trade stock price performance affect significantly the decision to sell rather than not to trade, in line with previous insider trading literature (e.g., Seyhun, 1986; Korczaket al., 2010). The positive and significant coefficient of CAR(‐40,‐2)suggests that directors sell in IPOs with
significant increase in share prices, 38 trading days before the trade. These results are consistent with the notion that directors adopt contrarian strategies in their sell trades, but they appear to suggest that directors are more concerned with the short‐term run up in share prices rather than the long‐term valuation of their IPO, as the coefficient of market to book,MB, is not significant. Directors are more likely to sell in IPOs that are large, backed by venture capitalists, and where free float is low. Although these results suggest that directors sell in less risky firms, the coefficient of the standard deviation of returns is negative and not significant. The coefficient of the takeover probability is negative and significant, suggesting that directors are less likely to sell on private information for fear of litigation, political and reputational risks. The results based on non‐correlated variables, reported in Equation (2) are relatively similar, except that the coefficient ofPrestigious Underwritersis positive and significant.
Equations (3) and (4) report the results ofNet Buy, relative toNo Trade. Interestingly, while the coefficient of CAR is not significant, that of market to book,MB, is negative and significant, consistent with Lakonishok and Lee (2001) and Jenter (2005), and suggesting that directors buy stocks if they consider that theirfirm is undervalued in the long‐not short‐run. In addition, unlike Net SellIPOs, firm size is positive and AIM dummy is negative, but not significant. However, in line with the first two columns, the results indicate that directors are less likely to buy when the probability of a takeover is high, probably to comply with the legal requirements.
Equations (5) and (6) report the probability ofNet Buyvs.Net Sell. The results are relatively similar to the univariatefindings in Table 5. In particular, the CAR(‐40,‐2)ofNet 16
We include year dummies. Wefind, but not report, similar results usingbubble,hotandhigh techdummies.
© 2013 Blackwell Publishing Ltd