This is a repository copy of
Machine vision image quality measurement in cardiac x-ray
imaging
.
White Rose Research Online URL for this paper:
http://eprints.whiterose.ac.uk/84809/
Version: Accepted Version
Proceedings Paper:
Kengyelics, SM, Gislason-Lee, AJ, Keeble, C et al. (2 more authors) (2015) Machine vision
image quality measurement in cardiac x-ray imaging. In: Proceedings of SPIE 9399, Image
Processing: Algorithms and Systems XIII. SPIE Electronic Imaging, 08-13 Feb 2015, San
Francisco, California, USA. Society of Photo-optical Instrumentation Engineers (SPIE) .
ISBN 9781628414899
https://doi.org/10.1117/12.2083208
[email protected] https://eprints.whiterose.ac.uk/
Reuse
Unless indicated otherwise, fulltext items are protected by copyright with all rights reserved. The copyright exception in section 29 of the Copyright, Designs and Patents Act 1988 allows the making of a single copy solely for the purpose of non-commercial research or private study within the limits of fair dealing. The publisher or other rights-holder may allow further reproduction and re-use of this version - refer to the White Rose Research Online record for this item. Where records identify the publisher as the copyright holder, users can verify any specific terms of use on the publisher’s website.
Takedown
If you consider content in White Rose Research Online to be in breach of UK law, please notify us by
Machine vision image quality measurement in cardiac x-ray
imaging
Stephen M. Kengyelics
a, Amber Gislason-Lee
a, Claire Keeble
a, Derek Magee
b, and Andrew G.
Davies
aa
Division of Medical Physics, University of Leeds, Worsley Building, Clarendon Way, Leeds
LS2 9JT, United Kingdom.
b
School of Computing, University of Leeds, Leeds, LS2 9JT, United Kingdom.
ABSTRACT
The purpose of this work is to report on a machine vision approach for the automated measurement of x-ray image contrast of coronary arteries filled with iodine contrast media during interventional cardiac procedures. A machine vision algorithm was developed that creates a binary mask of the principal vessels of the coronary artery tree by thresholding a standard deviation map of the direction image of the cardiac scene derived using a Frangi filter. Using the mask, average contrast is calculated by fitting a Gaussian model to the greyscale profile orthogonal to the vessel centre line at a number of points along the vessel. The algorithm was applied to sections of single image frames from 30 left and 30 right coronary artery image sequences from different patients. Manual measurements of average contrast were also performed on the same images. A Bland-Altman analysis indicates good agreement between the two methods with 95% confidence intervals -0.046 to +0.048 with a mean bias of 0.001. The machine vision algorithm has the potential of providing real-time context sensitive information so that radiographic imaging control parameters could be adjusted on the basis of clinically relevant image content.
Keywords: cardiac, x-ray, contrast, machine vision.
1. INTRODUCTION
In the year 2012 ischaemic heart disease was the main cause of death worldwide claiming an estimated 7.4 million lives.1 Percutaneous coronary intervention (PCI) is an effective, minimally invasive, treatment for cardiovascular
disease resulting from a narrowing of coronary arteries that works by mechanically improving the flow of blood to the heart.2–4
PCI procedures may involve several stages. Initially, a clinician visually inspects moving real-time images of the coronary arteries using anangiogram, where the blood vessels are made opaque to x-rays by introducing an iodine-based contrast agent into the vessel lumen, as illustrated for a single image frame in Figure(1). If any clinically significant narrowing of an artery is found anangioplasty is performed. Angioplasty involves the placement of a small specialized balloon inside the lumen of the vessel at the sight of the stenosis and expanding it to widen the affected area. This procedure is often followed by the placement of astent, an expandable metal mesh, that provides a durable mechanical support to the vessel wall, while providing improved blood supply to the heart muscle tissue.
During these procedures the blood vessels are accessed by thin metal tubes, calledcatheters, that are inserted via the femoral artery of the leg, or the radial artery of the arm, through an opening created by making a small incision on the surface of the skin. Throughout the entire PCI procedure the clinician relies on real-time x-ray images displayed on a monitor in the examination room.
Figure 1. Single frame from a left coronary angiogram sequence.
[image:3.595.159.422.418.648.2]The critical dependence on x-ray imaging to visualize coronary arteries during PCI procedures requires the use of ionizing radiation and its concomitant hazard to both patients and staff.5, 6 Lowering radiation dose is
advantageous, but any arbitrary reduction may result in deterioration of diagnostic visual information that may compromise patient care.7
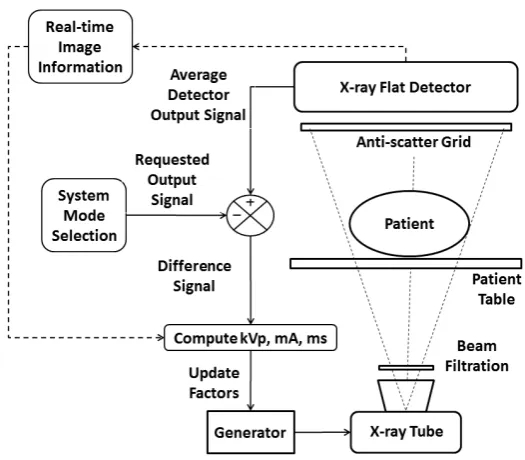
Currently most modern cardiac x-ray imaging systems regulate their radiation output by adjusting a number of system parameters to seek to maintain a constant average output signal from the x-ray detector as depicted in Figure (2).
Referring to Figure (2), if the average output of the x-ray detector decreases with respect to that requested, a difference signal is generated that is used to recalculate a new set of system parameters that will increase the output of the x-ray source in such a way as to reduce the difference signal to zero. While this form of automatic dose control (ADC) scheme is effective, it is somewhat limited in that it principally only accounts for the x-ray attenuation properties of the patient and not the requirements of the clinical imaging task.
The purpose of this work was to investigate a machine vision approach for the automated measurement of x-ray image contrast of coronary arteries filled with iodine contrast media during interventional cardiac procedures. If successful, the algorithm could provide real-time context based image information to augment the existing ADC control strategy.
The contrast of iodine filled blood vessels defines how well the vessel structures stand out from surrounding anatomy and is a key component for producing high-quality diagnostically acceptable cardiac images. Notionally, the higher the level of contrast the better the vessels are visualized, leading to greater diagnostic utility that might be referred to asimage quality in this context.
Iodine contrast is clearly not the only important aspect of image quality for cardiac imaging. Image noise, spatio-temporal resolution properties, and the application of specialist image process are also critically important. We selected iodine contrast for our initial investigation, as the x-ray imaging system has several convenient degrees of freedom by which to influence it, including the x-ray tube voltage (kVp), x-ray beam filtration, the source-to-detector distance (which influences scatter and, therefore, contrast), and the anti-scatter grid.
2. METHODS AND MATERIALS
2.1 Data acquisition
Digital cardiac image sequences were obtained from a modern cardiac x-ray imaging system used routinely for PCI procedures in the Leeds General Infirmary, United Kingdom (Allura FD10, Philips Healthcare).
The sequences were acquired prior to the application of any non-linear image processing algorithms via a propriety data capture device installed by the manufacturer. The only processing applied, prior to capture, was linear scaling and a dynamic range compression look-up table. The images chosen came from different patient examinations and comprised 30 left coronary artery (LCA) and 30 right coronary (RCA) sequences, acquired at 15 frames per second, using digital-acquisition mode (historically referred to ascine mode). The image sequences chosen did not contain any additional catheters, guide wires or other surgical devices other than the main catheter used to introduce the iodine contrast agent.
2.2 Measurement algorithm description
A machine vision algorithm was developed to measure the contrast and of iodine blood vessels in cardiac x-ray image sequences using MATLAB.8 The algorithm can be broken down into the following stages: image data
pre-processing, candidate vessel location, and vessel contrast estimation.
2.2.1 Image data preprocessing
Each image sequence contained approximatley 30-50 image frames of 1024×1024 pixels. The digital values were
2.2.2 Candidate vessel location
A Frangi filter9 was applied to the image sequence at five different scales to cover the vessel sizes of interest.
The algorithm returns a number of responses, including a direction image that contains the orientation of the eigenvectors for each scale. The variation of the values within the direction image corresponding to the location of vessels was found to be minimal in multiple images, in comparison to all other locations. A binary mask image of the detected vessel locations was generated by applying a threshold to a standard deviation map of the direction image for a local regions of interest of 3×3 pixels. The binary mask had noise removed and the
regions representing the vessel locations were reduced to a skeleton using standard morphological operations. At this stage bifurcations in the mask and regions around them are removed as only measurements across single unobstructed sections of vessel were of interest. Any non-zero points in the resulting skeleton image represent candidate points for the center-lines of vessel segments. An ordered set of coordinates of non-zero points were generated per vessel, such that the first and last points for each vessel corresponded to the start and finish of the vessel and the intermediate points were sorted sequentially according to their position along its length.
2.2.3 Contrast estimation
Contrast is defined here according to Equation (1), wheresis the peak digital value of the vessel profile and b
is the average digital value of the surrounding area.
C=s−b
b (1)
At each sample point, an estimate of the contrast was made by fitting a Gaussian curve to a profile of the vessel that is orthogonal to the center-line of the vessel by means of the non-linear least-squares Levenberg-Marquardt algorithm. The form of the Gaussian curve is shown in Equation (2), whereais a parameter associated with the height of the profile,xis the independent variable, andb andcare parameters associated with the displacement and width of the profile respectively.
y=ae−(
x−b
c )2 (2)
The profile selected for each sample point was orthogonal to the center-line of the vessel in the vicinity of the sample point. An inital estimate of the width of the vessel profile was provided to the fitting algorithm from the width of the binary mask image measured at the same location and in the same orientation. The length of the profile provided for the curve fit was defined as being twice that of the width estimate. Prior to curve fitting the digital values are normalised to unity and inverted according to Equation(3), where D is digital values of the profile,x the displacement, and P the digital values of the resulting profile, such that when fitted by the Gaussian profile, the parameterain Equation(2) represents the contrast estimate of the vessel.
P(x) = 1− D(x)
Dmax
(3)
2.3 Algorithm testing
The first criteria was tested by running the algorithm on the 60 test image sequences. Each sequence was then displayed to a user a single frame at a time. The positions of iodine filled coronary arteries identified by the algorithm were overlaid as coloured contour lines on the display along with a numeric graticule. The user recorded the approximate total length of the longest vessel either fully or partially identified by the algorithm and the length of the identified portion of that vessel.
For the second criteria, the algorithm was used to measure the contrast level of single sections of iodine vessel in regions of interest of 100×100 pixels from a single image frame extracted from each of 60 test sequences.
For each image the algorithm automatically located the vessel, estimated the center-line of the vessel, performed the Gaussian curve fit and calculated the contrast at all the sample points along the length of the vessel. The contrast results were then averaged for all the sample locations within the bounded area. The number of contrast results averaged in each region was in the order of 30–50.
For each of the regions of interest the vessel contrast was measured using a manual technique for a total of 10 sample locations along the vessel center-line and the results averaged. The manual technique used a software-based measurement tool that allows a user to position lines and markers overlaid on the image frames displayed on-screen, and to generate and measure profiles generated against numeric scales. For each image, the user marked the edge of the vessel boundary by inspection and then defined a center-line equidistant from each boundary. Ten equally spaced sample points were marked along the center-line within the bounded region of interest and orthogonal profiles generated at these locations. The profile values were transformed according to Equation(3) and displayed as a graph of contrast against displacement. The user estimated the peak contrast level from an overlaid numerically labelled graticule.
3. RESULTS
In the case of the first test criteria, the algorithm automatically located a minimum of 75% of the length of one section of iodine filled coronary artery, in every image frame of a sequence if present, in all cases for the 60 test image sequences examined.
In the case of the second test criteria, for all image frames and for each method no less than 10 repeated measurements were performed within the region of interest defining an iodine filled blood vessel, and in the case of the machine vision algorithm significantly more repeated measurements were made.
For all contrast measurements the standard deviation was less than 0.05, indicating good reproducibility for both measurement methods and supporting the assumption that the profile of the vessel did not change significantly over the small pre-defined regions of interest.
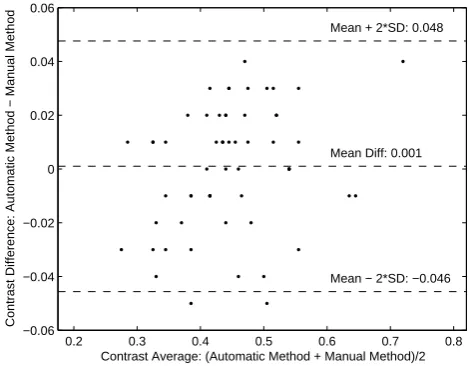
Figure (3) shows a Bland-Altman plot comparing the two methods, indicating a mean bias of 0.001. The 95% confidence limits: -0.046 to 0.048 are approximately what would be expected from the standard deviation of the individual measurements.
4. DISCUSSION AND CONCLUSIONS
The overall aim for developing the automatic machine vision algorithm to measure the contrast in iodine filled coronary arteries, was with a view to providing context sensitive imaging information, for use in the dose control feedback system of a modern cardiac imaging system.
0.2 0.3 0.4 0.5 0.6 0.7 0.8 −0.06
−0.04 −0.02 0 0.02 0.04 0.06
Mean + 2*SD: 0.048
Mean − 2*SD: −0.046 Mean Diff: 0.001
Contrast Average: (Automatic Method + Manual Method)/2
[image:7.595.171.406.112.295.2]Contrast Difference: Automatic Method − Manual Method
Figure 3. Bland-Altman plot comparing the machine vision algorithm with a manual measurement technique
ACKNOWLEDGMENTS
This work has been performed in the project PANORAMA, funded by grants from Belgium, Italy, France, the Netherlands, and the United Kingdom, and the ENIAC Joint Undertaking.
REFERENCES
[1] World Health Organisation, “The top 10 causes of death, Factsheet no 310.” http://www.who.int/ mediacentre/factsheets/fs310/en/#(May 2014). Accessed 17th June 2014.
[2] Ludman, P., [National Audit of Percutaneous Coronary Interventional Procedures Public Report], British Cardiovascular Intervention Society (2011).
[3] Grech, E., “Percutaneous coronary intervention. I. History and development,”Brit. Med. J.326, 1080–1082 (2003).
[4] Grech, E., “Percutaneous coronary intervention. II. The procedure,”Brit. Med. J.326, 1137–1140 (2003). [5] Eisenberg, M. J., Afilalo, J., Lawler, P. R., Abrahamowicz, M., Richard, H., and Pilote, L., “Cancer risk
related to low-dose ionizing radiation from cardiac imaging in patients after acute myocardial infarction,”
CMAJ183(4), 430–436 (2011).
[6] ˘Zontar, D., Kuhelj, D., ˘Skrk, D., and Zde˘sar, U., “Patient peak skin doses from cardiac interventional procedures,”Radiat. Prot. Dosim.139, 162–165 (2010).
[7] Gislason-Lee, A. J., Cowen, A. R., and Davies, A. G., “Dose optimization in cardiac x-ray imaging,”Med. Phys.40, 091911–1–11 (2013).
[8] MATLAB, [Version 8.3.0.532 (R2014a)], The MathWorks Inc., Natick, Massachusetts (2014).