(2015); e02714
Published online 21 April 2015 in Wiley Online Library (wileyonlinelibrary.com). DOI: 10.1002/cnm.2714
A 1D pulse wave propagation model of the hemodynamics of calf
muscle pump function
J. M. T. Keijsers
1,2,*,†, C. A. D. Leguy
1, W. Huberts
2,3, A. J. Narracott
4,5, J. Rittweger
1and F. N. van de Vosse
21Institute of Aerospace Medicine, German Aerospace Center, Cologne, Germany
2Department of Biomedical Engineering, Eindhoven University of Technology, Eindhoven, The Netherlands 3Department of Biomedical Engineering, Maastricht University, Maastricht, The Netherlands 4Medical Physics Group, Department of Cardiovascular Science, University of Sheffield, Sheffield, UK
5INSIGNEO Institute forin silicoMedicine, University of Sheffield, Sheffield, UK
SUMMARY
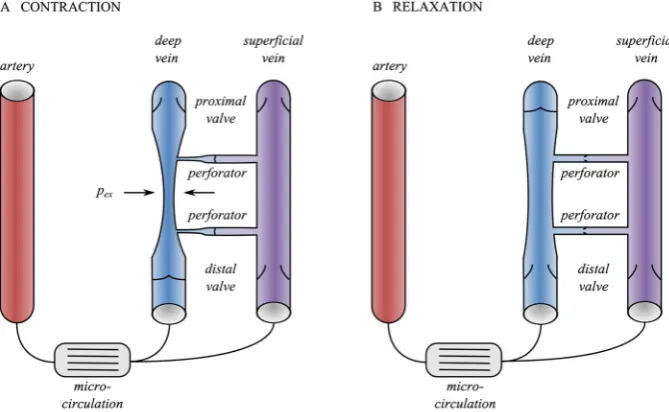
The calf muscle pump is a mechanism which increases venous return and thereby compensates for the fluid shift towards the lower body during standing. During a muscle contraction, the embedded deep veins collapse and venous return increases. In the subsequent relaxation phase, muscle perfusion increases due to increased perfusion pressure, as the proximal venous valves temporarily reduce the distal venous pressure (shielding). The superficial and deep veins are connected via perforators, which contain valves allowing flow in the superficial-to-deep direction. The aim of this study is to investigate and quantify the physiological mechanisms of the calf muscle pump, including the effect of venous valves, hydrostatic pressure, and the superficial venous system. Using a one-dimensional pulse wave propagation model, a muscle contraction is simulated by increasing the extravascular pressure in the deep venous segments. The hemodynamics are studied in three different configurations: a single artery–vein configuration with and without valves and a more detailed configuration including a superficial vein. Proximal venous valves increase effective venous return by53% by preventing reflux. Furthermore, the proximal valves shielding function increases perfusion following contraction. Finally, the superficial system aids in maintaining the perfusion during the contraction phase and reduces the refilling time by37%. © 2015 The Authors.International Journal for Numerical Methods in Biomedical Engineeringpublished by John Wiley & Sons Ltd.
Received 6 November 2014; Revised 6 February 2015; Accepted 4 March 2015
KEY WORDS: muscle pump; collapsible vein; gravity; 1D pulse wave propagation; venous valves; orthostatic intolerance
1. INTRODUCTION
Orthostatic intolerance is observed in astronauts after spaceflight [1], in patients with spinal cord injury [2], in de-conditioned subjects, for example, after bed rest [3], and is strongly associated with aging [4]. In the upright position, orthostatic intolerance may result in critical events such as syncope. Because of their high compliance and high storage capacity, veins are believed to play a major role in blood volume shifts from the upper towards the lower body, which is associated with orthostatic intolerance [5]. In healthy subjects, this fluid shift is compensated for by among others maintaining venous return, whereas venous return is impaired in patients with orthostatic
*Correspondence to: J. M. T. Keijsers, Institute of Aerospace Medicine, German Aerospace Center, Linder Höhe 1, 51147 Cologne, Germany.
†E-mail: [email protected].
intolerance. Venous return can be restored by muscle contraction in the lower limb, which promotes emptying of the venous system. Therefore, improved understanding of the muscle pump effect on lower limb hemodynamics is important to better comprehend the sources of orthostatic intolerance. The muscle pump is a mechanism that promotes venous return via muscle contraction (Figure 1). During muscle contraction, the extravascular pressure increases and exceeds the intravascular pres-sure, resulting in the collapse and emptying of the embedded deep veins [6–8]. Unidirectional flow is guaranteed by the presence of distal venous valves. During muscle relaxation, the pressure in the deep veins drops and the deep veins refill from the micro-circulation, resulting in distal valve open-ing and proximal valve closure, preventopen-ing reflux [6]. In the upright position, the refillopen-ing time is expected to decrease due to increased perfusion pressure, as closure of the proximal venous valves reduces the distal venous pressure (shielding) [9]. It is hypothesized that superficial veins, connected to the deep veins by perforating veins, might further promote the efficiency of the muscle pump. Additional valves in the perforating veins allow flow only in superficial-to-deep direction [10] and, as a consequence, promote venous return during contraction and venous filling during the relaxation phase. The collapsibility of the veins and the dynamics of the venous valves, that direct the blood towards the heart and shield hydrostatic pressure, are believed to be the main physiological factors in the muscle pump effect [7].
[image:2.595.127.462.438.644.2]In this study, venous hemodynamics during muscle contraction and relaxation are investigated using a mathematical modeling approach that enables simultaneous analysis of venous collapse and valve dynamics. Furthermore, it allows study of the influence of independent parameter vari-ation. A one-dimensional pulse wave propagation model is used, which has been well-established to examine and predict arterial hemodynamics [11–14] but has only been applied in few studies to model venous hemodynamics [15, 16]. Modeling venous hemodynamics is challenging because, in contrast to arteries, vessel collapsibility and venous valves are important for many applications. Furthermore, more anatomical variation is present in the venous system, for example, the deep and superficial veins. Most models of venous hemodynamics account for the venous collapsed state under negative transmural pressure by interpreting the collapsible tube law as a non-linear cross-sectional area-pressureA,p-relation [17–19]. In addition to collapsibility, changes in hydrostatic pressure between supine and upright positions are also important when considering fluid volume
Figure 1. Schematic representation of the muscle pump effect during the contraction (A) and relaxation (B) phases. During contraction, the deep vein collapses due to the extravascular pressure pex exceeding the intravascular pressure. Venous return is increased, whereas backflow and flow to the superficial sys-tem is blocked by the distal and perforator valves. During relaxation, the deep vein is refilled from both the artery and the superficial vein, while the perforator valves open and the proximal valve is closed to
shifts and therefore cannot be ignored as is common in arterial models. Gravity has been included in lumped-parameter models using an additional pressure source [20] and can straightforwardly be included in the momentum equation of 1D pulse wave propagation models [21], resulting in a continuous gravity field. The inclusion of venous valves within such models allows the transient shielding of hydrostatic pressure to be simulated [22] and their action to prevent backflow. Valves are often represented by a perfect diode in circulatory models [23], whereas more detailed mod-els include gradual opening and closing behaviors based on the transvalvular pressure drop [24] or force balance on the valve leaflets [25].
Numerical studies of the muscle pump have been reported by Marchandiseet al.[21] and Fullana and Zaleski [26]. Marchandise et al. [21] simulated the contraction phase of the muscle pump considering changes in cross-sectional area and wave speed of a collapsing tube, which were vali-dated againstin vitromeasurements. A normal and pathological case were simulated by inclusion and exclusion of a venous valve in the distal boundary conditions. Fullana and Zaleski [26] per-formed a computational study of the muscle pump, including a more extensive anatomy of the venous system, and although they did include valves, they did not examine resulting valve dynam-ics. Although these studies have been able to model specific venous physiology, an analysis of venous valve dynamics combined with an increased perfusion pressure and the communication of deep and superficial venous systems during a muscle contraction has, to our knowledge, not yet been undertaken.
Therefore, the aim of this study is to investigate the physiological mechanisms of the calf mus-cle pump and its effect on venous return in the upright position using a modeling approach. The 1D pulse wave propagation model of Kroonet al.[27] is extended to include venous properties: a col-lapsible tube law is implemented to account for the non-linearA; p-relation, gravity is included in the momentum equation to account for the hydrostatic pressure, and venous valves are included to prevent backflow. We will show how the model can be used to explain the different physiological mechanisms of muscle pump function, including the effect of (1) venous valves, (2) hydrostatic pres-sure, and (3) the deep and superficial venous systems. In three configurations with different levels of detail, muscle contraction and relaxation will be simulated by applying changes in extravascular pressure to study the valve dynamics and the hemodynamics.
2. METHODS
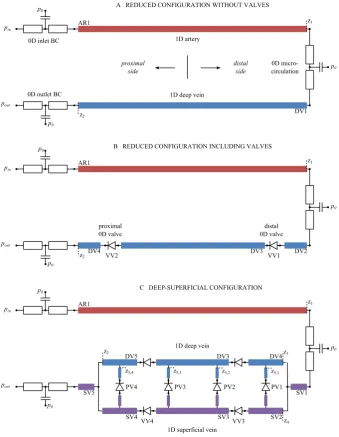
To study calf muscle pump function, a numerical model of the arteries and veins in the calf was built. The calf muscle is perfused mainly by three arteries: peroneal, anterior tibial, and posterior tibial, which are each associated with two veins [10]. Apart from these vessels, all embedded in the calf muscle, a superficial system, of which the great and small saphenous veins are the largest vessels, supplies the skin with blood [10]. The superficial veins are connected to the deep venous system by a varying number of perforating veins, which contain venous valves that open to allow flow towards the deep venous system [10]. The model used in this study contains all of these types of vessels. However, to reduce the complexity of the system, but retain all essential elements, a generic approach is chosen and one vessel of each type was included. Also, for the inclusion of venous valves, a generic approach is chosen, by including a single proximal and distal valve for each deep and superficial vein and one valve in each perforating vein.
Figure 2. Three different model configurations: (A) reduced configuration without valves, (B) reduced configuration including valves, and (C) deep-superficial configuration. All three configurations consist of different elements: 1D arteries (AR), and deep (DV) and superficial veins (SV), 0D venous valves (VV), micro-circulation, and inflow and outflow boundary conditions (BC). The length and radius of the 1D elements are not to scale (geometrical parameters of all 1D segments can be observed in Table I). The
z-positions indicate the locations where the flows are determined as explained in Section 2.8.
2.1. 1D pulse wave propagation:arteries and veins
The relation between pressure and flow in the large arteries and veins are based on the one-dimensional equations of mass and momentum balance [11, 28]:
C@ptr @t C
@q
@´ D 0; (1)
@q @t C
@Av2´ @´ C
A
@p @´ D
2a
Table I. Geometrical parameters of the different vessels [16] as depicted in Figure 2.
Vessel Numbering (Figure 2) Radius [mm] Length [cm] Configuration (Figure 2)
artery AR1 2.5 34 A,B,C
deep vein DV1 1.5 34 A
DV2 1.5 4 B
DV3 1.5 24 B,C
DV4 1.5 4 B
DV5 1.5 2 C
DV6 1.5 2 C
superficial vein SV1 3.5 2 C
SV2 1.5 2 C
SV3 1.5 24 C
SV4 1.5 2 C
SV5 3.5 2 C
venous valves VV1 1.5 1 B,C
VV2 1.5 1 B,C
VV3 1.5 1 C
VV4 1.5 1 C
perforating vein PV#-S 0.5 1 C
PV#-V 0.5 1 C
PV#-D 0.5 1 C
The four perforating veins contain a valve (PV#-V), a deep (PV#-D), and a superficial (PV#-S) vein of which the parameters are noted separately.
whereC is the compliance per unit length,ptr is the transmural pressure, t is the time,q is the flow, and´is the axial coordinate. Additionally, in the momentum balance equation,A DA.ptr/ is the cross-sectional area,v´is the velocity in z-direction averaged over the cross-sectional area, pis the intravascular pressure,a D pA= is the radius, and is the density of the blood. The wall shear stress is given byw, andg´ D gez is the contribution of gravitational acceleration
in the z-direction, wheregis the gravity vector. The wall shear stress and non-linear convection term are estimated using the approximated velocity profile of Bessemset al.[29]. The gravity term is included in the derivation of the velocity profile. The resulting wall shear stress and non-linear convection term are as follows:
wD 2 1c
q A C
a
4.1c/
²
@p @´ g´
³
and Av2´ı1 q2
A; (3)
whereis the dynamic viscosity,c is the dimensionless core thickness, andı1a function ofc. To solve the aforementioned equations, a constitutive law relating cross-sectional area and pressure is needed for both arteries and veins.
2.2. Constitutive law for arteries
To capture the mechanical behavior of the arterial wall, the system of equations is completed with a linearA; p-relation for the arteries:
ADAref,artCC .ptrpref,art/ ; (4)
whereAref,art is the cross-sectional area at reference pressurepref,art, andC is the linearized com-pliance per unit length around reference pressure pref,art. The compliance is determined using thin-walled-cylinder theory for a linear isotropic elastic material:
C D @A
@ptr ˇ ˇ ˇ ˇ
ˇptrDpref,art D
212a30
hE ; (5)
wherea0 D p
Aref,art= is the reference radius, is the Poisson’s ratio,h a0=10is the vessel
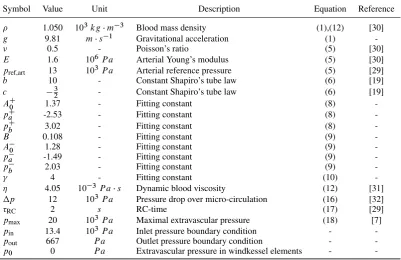
Table II. Constant model parameters.
Symbol Value Unit Description Equation Reference
1.050 103kgm3 Blood mass density (1),(12) [30]
g 9.81 ms1 Gravitational acceleration (1)
0.5 - Poisson’s ratio (5) [30]
E 1.6 106P a Arterial Young’s modulus (5) [30]
pref,art 13 103P a Arterial reference pressure (5) [29]
b 10 - Constant Shapiro’s tube law (6) [19]
c 32 - Constant Shapiro’s tube law (6) [19]
AC0 1.37 - Fitting constant (8)
-pCa -2.53 - Fitting constant (8)
-pCb 3.02 - Fitting constant (8)
-B 0.108 - Fitting constant (9)
-A0 1.28 - Fitting constant (9)
-pa -1.49 - Fitting constant (9)
-pb 2.03 - Fitting constant (9)
4 - Fitting constant (10)
4.05 103P as Dynamic blood viscosity (12) [31]
p 12 103P a Pressure drop over micro-circulation (16) [32]
RC 2 s RC-time (17) [29]
pmax 20 103P a Maximal extravascular pressure (18) [7]
pin 13.4 103P a Inlet pressure boundary condition -
-pout 667 P a Outlet pressure boundary condition -
-p0 0 P a Extravascular pressure in windkessel elements -
-2.3. Constitutive law for veins
As the internal venous pressure is very low, the influence of the extravascular pressure on the mechanical behavior of the venous cross-sectional area is significant, and even negative transmural pressure can be reached, resulting in venous collapse. As the mechanical behavior of the venous wall is non-linear in this transmural pressure range, the proposed relation for the arteries can no longer be used. Therefore, Shapiro [19] derived the following relation to capture the collapse of the veins based onin vitromeasurements.
ptrDKp
.A=Aref,ven/b.A=Aref,ven/c
; (6)
whereKpis the bending stiffness, andb andc are constants that determine the shape of the tube law. To obtain a relation that captures the behavior described by Equation 6 but cast in an A; p-relation, Equation 6 is approximated by the following expression, which has a continuous first order derivative.
ADAref,ven
®
h.p/fC.p/C.1h.p//f.p/¯; (7)
whereAref,venis the reference cross-sectional area at zero transmural pressure, andpDptr=Kpis the dimensionless pressure. The functionsfCandfare fits of the positive and negative pressure part of the original tube law of Shapiro [19], andh.p/is a scaling function.
fC.p/D A C
0
tan
1 ppaC pbC
!
C
2
!
; (8)
f.p/DBC A
0
tan1
ppa p
b
C
2
; (9)
and h.p/D 1
tan1
p
C
2
whereB,A0,pa,pb,AC0,paC,pCb, andare fitting constants determining the shape of theA; p-relation. Venous compliance is calculated as the derivative ofA with respect to ptr. Superficial veins differ from deep veins as they are less influenced by a muscle contraction, which is included in the model by applyingpex only to the deep veins. Figure 3 shows a comparison between this approximation and the Shapiro tube law.
2.4. 0D venous valves
The different states of the venous valves result in changes in resistance to flow. This is included in the model using a diode with an extra inertial term to represent the inertia of the blood. The pressure–flow relation within the valve region is defined as follows:
pDL@q
@t CRq; (11)
whereLis the inertance andRis the resistance, defined to be equal to a Poisseuille resistance in open state and very large in closed state.
LD leff
A0
and RD 8leff
A2eff (12)
where the effective cross-sectional areaAeffis
AeffD ²
A0 if the valve is open
1106A0 if the valve is closed ; (13)
whereleff D 5a0 is an effective length, representing the geometrical region in which the inertial forces are dominant due to the presence of the valve, and cross-sectional areaA0is taken equal to the reference cross-sectional area of the connecting venous elements. Opening occurs on a positive transmural pressure difference and the closure on negative flow.
2.5. 0D micro-circulation
To capture the pressure drop and the storage capacity of the micro-circulation. a windkessel element consisting of two resistancesRwk,i(iD1; 2), and a complianceCwkconnected to the extravascular pressurep0is used, described by
pRDRwk,iq;
@ptr @t D
1 Cwk
q; (14)
where the first resistanceRwk,1is set equal to the characteristic wave impedance of the connecting arterial element given by
Rwk,1 D
r
A0C
: (15)
−20 −15 −10 −5 0 5
0 0.5 1 1.5
Cross−sectional area [−]
Pressure [kPa] Shapiro tube law
[image:7.595.141.463.541.692.2]Fit
The total resistance is defined by the ratio of the pressure drop over the micro-circulation pdivided by the mean baseline flowq
Rwk,totDRwk,1CRwk,2D
p
q : (16)
Baseline flow is defined as16of a population averaged femoral artery flow of 2.78 mL/s [33], because only one of the six deep veins is included in the geometry. When the superficial system is included,
1
3 of the femoral artery flow is used in order to maintain the same baseline flow in the deep vein. Finally, the compliance of the micro-circulation is computed based on a representative value of the time constantRC, defining the decay of the pressure wave in diastole [11]
RC DRwk,2Cwk: (17)
The extravascular pressure of the micro-circulation is set top0.
2.6. 0D boundary conditions
The arterial inlet and venous outlet are both connected to windkessel elements with the same form as that of the micro-circulation. To avoid reflections of the higher order harmonics, the resistance connected to the 1D element is calculated using Equation 15, the second resistance is set equal to the first one, and the compliance is again calculated using Equation 17. It is noted that the windkessel elements are not included to represent the vascular tree attached to the reduced circulation, and therefore, the true value of the second resistance is of minor importance. The extravascular pressure of the inlet and outlet boundary condition is set top0. Inlet and outlet boundary conditions are set to a constant pressurepinandpout, respectively, to simulate the pressure gradient between the arterial and venous circulation.
2.7. Muscular extravascular pressure
The extravascular pressure generated during the muscle contraction is applied to the deep venous elements and not to the artery and superficial vein, as the embedded artery is assumed to be less influenced due to its high intravascular pressure. Furthermore, the influence of muscle contraction on the superficial vein is assumed to be negligible compared with the influence on the deep vein due to the location of the superficial vein in the skin. The prescribed extravascular pressure is assumed to be
pex,venDpmaxk.t /m.´/; (18)
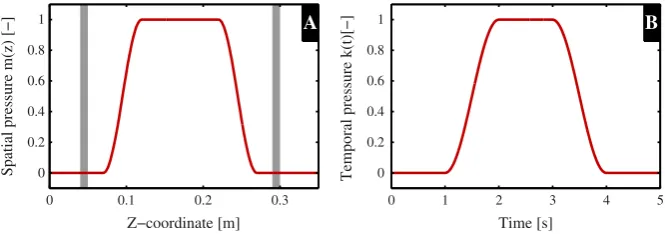
wherepmaxis the maximal value of extravascular pressure,k.t /the temporal course of the extravas-cular pressure, andm.´/the spatial course of the extravascular pressure. The spatial and temporal variations in extravascular pressure are shown in Figure 4, and the full equations ofk.t /andm.´/ are given in the Appendix A.
2.8. Numerical implementation and post-processing
The governing equations described in Section 2.1–2.7 were solved numerically using the finite element package SEPRAN (Ingenieursbureau SEPRA, Leidschendam, The Netherlands) with the reduced complexity method as described by Kroonet al.[27]. A second-order backward difference scheme was used for time discretization with timestepdt D1ms. The trapezium rule was used for spatial integration withd´D10mm for arterial and superficial venous elements andd´D1mm for deep venous elements, as the spatial transmural pressure gradient can be much higher in the deep venous elements due to the prescribed muscle contraction. Pre-processing and post-processing was performed using MATLAB R2012b (MathWorks, Natick, MA, USA).
Spatial pressure m(z) [−]
Z−coordinate [m]
A
0 0.1 0.2 0.3
0 0.2 0.4 0.6 0.8 1
0 0.2 0.4 0.6 0.8 1
Temporal pressure k(t)[−]
Time [s]
B
[image:9.595.132.465.71.188.2]0 1 2 3 4 5
Figure 4. Extravascular pressure of the deep veins is increased to simulate a muscle contraction. Plot A and B show the spatialm.´/and temporalk.t /courses of extravascular pressure as applied to the deep venous elements, respectively (see Appendix A for the full equations ofm.´/andk.t //. The gray areas in the spatial
plot indicate the location of the venous valves.
relaxation, called perfusion volumeVPE, was calculated as a measure of the increase in perfusion. The increase in venous return during the contraction phase is captured in the additional volume that leaves the deep vein, called venous returnVVR. Finally, the reflux volume VREwas calculated as a measure for the volume that refills the veins from the proximal side of the vein, decreasing the effective venous return.VPE,VVR, andVREwere calculated using the following relations:
VPED Z tend
tDt0
.qartqart,bl/dt forqart> qart,bl; (19)
VVRD Z tend
tDt0
.qvenqven,bl/dt forqven> qven,bl; (20)
VRED Z tend
tDt0
.qven/dt forqven < 0; (21)
whereqart is the arterial flow into the micro-circulation (at position ´1 in Figure 2),qart,bl is the arterial flow just before the onset of the contraction (t D 1s),qven is the venous flow at the end of the deep vein (at position´2 in Figure 2), and qven,bl is the venous flow just before the onset of the contraction (t D 1s). Furthermore, to determine the time needed for the deep vein to refill during relaxation, an estimate for the refilling timetfillwas determined from the start of relaxation (t D3s) until the volume of the deep vein reached95% of the baseline volume. Finally, to measure the decrease in arterial inflow due to contraction, the change in arterial inflow qart was calcu-lated relative to the arterial baseline flowqart,bl. As the computational domain only covered a small part of the calf circulation, relative changes of the previously defined parameters were used to pro-vide an indication of the magnitude of changes between different configurations. Additionally, deep and superficial venous inflows were determined at location´3 and´4, respectively (Figure 2). The perforating inflow was calculated as the sum of the flows at locations´5.
2.9. Simulations and analysis
To demonstrate that the model is able to capture the different aspects of the muscle pump effect, the following comparisons were made:
Venous collapsibility: Collapse was demonstrated using a reduced geometry without valves in the supine position as in Figure 2A.
Effect of venous valves: To demonstrate that the venous valves prevent backflow in both the contraction and relaxation phases, a muscle contraction was simulated in a reduced configu-ration with and without valves (see Figure 2B and A, respectively), both configuconfigu-rations in the supine position.
Effect of superficial system: The complex venous system was compared with the reduced geometry in the upright position (see Figure 2C and B, respectively) to investigate the influence of the superficial system on the valve dynamics and the hemodynamics.
3. RESULTS
The hemodynamics during a muscle contraction are reported using the different model configu-rations shown in Figure 2. The results are reported in four sections which examine the course of the deep venous collapse, the effect of venous valves, the effect of hydrostatic pressure, and the importance of the superficial system, respectively.
3.1. Venous collapsibility
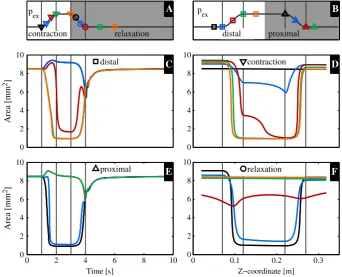
The time and spatial courses of venous collapse during a muscle contraction are studied in the con-figuration without venous valves (Figure 2A). The temporal and spatial plots of the cross-sectional area of the deep vein at several axial positions and time points, respectively, are shown in Figure 5. For clarity, the temporal plots (Figure 5C and E) are split into the distal and proximal regions, and the spatial plots (Figure 5D and F) are split into time points during contraction and relaxation.
During the contraction phase in the temporal plot (1s 6t 6 2s, Figure 5C and E), it can be observed that the collapse starts at the proximal side, as the blue and black curves in the proximal plot show a higher gradient than the green and orange curves in the distal plot. Furthermore, the uncollapsed proximal and distal parts of the vein increases in the cross-sectional area during the
roximal
B
contraction D
0 2 4 6 8 10
Z−coordinate [m]
relaxation F
0 0.1 0.2 0.3 0
2 4 6 8 10
Area [mm
2]
Area [mm
2]
distal C
0 2 4 6 8 10
Time [s]
proximal E
0 2 4 6 8 10 0
2 4 6 8 10
p
ex
contraction relaxation
A
distal p p
[image:10.595.125.468.357.634.2]ex
Figure 5. Venous cross-sectional area in the reduced configuration without valves (Figure 2A) over time (C and E) and over the z-coordinate (D and F) with the corresponding extravascular pressure on top (B and A, respectively). The temporal plots are divided in the distal (C) and proximal (E) courses of the cross-sectional area. The spatial plot are divided in contraction (D) and relaxation (F) plots. The different lines represent different spatial and temporal points, which correspond to the following symbols in the diagonal plots (A and B) of the extravascular pressure: temporal plots of the distal (C,in B) and proximal (E,Min
contraction phase, which is best observed in Figure 5D while comparing all curves to the black curve (before contraction). In the subsequent relaxation phase, the vein refills from the distal side.
3.2. Effect of venous valves
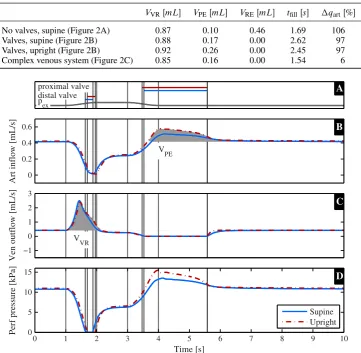
The influence of venous valves on venous hemodynamics during muscle pump activation was assessed by comparing the configuration without venous valves to the one with venous valves (Figure 2A and B, respectively). The results from the two simulations are compared in Figure 6, which reports the extravascular pressure and the state of the proximal (VV2) and distal (VV1) valves (Figure 6A), the arterial inflow (Figure 6B), venous outflow (Figure 6C), and venous vol-ume (Figure 6D). Gray regions in Figure 6B and C indicate the extra volvol-ume due to perfusionVPE, venous returnVVR, and refluxVREfor which the numerical values are reported in Table III.
During the initial phase of the muscle contraction.1s6t 61:5s/, increased venous outflow is
observed in Figure 6C. In the second part of the contraction.1:5s6t 62s/, the flow decreases
and stabilizes under constant extravascular pressure.2s6t 63s/. The extra volume venous return
VVR is only slightly increased after the inclusion of venous valves. Along with increased venous outflow, a decrease in arterial inflow of97% is observed during the contraction in the case where valves are included. When no valves are present, arterial flow decreases below zero to 6% of baseline arterial flow, resulting in backflow. In Figure 6A, VV1 is observed to close during part of the contraction.
In the subsequent relaxation phase.t > 3s/, arterial flow increases, resulting in an extra perfusion volumeVPEof 0.17 and 0.10 mL with and without valves, respectively. VV2 closes, and the venous flow reduces to zero when valves are included, resulting in a zero reflux volumeVRE. Without valves,
Art inflow [mL/s]
VPE
B
0 0.2 0.4 0.6
Ven outflow [mL/s]
V
VR
VRE
C
−1 0 1 2 3
Ven volume [mL]
Time [s]
D
0 1 2 3 4 5 6 7 8 9 10
0 1 2 3
pex
proximal valve
distal valve A
[image:11.595.127.468.363.643.2]No valves Valves
Figure 6. The muscle pump effect is shown in the reduced geometry in the case valves are excluded (blue) and included (red) (Figure 2A and B). In plot A, the course of the extravascular pressure and the state of the proximal and distal valves are shown, where the closed state is denoted with a solid line. Plots B and C show the arterial inflow and venous outflow, respectively. The gray areas indicate the extra perfusion.VPE/, venous return.VVR/and reflux volume.VRE/of which the values can be found in Table III. Plot D shows
Table III. Venous return.VVR/, perfusion.VPE/, and reflux volumes.VRE/, refilling timetfilland the relative decrease in arterial inflow during the muscle contraction qartas indicated in Figure 6,
7, and 9 and explained in Equation 20, (19), and (21).
VVRŒmL VPEŒmL VREŒmL tfillŒs qartŒ%
No valves, supine (Figure 2A) 0.87 0.10 0.46 1.69 106
Valves, supine (Figure 2B) 0.88 0.17 0.00 2.62 97
Valves, upright (Figure 2B) 0.92 0.26 0.00 2.45 97
Complex venous system (Figure 2C) 0.85 0.16 0.00 1.54 6
Art inflow [mL/s]
VPE
0 0.2 0.4 0.6
Ven outflow [mL/s]
VVR −1
0 1 2 3
Perf pressure [kPa]
Time [s]
0 1 2 3 4 5 6 7 8 9 10
0 5 10 15
p
ex
proximal valve distal valve
Supine Upright
B
C
[image:12.595.140.454.531.679.2]D A
Figure 7. The muscle pump effect is shown in the reduced configuration including valves (Figure 2B) in the supine (blue) and upright (red) positions. In plot A, the course of the extravascular pressure and the state of the proximal and distal valves are shown, the closed state is denoted with a solid line. Plots B and C show the arterial inflow and venous outflow, respectively. The gray areas indicate the extra perfusion.VPE/and venous return.VVR/of which the values can be found in Table III. Plot D shows the perfusion pressure.
Pressure [kPa]
A
−2 0 2 4 6 8
Z−coordinate [m]
Area [mm
2] B
0 0.05 0.1 0.15 0.2 0.25 0.3 0.35
0 5 10
t = 3.5 t = 3.8 t = 4 t = 5 t = 6
Art inflow [mL/s]
VPE
0 0.5 1
Deep V outflow [mL/s]
V
VR −1
0 1 2 3
Ven volume [mL]
Time [s]
0 1 2 3 4 5 6 7 8 9 10
0 1 2 3
pex
proximal valve distal valve
Reduced venous anatomy Complex venous anatomy
B
C
[image:13.595.129.468.70.347.2]D A
Figure 9. The muscle pump effect is shown with the absence and presence of the superficial venous system (Figure 2B and C). In plot A, the course of the extravascular pressure and the state of the proximal and distal valves are shown, the closed state is denoted with a solid line. Plots B and C show the arterial inflow and venous outflow, respectively. The gray areas indicate the extra perfusion.VPE/, venous return.VVR/, and reflux volume.VRE/of which the values can be found in Table III. Plot D shows the volume inside the
deep vein.
negative venous outflow results in a reflux volumeVRE of 0.46 mL that refills the vein from the proximal side. Figure 6D compares the volume of the deep vein over time in both cases and reveals a faster refilling if no valves are included, quantified by the measurement of the refilling time without valves,tfillD1:69s, and with valves,tfillD2:62s (Table III).
3.3. Effect of hydrostatic pressure
The effect of hydrostatic pressure was studied by comparing the hemodynamics in the supine and upright positions, with valves included in both cases (Figure 2B). The results from the two simula-tions are compared in Figure 7, which reports the extravascular pressure and the state of VV2 and VV1 (Figure 7A), the arterial inflow (Figure 7B), venous outflow (Figure 7C), and perfusion pres-sure (Figure 7D). Gray regions of Figure 7B and C indicate the extra volume due to perfusionVPE and venous returnVVRfor which numerical values are reported in Table III.
During the contraction phase.1s6t 62s/ ;similar flow patterns are observed in supine and upright positions, with a small increase of 0.04 mL in the venous return volume VVR in the upright position. In the subsequent relaxation phase.t > 3s/, the arterio-venous perfusion pressure (Figure 7D) is elevated, while VV2 is closed, with a maximal difference of 2.3 kPa. This increased perfusion pressure is accompanied with an increase in arterial inflow and a 0.09 mL increase in per-fusion volumeVPE. The venous refilling process is slightly faster in the upright position as it reaches a95% refilling in 2.45 s instead of 2.62 s (Table III).
3.4. Effect of superficial system
The influence of the superficial venous system was studied by comparing the hemodynamics in a reduced and deep-superficial configuration (including one superficial and four perforating veins). Both models included valves and were simulated in upright position (Figure 2B and C, respectively). The results from the two simulations are compared in Figure 9, which reports the extravascular pressure and the state of VV2 and VV1 (Figure 9A), the arterial inflow (Figure 9B), deep venous outflow (Figure 9C), and total venous volume (Figure 9D). Gray regions of Figure 9B and C indicate the extra volume due to perfusionVPEand venous returnVVRfor which numerical values are reported in Table III.
During the contraction phase.1s6t 62s/, arterial inflow remained high when the superficial system was included. qartD6%/, compared with a large reduction when only the deep system was included. qartD97%/(Figure 9 and Table III). The venous return during the relaxation phase is slightly reduced withVVR D0:85mL in the deep-superficial configuration andVVRD0:92mL in the reduced configuration. In the subsequent relaxation phase, a faster refilling is observed in the more detailed configuration, quantified by the measurement of the refilling time in the reduced configuration, tfill D 2:45s and including the superficial system, tfill D 1:54 s (Figure 9D and Table III). The perfusion volume in the deep-superficial configuration is decreased by 0.10 mL compared with the reduced configuration.
Figure 10 shows detailed venous dynamics for the deep-superficial configuration, reporting the state of one perforating valve and the extravascular pressure (Figure 10A), the deep venous inflow (Figure 10B), superficial venous inflow (Figure 10C), and total perforating venous inflow (Figure 10D).
Perf inflow [mL/s]
Time [s]
0 1 2 3 4 5 6 7 8 9 10
0 1 2
Deep V inflow [mL/s]
0 1 2
Sup V inflow [mL/s]
0 1 2
p
ex
perforating valve
Complex venous anatomy
D B
[image:14.595.127.467.383.663.2]C A
Figure 10. The muscle pump effect is shown with the absence and presence of the superficial venous system (Figure 2B and C). In plot A, the course of the extravascular pressure and the state of the proximal and distal valves are shown, where the closed state is denoted with a solid line. Plot B, C, and D show the deep venous,
During the contraction phase .1s6t 62s/, deep venous inflow decreases and superficial inflow increases. In the subsequent relaxation phase.t >3s/superficial inflow decreases, deep inflow increases, and perforator inflow increases. The perforating valve is closed during the whole contraction phase.1s6t 63s/and alters state continuously after the relaxation.4s6t 66s/.
4. DISCUSSION
This study examined the main mechanisms of the muscle pump effect using a 1D pulse wave propa-gation model that includes venous collapsibility, gravity, and venous valves. Different configurations of the model were used to investigate the effect of venous valves, hydrostatic pressure, and the superficial venous system on the valve dynamics and hemodynamics during calf muscle contraction. The results presented in Section 3 show the details of the hemodynamics observed within each of the model configurations. The following discussion compares these results with other publications which report specific features of the venous behavior along with opportunities for further refinement of the modeling approach.
In the current study, muscle contraction was simulated by increasing extravascular pressure on the deep veins, resulting in a collapse developing from the proximal towards the distal side of the vein. This behavior is in agreement with the fast collapse near the outlet of the tube observed in the simu-lations andin vitroexperiments of Marchandiseet al.[21], which can physically be explained by the lower hydrostatic pressure at the proximal end. Collapse results in an increased venous outflow with a peak value of five times the baseline flow. These results are in line with the seven-fold flow aug-mentation observed numerically andin vivoby Fullanaet al.[26] in the common femoral vein. The results presented in Section 3 support thein vivoobservations of Crisóstomoet al.[34], that venous flow velocity augmentation is not significantly different between patients with venous valve insuffi-ciency and healthy subjects. This can be considered by comparing results between the models with and without valves, where the absence of valves represents the extreme case of valve incompetence, which is often a feature of chronic venous disease. The increased arterial flow observed during the refilling shows the same behavior as observed by Fullanaet al.[35]: initial rapid increase, quasi-steady filling resulting in an almost linear decay in flow, and a final stage, where the flow goes back to its baseline value. The spatial and temporal courses of collapse are in line with previous studies.
The main effects of including venous valves were observed in the relaxation phase. Without valves, the refilling of the vein occurred from both the distal and proximal sides. Refilling from the proximal side resulted in a reflux volume of 0.46 mL,53% of the extra venous return volume generated during the muscle contraction. The consequence of single-sided refilling, when valves are included, is an associated increase in both refilling timetfilland perfusion volumeVPE. We found in this study that the proximal valve is essential to the efficiency of the muscle pump, while the distal valve does not significantly impede arterial backflow, as the high resistance of the micro-circulation prevents this, both with and without valves.
phenomenon is described by Young and Tsai [37, 38] while studying the pressure drop over a steno-sis. Our study suggests that the total pressure drop along the deep vein is determined by the state of refilling and the resistance of the collapsed area.
The most important effect of including the superficial venous system can be seen in the changes in the arterial flow during muscle contraction. In the configurations with only a deep venous system, a decrease in arterial inflow of97% was observed during the muscle contraction, whereas arterial flow was only reduced by6% when the superficial system was included in the model. The division of arterial flow between the deep and superficial veins (Figure 10) changes significantly during muscle contraction, with the deep venous inflow decreasing to zero and a large increase in superficial venous flow. This can be explained by the increased resistance of the deep vein as it collapses, with the superficial vein remaining circular with low resistance. In the subsequent relaxation phase, the flow in the superficial vein is observed to approach zero, whereas the deep venous inflow receives most of the arterial flow, due to the lower pressure in the deep vein. Although the perfusion volume decreases while including the superficial system, the refilling time is37% shorter. The alteration of open and closed state of the perforating valve in the late relaxation phase seems a numerical artifact but might also be explained physiologically. During the late relaxation, the deep and superficial veins have a similar filling and therefore a similar pressure, which means the pressure difference between deep and superficial easily changes sign and therefore easily opens or closes the valve. Furthermore, it has to be noticed that these fast alterations in valve state have no influence on the general flow dynamics. Summarizing, the superficial system is found to be of importance for maintaining calf perfusion during the contraction phase and decreasing the refilling time in the relaxation phase.
The collapse course of the deep vein is determined by itsA; p-relation, which is currently based on the work of Shapiro [19] and the bending stiffness of Müller and Toro [16]. Usingex vivoor in vivopressure and cross-sectional area measurements, as performed by Bassezet al.[39], could provide a more realistic relationship, resulting in a more accurate prediction of the volume shifts. However, we expect that effects of an experimentally determined tube law would not be significant for the qualitative study of the muscle pump. The course of the collapse could also be improved while using a more realistic course of extravascular pressure, which is now included as a smooth sinus function in order to have a clear distinction between the contraction and relaxation phases. An electromyogram of a muscle contraction could be used to provide a more realistic course of the extravascular pressure [40]. Apart from the pressure originating from the muscles, the arteries, running in parallel with the veins, are also known to slightly compress the veins, which experience the arterial pulsatility as an extravascular pressure [41]. However, this pressure is expected to be much lower than the extravascular pressure originating from the muscle contraction.
Although a maximal 1.5-fold increase in arterial flow is observed in the relaxation phase, it is much smaller than the up to seven-fold increase observed in vivoafter a 4-s contraction of the calf muscle by Leguy et al.[33]. However, the increase in arterial inflow during the first 5 s is known to be a combination of the muscle pump and rapid vasodilation [44], of which the latter is currently not included. Extending the model with regulation of the micro-circulation could help in better predicting the arterial flow during the relaxation phase. Previous modeling studies have successfully included local cerebral auto-regulation [45, 46] including myogenic, metabolic, neuro-genic, and endothelial regulation mechanisms, which could be adapted to simulate changes in calf vascular tone.
The muscle pump effect is not the only mechanism of importance for studying the fluid shift on orthostatic stress. Considering the importance of other regulatory mechanisms, such as the baroreflex and the effect of venous return on cardiac output during tilt [7], requires a more global circulatory model. Olufsen et al. [46] developed a closed-loop model to study the effect of tilt on hemodynamics while including global autonomic and cerebral auto-regulation. Furthermore, Heldt et al.[47] studied the effect of tilt and lower body negative pressure using a closed-loop lumped parameter model including the arterial and cardiopulmonary baroreflex. However, both models use a lumped parameter approach with a limited number of compartments. These models do not take into account pressure and flow wave propagation phenomena or collapsibility of the veins as reported in this paper. In future research, we aim to develop a global, closed-loop 1D pulse wave propagation model of the total circulation, including regulation mechanisms such as the baroreflex and local auto-regulation, to gain further insight into the mechanisms responsible for reducing fluid shifts during tilting.
Art inflow [mL/s]
VPE
0 0.5 1
Ven outflow [mL/s]
VVR
VRE
−2 0 2
Perf pressure [kPa]
Time [s]
0 1 2 3 4 5 6 7 8 9 10
5 10 15 20 25
pex
proximal valve distal valve
No valves, upright, full p
H
Valves, upright, full p
H B
C
[image:17.595.128.467.366.644.2]D A
Figure 11. The muscle pump effect is shown in the reduced geometry in case valves are excluded (blue) and included (red) with the full hydrostatic column on the boundary conditions (Figure 2A and B). In plot A, the course of the extravascular pressure and the state of the proximal and distal valves are shown, where the closed state is denoted with a solid line. Plots B and C show the arterial inflow and venous outflow, respectively. The gray areas indicate the extra perfusion.VPE/, venous return.VVR/, and reflux volume.VRE/
Table IV. Venous return.VVR/, perfusion.VPE/and reflux volumes.VRE/, refilling timetfilland the relative decrease in arterial inflow during the muscle contraction qartas indicated in Figure 11 and
explained in Equation (20), (19)s and (21).
VVRŒmL VPEŒmL VREŒmL tfillŒs qartŒ% No valves, upright, fullpH (Figure 2A) 0.87 0.08 0.58 1.10 44 Valves, upright, fullpH (Figure 2B) 0.86 0.35 0.00 1.77 44
A further advantage of a closed-loop model is that it allows the influence of the full hydrostatic column to be considered. To demonstrate the influence of this effect in the current model (reduced configuration with and without valves in the upright position), aghterm (withh D 1:0m/was added to the pressure at the inlet and outlet.pinandpout, respectively). The results of these simu-lations, shown in Figure 11 and Table IV, further highlights the importance of the venous valves as the reflux volumeVREincreased to67% of the venous return volumeVVR(Figure 11 and Table IV). The abrupt increase of venous outflow at the end of the relaxation phase is most probably caused by the fact that, in this pressure regime, a small increase in the cross-sectional area is accompanied by a large increase in pressure. Furthermore, a higher perfusion was observed in the relaxation phase while the perfusion pressure increased.
Apart from studying the muscle pump effect, the current model has potential application to spe-cific clinical conditions. Inclusion of leaking valves could inform understanding of the effect of valve insufficiency on venous hemodynamics. Furthermore, cuff compression is used to promote venous return in particular conditions, the model could be used to study different compression pat-terns to improve cuff efficiency, as suggested by Simakov et al.[48]. A series of contractions is expected to result in lower filling of the veins, as a second contraction can start before the vein is fully refilled. This lower filling of the veins results in a lower pressure in the vein, maintaining a higher perfusion pressure. This lower venous pressure also results in a smaller pressure difference with the surrounding tissue, and therefore less edema is expected. Modeling a series of contractions therefore necessitates inclusion of filtration mechanisms and local auto-regulation.
5. CONCLUSION
A 1D pulse wave propagation model has been developed, which allows the study of lower limb hemodynamics during muscle pump activation. The model is able to predict the increase in venous return during muscle contraction. As the proximal valves close during the relaxation phase, reflux is prevented, which without valves resulted in a loss of53% of effective venous return. Furthermore, the shielding function of the valves increased the perfusion in the relaxation phase. Finally, inclusion of the superficial venous system demonstrates the role of the superficial veins in maintaining arterial inflow during muscle contraction and decreasing refilling time by37% during relaxation.
APPENDIX A. EXTRAVASCULAR PRESSURE
The temporal course of the extra vascular pressure is defined by
k.t /D 8 ˆ ˆ ˆ ˆ ˆ ˆ < ˆ ˆ ˆ ˆ ˆ ˆ :
0 if t < T0
1Csin.tT0/
Tr
2
=2 if T0 < t < T0CTr
1 if T0CTr < t < T0CTrCTc
1Csin.tT0TrTc/
Tf C
2
=2 if T0CTrCTc < t < T0CTrCTcCTf
0 if t > T0CTrCTc CTf
m.´/D 8 ˆ ˆ ˆ ˆ ˆ ˆ < ˆ ˆ ˆ ˆ ˆ ˆ :
0 if ´ < l0
1Csin..tl0/
lr
2/
=2 if l0 < t < l0Clr 1 if l0Clr < t < lendlf
1Csin..tlend/
lf C
2/
=2 if lendlf < t < lend
0 if t > lend
(A.2)
wherel0 D0:07m andlendD0:27m are the coordinates below and above which no extravascular pressure is applied, andlr D0:10m andlf D0:10m are the lengths over which the extravascular pressure rises and falls. The z-coordinate is defined to be zero at the distal side of the vein and increases to´D0:34s at the proximal side.
ACKNOWLEDGEMENTS
J.M.T. Keijsers received a scholarship from the Helmholtz SpaceLife Sciences Research School (SpaceLife), which was funded by the Helmholtz Association, and the German Aerospace Center (Deutsches Zentrum für Luft- und Raumfahrt e.V., DLR). The contribution of Dr. A.J. Narracott to this research was supported by funding from the Research Mobility Programme of the Worldwide Universities Network. The contribution of Dr. C.A.D Leguy was performed with the support of the Marie Curie International Outgoing fellowship of the Europeans 7th Framework Programme for Research under contract number MC-IOF-297967.
REFERENCES
1. Buckey JC, Lane LD, Levine BD, Watenpaugh SJ, Wright SherwinJ, Moore WE, Gaffney FA, Blomqvist CG. Orthostatic intolerance after spaceflight.Journal of Applied Physiology1996;81:7–18.
2. Claydon VE, Steeves JD, Krassioukov A. Orthostatic hypotension following spinal cord injury: understanding clinical pathophysiology.Spinal Cord2006;44(6):341–51.
3. Butler GC, Xing H, Northey DR, Hughson RL. Reduced orthostatic tolerance following 4 h head-down tilt.European Journal of Applied Physiology1991;62:26–30.
4. Rutan GH, Hermanson B, Bild DE, Kittner SJ, Labaw F, Tell GS. Orthostatic hypotension in older adults.
Hypertension1992;19:508–519.
5. Freeman R, Lirofonis V, Farquhar WB, Risk M. Limb venous compliance in patients with idiopathic orthostatic intolerance and postural tachycardia.Journal of Applied Physiology2002;93(2):636–644.
6. Laughlin MH. Skeletal muscle blood flow capacity: role of muscle pump in exercise hyperemia.American Journal of Physiology. Heart and Circulatory physiology1987;253:H993–H1004.
7. Rowell LB.Human Cardiovascular Control. Oxford University Press: Oxford, 1993.
8. Nådland IH, Walløe L, Toska K. Effect of the leg muscle pump on the rise in muscle perfusion during muscle work in humans.European Journal of Applied Physiology2009;105(6):829–41.
9. Pollack AA, Wood EH. Venous pressure in the saphenous vein at the ankle in man during exercise and changes in posture.Journal of Applied Physiology1949;1:649–662.
10. Meissner MH. Lower extremity venous anatomy.Seminars in Interventional Radiology2005;22(3):147–56. 11. van de Vosse FN, Stergiopulos N. Pulse wave propagation in the arterial tree.Annual Review of Fluid Mechanics
January 2011;43(1):467–499.
12. Bode AS, Huberts W, Bosboom EMH, Kroon W, van der Linden WPM, Planken RN, van de Vosse FN, Tordoir JHM. Patient-specific computational modeling of upper extremity arteriovenous fistula creation: its feasibility to support clinical decision-making.PloS one2012;7(4):e34491.
13. Leguy CAD, Bosboom EMH, Gelderblom H, Hoeks APG, Van De Vosse FN. Estimation of distributed arterial mechanical properties using a wave propagation model in a reverse way.Medical Engineering & Physics2010; 32(9):957–967.
14. Reymond P, Merenda F, Perren F, Rüfenacht D, Stergiopulos N. Validation of a one-dimensional model of the systemic arterial tree.American Journal of Physiology. Heart and Circulatory Physiology2009;297(1):H208–22. 15. Brook BS, Falle SaEG, Pedley TJ. Numerical solutions for unsteady gravity-driven flows in collapsible tubes:
evolution and roll-wave instability of a steady state.Journal of Fluid Mechanics1999;396(1999):223–256. 16. Müller LO, Toro EF. A global multiscale mathematical model for the human circulation with emphasis on the venous
system.International Journal for Numerical Methods in Biomedical Engineering2014;30(7):681–725. 17. Fung Yc.Biomechanics: Circulation. Springer: New York, 1997.
18. Pedley TJ.The Fluid Mechanics of Large Blood Vessels. Cambridge University Press: Cambridge, 2008. 19. Shapiro AH. Steady flow in collapsible tubes.Journal of Biomechanical Engineering1977;99(3):126–147. 20. Snyder MF, Rideout VC. Computer simulation studies of the venous circulation.IEEE Transactions on Bio-medical
Engineering1969;16(4):325–334.
22. Zervides C, Narracott AJ, Lawford PV, Hose DR. The role of venous valves in pressure shielding.Biomedical Engineering Online2008;7:8, 10 pages. DOI: 10.1186/1475-925X-7-8.
23. Bovendeerd PHM, Borsje P, Arts T, van De Vosse FN. Dependence of intramyocardial pressure and coronary flow on ventricular loading and contractility: a model study.Annals of Biomedical Engineering2006;34(12):1833–1845. 24. Mynard JP, Davidson MR, Penny DJ, Smolich JJ. A simple, versatile valve model for use in lumped parameter and one?dimensional cardiovascular models.International Journal for Numerical Methods in Biomedical Engineering
2012;28:626–641.
25. Korakianitis T, Shi Y. Numerical simulation of cardiovascular dynamics with healthy and diseased heart valves.
Journal of Biomechanics2006;39:1964–1982.
26. Fullana JM, Zaleski S. A branched one-dimensional model of vessel networks.Journal of Fluid Mechanics2008; 621:183–204.
27. Kroon W, Huberts W, Bosboom M, van de Vosse F. A numerical method of reduced complexity for simulating vas-cular hemodynamics using coupled 0D lumped and 1D wave propagation models.Computational and Mathematical Methods in Medicine2012;2012:Article ID 156094, 10 pages. DOI: 10.1155/2012/156094.
28. Hughes JR, Lubliner J. On the one-dimensional theory of blood flow in the larger vessels.Mathematical Biosciences
1973;18:161–170.
29. Bessems D, Rutten M, Van De Vosse F. A wave propagation model of blood flow in large vessels using an approximate velocity profile function.Journal of Fluid Mechanics2007;580:145–168.
30. Westerhof N, Bosman F, de Vries CJ, Noordergraaf A. Analog studies of the human systemic arterial tree.Journal of biomechanics1969;2:121–143.
31. Letcher RL, Chien S, Pickering TG, Sealey JE, Laragh JH. Direct relationship between blood pressure and blood viscosity in normal and hypertensive subjects: role of fibrinogen and concentration.Am J Med1981;70:1195–1202. 32. Hall JE.Guyton and Hall Textbook Of Medical Physiology. Elsevier Health Sciences, 2010.
33. Leguy C, Keijsers J, Huberts W, Narracott A, Rittweger J, van de Vosse F. Including gravitational stress in a blood pressure wave propagation model for cardiovascular space physiology.Computational & Mathematical Biomedical Engineering proceedings, Hong Kong, December, 2013; 397–400.
34. Crisóstomo RSS, Candeias MS, Armada-da Siva PAS. Phlebology.Phlebology2014;29:247–256.
35. Fullana JM, Cros F, Flaud P, Zaleski S. Filling a collapsible tube.Journal of Fluid Mechanics2003;494:285–296. 36. Raju S, Green AB, Fredericks RK, Neglen PN, Alexander HC, Koenig K. Tube collapse and valve closure in
ambu-latory venous pressure regulation: studies with a mechanical model.Journal of Endovascular Surgery1998;5: 42–51.
37. Young DF, Tsai FY. Flow characteristics in models of arterial stenosis - I. Steady flow.Journal of Biomechanics
1973;6:395–410.
38. Young DF, Tsai FY. Flow characteristics in models of arterial stenosis - II. Unsteady flow.Journal of Biomechanics
1973;6(1955):547–559.
39. Bassez S, Flaud P, Chauveau M. Modeling of the deformation of flexible tubes using a single law: application to veins of the lower limb in man.Journal of Biomechanical Engineering2001;123(1):58–65.
40. Maton B, Thiney G, Ouche A. Intramuscular pressure and surface EMG in voluntary ankle dorsal flexion: Influence of elastic compressive stockings.Journal of Electromyography and Kinesiology2006;16:291–302.
41. Fox RH.The Venous System in Health and Disease. IOS Press, 2001.
42. Abu-Yousef MM, Mufid M, Woods K, Brown BP, Barloon TJ. Normal lower limb venous doppler flow phasicity: is it cardiac or respiratory?American Roentgen Ray Society1997;169:1721–1725.
43. Chavhan GB, Parra DA, Mann A, Navarro OM. Normal Doppler spectral waveforms of major pediatric vessels: specific patterns.RadioGraphics2008;28:691–707.
44. Tschakovsky ME, Shoemaker JK, Hughson RL. Vasodilation and muscle pump contribution to immediate exercise hyperemia.The American Journal of Physiology1996;271(4):H1697–701.
45. Spronck B, Martens EGHJ, Gommer ED, van de Vosse FN. A lumped parameter model of cerebral blood flow control combining cerebral autoregulation and neurovascular coupling.American Journal of Physiology. Heart and Circulatory Physiology2012;303:H1143–53.
46. Olufsen MS, Ottesen JT, Tran HT, Ellwein LM, Lipsitz La, Novak V. Blood pressure and blood flow variation during postural change from sitting to standing: model development and validation.Journal of Applied Physiology2005; 99:1523–37.
47. Heldt T, Shim EB, Kamm RD, Mark RG. Computational modeling of cardiovascular response to orthostatic stress.
Journal of Applied Physiology2002;92(3):1239–54.
48. Simakov S, Gamilov T, Soe YN. Computational study of blood flow in lower extremities under intense physical load.
![Table I. Geometrical parameters of the different vessels [16] as depicted in Figure 2.](https://thumb-us.123doks.com/thumbv2/123dok_us/7889353.185769/5.595.113.488.84.298/table-i-geometrical-parameters-different-vessels-depicted-figure.webp)