Replacing grass silage with pea barley intercrop silage in the feeding of the dairy cow
17
0
0
Full text
(2) AGRICULTURAL AND FOOD SCIENCE Pursiainen, P. & Tuori, M. Replacing grass silage with pea-barley intercrop silage for dairy cows Shingfield 2005). However, when feeding mixtures of grass and whole-crop silage, extra work and machinery are required to mix different silages. Furthermore, keeping two silos open at the same time may impair the quality of the silages through aerobic deterioration. These problems are avoided by cultivating mixtures of legume and cereal crop for intercrop silage production. Intercropping can considerably increase the feeding value of wholecrop cereal silage (Lunnan 1989, Mustafa et al. 2000) as legumes can improve the digestibility of the silage (Salawu et al. 2001). Legumes can also diminish the annual variability in the feeding value of pure whole-crop cereal silage resulting from the changes in ear-to-straw ratio. Highly significant is also the fact that cultivating N-fixating legumes reduces the need to use N fertilizers (Lunnan 1989). Limited information on milk production in cows fed pea-barley intercrop silage is available. The objective of this experiment was to compare the effects of pea-barley intercrop silage with grass silage on feed intake, digestibility, milk production, milk composition and feed utilisation in dairy cows. In addition, the development of the chemical composition of intercrop component plants was studied.. 10 g benzoic acid per kg) was used at 5 litres per 1000 kg fresh forage. Ensiling started only four hours after mowing due to unstable weather conditions and was interrupted by a breakdown of the baler when approximately half of the area was baled. Ensiling continued next day about 24 hours after mowing. However, the dry matter (DM) content of forage was not markedly affected between the two ensilings (206 and 243 g kg-1). The growth stage of pea at harvest was between early and full pod. Barley was at early dough stage. Primary growth of timothy (Phleum pratense) and meadow fescue (Festuca pratensis) sward was harvested for control silage at heading. After one day wilting grass was ensiled in round bales with the same preservative and application rate as the pea-barley silage.. Animals, experimental design and feeding Eight multiparous Ayrshire cows were used in two 4 × 4 Latin squares with 24-d periods comprising a 17-d adjustment period and 7-d sampling period. Cows were kept in short stalls. Cows in square one were fitted with rumen cannulae. At the beginning of the experiment cows in square one were between 130–158 days in milk and in square two between 56–91 days in milk. Milk yield was 31.5 (SD 4.8) and 40.6 (SD 2.1) kg per day and live weight 595 (SD 36.2) and 630 (SD 54.9) kg for cows in square one and two, respectively. On a dry matter (DM) basis 0 (PBS0), 33 (PBS33), 67 (PBS67) or 100 (PBS100) % of grass silage (GS) was replaced with pea-barley intercrop silage (PBS). Silages for the mixtures were weighed separately and mixed by hand. Silage was given three times per day (0500, 1300, 2000). To ensure ad libitum intake the amount of refusals was targeted to be at least 0.10 of the total daily portion. Dairy concentrate compound (manufactured by Suomen Rehu Oy, Finland) was given at 12 (square 1) or 14.5 (square 2) kg per day and distributed in six even meals (0500, 0800, 1100, 1400, 1700, 2000). Concentrate consisted of (%): barley 31.7, sugar beet pulp 21, rapeseed meal 19, wheat 10, molassses 6, barley malt feed 5, soya. Material and methods Forages The experiment was carried out at the Viikki Research Farm of the University of Helsinki, Finland. A mixture of field pea (Pisum sativum ‘Perttu’) and barley (Hordeum vulgare ‘Mette’) was sown on 22 May 2002 at seed rates of 208 and 127 kg ha-1 (55 and 250 germinating seeds per m2), respectively. Fertilizers were not applied. Pea-barley intercrop was harvested with a condition mower (JF 2800 Hydroflex) 10 weeks after sowing and conserved (Welger RP220) in approximately 900 kg round bales. A formic acid based preservative (AIV2000; 550 g formic acid, 240 g ammonium formiate, 50 g propionic acid, 10 g ethylbenzoate,. 236.
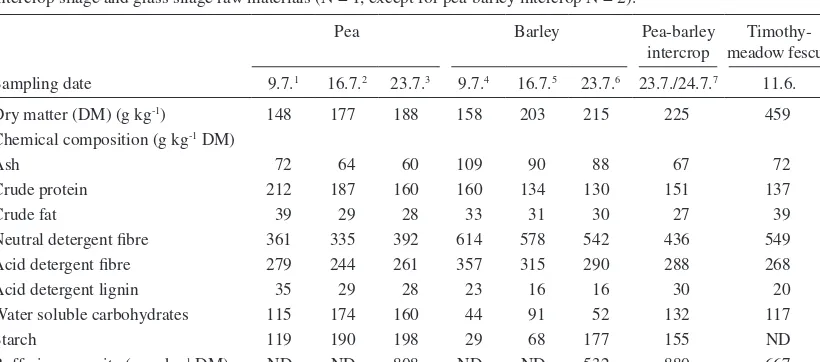
(3) AGRICULTURAL AND FOOD SCIENCE Vol. 15 (2006): 235–251. bean meal 3, rapeseed oil 0.8, propylene glycol 0.8 and minerals, micronutriens and vitamins supplement 2.7 respectively. Feed offered and feed refused were recorded daily.. botanical fractions of stems (including petioles), leaves, tendrils, flowers (involving buds) and pods. The proportion of different fractions in the dried plant and the chemical composition of each fraction were determined. Barley was analysed only as a whole plant. The average height of intercrops was determined by measuring the height of three randomly chosen pea and barley plants before cutting. Sub-samples from the windrows of pea-barley intercrop and timothy-meadow fescue grass were collected at the outset of baling and pooled to two samples, respectively, for analysing the DM content and the chemical composition of the silage raw material. Silages were sampled daily during the last seven days of each experimental period for analysing the DM content, chemical composition and fermentation quality. Samples were stored at –20ºC until analysed. Before analyses daily samples were pooled to form one sample per period. Samples from the silage refusals were collected daily from each cow during the last seven days of. Sampling, chemical analysis and measurements The intercrop stand was sampled once a week from the full bloom of the pea to harvest for determining the development of the chemical composition of pea and barley (Table 1). At each sampling, plants from four randomly chosen 50 × 50 cm plots were manually cut at approximately 5 cm above the ground. Pea and barley plants were separated and weighed for calculating the proportions of the component crops in the stand. After weighing plants were chopped and sampled for determining the DM content and the chemical composition. In addition, part of the pea plants were separated into. Table 1. Chemical composition of whole crop pea and whole crop barley with advancing maturity and that of pea-barley intercrop silage and grass silage raw materials (N = 1, except for pea-barley intercrop N = 2). Pea. Barley. Pea-barley Timothyintercrop meadow fescue. Sampling date. 9.7.1. 16.7.2. 23.7.3. 9.7.4. 16.7.5. 23.7.6. 23.7./24.7.7. 11.6.. Dry matter (DM) (g kg-1) Chemical composition (g kg-1 DM) Ash Crude protein Crude fat Neutral detergent fibre Acid detergent fibre Acid detergent lignin Water soluble carbohydrates Starch Buffering capacity (meq kg-1 DM). 148. 177. 188. 158. 203. 215. 225. 459. 72 212 39 361 279 35 115 119 ND. 64 187 29 335 244 29 174 190 ND. 60 160 28 392 261 28 160 198 808. 109 160 33 614 357 23 44 29 ND. 90 134 31 578 315 16 91 68 ND. 88 130 30 542 290 16 52 177 532. 67 151 27 436 288 30 132 155 880. 72 137 39 549 268 20 117 ND 667. Full bloom, at the beginning of pod formation; 2Blooming nearly finished, seed formation in the lowest pods; 3Blooming over, full lower pods, flat upper pods; 4Heading; 5Between milk and early dough stage; 6Early dough stage; 7Average values from the two samplings from the windrows before baling; ND = not determined 1. 237.
(4) AGRICULTURAL AND FOOD SCIENCE Pursiainen, P. & Tuori, M. Replacing grass silage with pea-barley intercrop silage for dairy cows each period for determining the DM content. Samples were stored and pooled similarly as silage samples. Concentrate was sampled daily throughout the experiment. The DM content of the concentrate was determined once per period. For the chemical analyses periodical samples were pooled to one. The DM content of all samples was determined by 24 h oven-drying at +105ºC. Plant and feed samples for the analysis of chemical composition were oven-dried (1 h +102ºC and 48 h +50ºC) and then ground through a 1 mm sieve. Chemical analysis was made according to the proximate feed analysis. Ash content was determined by ashing the samples in a furnace at 600ºC. Ether extraction of samples was performed after hydrolysis with HCl. Neutral detergent fibre (NDF), acid detergent fibre (ADF) and acid detergent lignin (ADL) analyses were performed according to the method of Van Soest et al. (1991) ash excluded. The indigestible neutral detergent fibre (INDF) content of silages and concentrate was determined by 12 days ruminal incubation in nylon bags (pore size 6 μm). Starch content was analysed according to Salo and Salmi (1968) without ethanol extraction. Buffering capacity of the silage raw materials was measured according to Weissbach (1992). The in vitro organic matter (OM) digestibility and D-value (digestible organic matter content in dry matter) of silages was determined using cellulase method according to Friedel (1990). Silage pH was measured from the extracted fluid or after 20 minutes soaking of sample-distilled water mix (1:1). All values describing the fermentation quality of the silages were determined from the water extract of the silage samples. Contents of lactic acid, ammonia N, total N, soluble N and water soluble carbohydrates (WSC) were analysed as described by Kokkonen et al. (2000). Volatile fatty acids (VFA) were determined using the gas chromatography (Huhtanen et al. 1998). Ethanol content was determined by enzymatic procedure (commercial kit no 176290, Boehr ing Mannheim GmbH, Germany). The DM content of the silages was corrected for volatile losses of lactic acid, VFAs, ethanol and ammonia N according to Huida et al. (1986).. Cows were milked twice a day. Milk yield was recorded (Tru-Test FV, Tru-Test Ltd., New Zealand) at every milking. Samples for analyses were taken at four consecutive milkings in the last week of each experimental period and pooled to form one sample per cow. Samples were stored with preservative (Bronopol tablets, Valio Ltd., Finland) until analysed for fat, protein, lactose and urea content (infrared analyser MilkoScan FT6000). Samples for analysing the fatty acid content of milk were taken from the pooled sample from the cows in square 2 and stored at –20ºC without preservative. Milk fatty acids were analysed according to Griinari et al. (1998) with modifications as follows. Lipids were extracted from the milk (1 ml sample) using a mixture of diethyl ether and hexane according to reference procedure (IDF 1C:1987; IDF 16C:1987, International Dairy Federation, Brussels, Belgium). The fatty acids were then methylated by sodium methoxide using a procedure described by Christie (1982). The sample was resolubilized in two milliliters of hexane and 40 μl of methyl acetate was added. Following vortexing 40 μl of freshly prepared methylating agent (1M sodium methoxide) was added. The mixture was vortexed and allowed to react for 5 min at room temperature. The reaction was stopped with 60μl of oxalic acid in hexane (saturating concentration) and CaCl2 was added to remove methanol residues. After 1 h at the earliest the sample was centrifuged at 3000 rpm for 3 min leaving a clear layer of hexane from which an aliquot was taken for gas chromatograph analysis. Fatty acid analysis was carried out using a HewlettPackard 5890 gas chromatograph (Wilmington, DE, USA) equipped with a flame-ionization detector, automatic injector, split injection port and a 100 m fused silica capillary column (i.d., 0.25 mm) coated with 0.2 µm film of cyanopropyl polysiloxane (CP-SIL 88; Chrompack 7489, Middelburg, The Netherlands). Helium was used as the carrier gas. For organoleptic testing (smell and taste) cooled milk samples from one morning milking (square 2) were sent to the National Veterinary and Food Research Institute. Five experts tasted milk. 238.
(5) AGRICULTURAL AND FOOD SCIENCE Vol. 15 (2006): 235–251. separately and graded it using a five-point scale from 0 (unsuitable for human consumption) to 5 (excellent). Cows were weighed on two consecutive days at the beginning of the experiment and at the end of each period. If the difference between the two weighings was more than 10 kg an extra weighing was made on the third day. Live weight at the end of period was corrected according to change in feed intake between the beginning and the end of period. The in vivo apparent digestibility of the diet was determined using acid insoluble ash (AIA) as an internal marker (Van Keulen and Young 1977). Faecal grab samples were taken twice a day (0700 and 1500 hours) for five consecutive days during the last week in each experimental period. Samples were frozen immediately and stored at –20ºC. For the chemical analyses samples were oven-dried at +60ºC until dry and then ground through 1.5 mm sieve. The DM content and the chemical composition were determined using the same methods as with feeds. The total N content was determined from the fresh samples using the Kjeldahl method. Rumen liquid was collected one day in the last week of each period before morning feeding and then 1, 2, 3, 4, 6, 8 and 10 h after the morning feeding. The pH of the samples was measured immediately. Samples were then filtered through a cheese cloth and ammonia N was measured. Samples of rumen fluid (10 ml) for determination of VFAs were preserved with 1 ml of saturated mercury chloride and 4 ml of 1 M sodium hydroxide and stored at –20ºC. Rumen ammonia N and VFA concentrations were determined using the same methods as described for determination of silage fermentation quality.. results were calculated using MIXED procedure of SAS (Littell et al. 1996). Data was based on the mean values from the last seven days of each experimental period. The model used included square, period, square × period interaction and treatment as fixed factor, with cow within the square as the random factor. Interaction between square and treatment was not significant and was excluded. Treatment effects were further studied using orthogonal polynomial contrasts to provide linear (lin.), quadratic (quadr.) and cubic (cub.) effects of PBS proportion. Results of in vivo apparent diet digestibility were calculated using the same model. The effect of the experimental diets on diurnal variation in rumen fermentation was analysed by repeated measures with the MIXED procedure of SAS. The model used included treatment, period, cow, time and treatment × time interaction as fixed factors and time and cow in the period as random factors. From one cow all data of two experimental periods (udder inflammation and problems with the rumen cannulae) and from one cow all data of one period (udder inflammation) was excluded when calculating the results. Both cows belonged to square 1.. Results Intercrop and feed composition Development of the chemical composition of the whole crop pea and the whole crop barley with advancing maturity and the chemical composition of forages before ensiling is shown in Table 1. The CP content of both pea and barley plants decreased during maturation. The NDF content of pea increased and that of barley decreased with advancing maturity. The starch content of pea increased by 5.6 g kg-1 DM per day from the full bloom until harvest and that of barley by 10.6 g kg-1 DM per day. At harvest pea was at pod fill stage and had higher concentrations of CP, ADL, starch and WSC. Calculations and statistical methods Metabolizable energy (ME) values of silages and concentrate were calculated according to Finnish Feed Tables (MTT 2004). The supply of amino acids absorbed from the small intestine (AAT) was calculated according to Finnish Feed Tables (MTT 2004). Statistical analyses concerning production. 239.
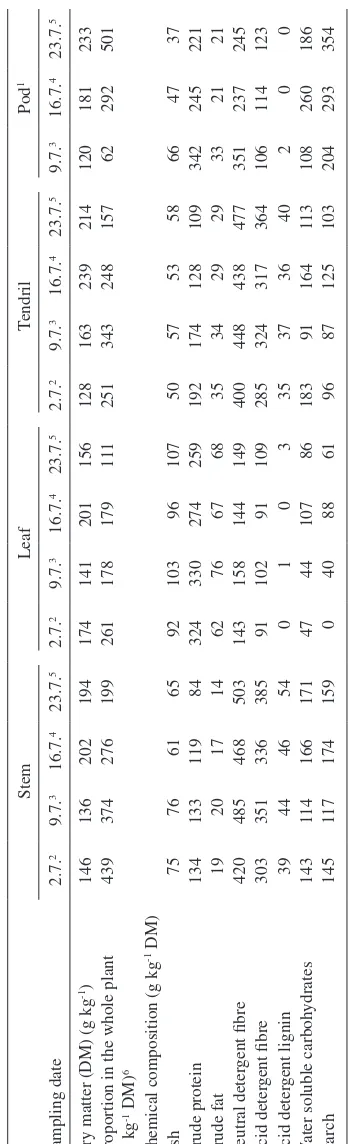
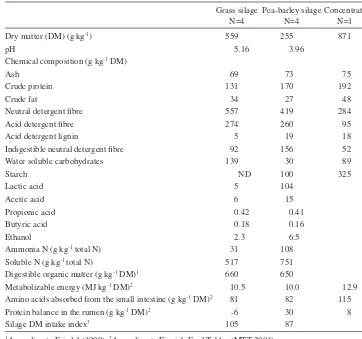
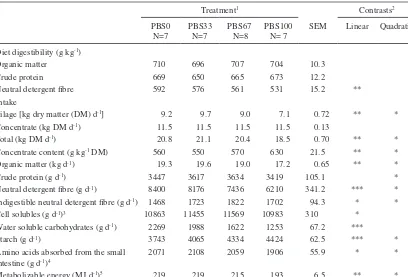
(6) AGRICULTURAL AND FOOD SCIENCE. Pods not found 2.7.; 2At the beginning of flowering; 3Full bloom, at the beginning of pod formation; 4Blooming nearly finished, seed formation in the lowest pods; Blooming over, full lower pods, flat upper pods; 6Proportions of (flowers + buds) and dead plant material are not included because of negligible amounts. 5. 1. 37 221 21 245 123 0 186 354 47 245 21 237 114 0 260 293 66 342 33 351 106 2 108 204 58 109 29 477 364 40 113 103 53 128 29 438 317 36 164 125 57 174 34 448 324 37 91 87 50 192 35 400 285 35 183 96 107 259 68 149 109 3 86 61 96 274 67 144 91 0 107 88 103 330 76 158 102 1 44 40 92 324 62 143 91 0 47 0 65 84 14 503 385 54 171 159 76 133 20 485 351 44 114 117 75 134 19 420 303 39 143 145. 61 119 17 468 336 46 166 174. 233 501 181 292 120 62 214 157 239 248 163 343 128 251 156 111 201 179 141 178 174 261 194 199 136 374 146 439. Dry matter (DM) (g kg-1) Proportion in the whole plant (g kg-1 DM)6 Chemical composition (g kg-1 DM) Ash Crude protein Crude fat Neutral detergent fibre Acid detergent fibre Acid detergent lignin Water soluble carbohydrates Starch. 202 276. 16.7.4 16.7.4 9.7.3 16.7.4 9.7.3. Stem. 23.7.5. 2.7.2. Leaf. 23.7.5. 2.7.2. 9.7.3. 16.7.4. 23.7.5. 9.7.3. Pod1 Tendril. 240. 2.7.2. Replacing wilted GS with PBS had no effect on apparent digestibility of diet OM and CP (Table 4). However, digestibility of diet NDF decreased linearly (P < 0.01) as the proportion of PBS in the feeding increased. Silage intake changed curvilinearly (P < 0.05) in response to increasing the proportion of PBS in the diet (Table 4). Cows fed PBS33 had the highest silage dry matter intake (DMI) (9.7 kg per day) and cows fed PBS100 had. Sampling date. Diet digestibility and feed intake. Table 2. Chemical composition of the different fractions of whole crop pea with advancing maturity (N = 1).. and lower concentrations of DM, ash and NDF compared to barley. Barley was at early dough stage at harvest. The proportion of pea in the intercrop was 740 g kg-1 DM. The height of the stand was 94 cm for pea and 89 cm for barley. The average DM content of pea-barley intercrop at the outset of baling was 225 g kg-1 and that of timothymeadow fescue grass 459 g kg-1. Pea-barley intercrop contained more CP and less NDF compared to timothy-meadow fescue grass. The results from the botanical separations of pea plants are presented in Table 2. At the beginning of flowering stems formed nearly half of the DM of pea plant. During maturation the proportion of stems decreased whereas the proportion of tendrils and particularly pods increased. At harvest pods accounted for half of the DM of the pea plant. Leaves and pods were the most protein-rich fractions as stems and tendrils were abundant in fibre. From the end stages of the blooming until harvest WSC content of pea pods decreased by 28% while starch content increased by 21%. At harvest pods contained starch 354 g kg-1 DM. The proportion of pea seeds from the total pod DM was 615 g kg-1. Pea seeds contained CP 281, NDF 157, WSC 78 and starch 391 g kg-1 DM. The average chemical composition of feeds is given in Table 3. Pea-barley intercrop silage contained more CP and INDF and less DM, NDF and WSC than grass silage. In addition, pH value was lower and concentrations of lactic acid, ammonia N and soluble N higher in PBS than in GS. Both silages were very low in butyric acid. The D-value was similar among the silages.. 23.7.5. Pursiainen, P. & Tuori, M. Replacing grass silage with pea-barley intercrop silage for dairy cows.
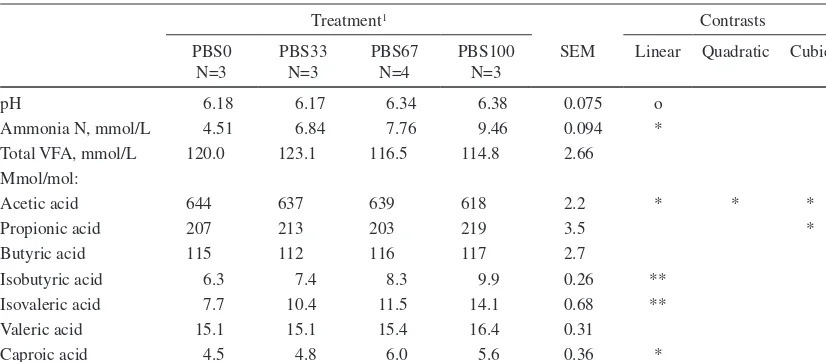
(7) AGRICULTURAL AND FOOD SCIENCE Vol. 15 (2006): 235–251. Table 3. Chemical composition, fermentation quality and feeding value of the feeds. Grass silage Pea-barley silage Concentrate N=4 N=4 N=1 Dry matter (DM) (g kg-1) pH Chemical composition (g kg-1 DM) Ash Crude protein Crude fat Neutral detergent fibre Acid detergent fibre Acid detergent lignin Indigestible neutral detergent fibre Water soluble carbohydrates Starch Lactic acid Acetic acid Propionic acid Butyric acid Ethanol Ammonia N (g kg-1 total N) Soluble N (g kg-1 total N) Digestible organic matter (g kg-1 DM)1 Metabolizable energy (MJ kg-1 DM)2 Amino acids absorbed from the small intestine (g kg-1 DM)2 Protein balance in the rumen (g kg-1 DM)2 Silage DM intake index3. 559 5.16. 255 3.96. 871. 69 131 34 557 274 5 92 139. 73 170 27 419 260 19 156 30 100 104 15 0.41 0.16 6.5 108 751 650 10.0 82 30 87. 75 192 48 284 95 18 52 89 325. ND 5 6 0.42 0.18 2.3 31 517 660 10.5 81 -6 105. 12.9 115 8. According to Friedel (1990); 2According to Finnish Feed Tables (MTT 2004); According to Huhtanen et al. (2002): Silage DM intake index = 100 + 1.151 × [D-value (g kg-1 DM)690] – 0.000531 × [total acids (g kg-1 DM)2 – 6400] – 4.7650[Ln(Ammonia N (g kg-1 total N))-Ln(50)]; ND = not determined 1 3. Rumen fermentation. the lowest silage dry matter intake (DMI) (7.1 kg per day). As there was no difference in the intake of concentrate the effect of replacing GS with PBS on the proportion of concentrate in the diet (g kg-1 DM) and on the total DMI was curvilinear (P < 0.05). The effect of treatment on CP intake was also curvilinear (P < 0.05). Intake of NDF decreased and that of starch increased (Pquadr. < 0.05) as the proportion of PBS in the feeding increased. Feeding PBS had curvilinear (P < 0.05) effects on AAT and ME intake.. Rumen pH (Plin. < 0.10) and ammonia N concentration increased (Plin. < 0.05) as the proportion of PBS in the diet increased (Table 5). Concentration of VFA in the rumen fluid was not affected by the treatment. However, proportion of acetic acid in the VFA decreased and that of propionic acid increased in a cubic manner (P < 0.05) in response to feeding PBS. Replacing GS with PBS resulted in a linear increase (P < 0.01) in proportions of the. 241.
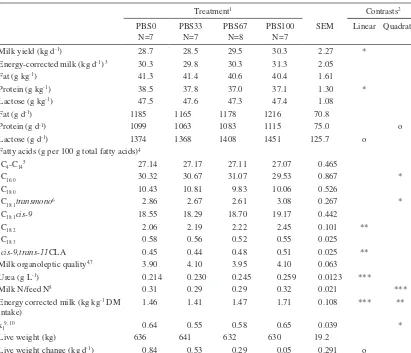
(8) AGRICULTURAL AND FOOD SCIENCE Pursiainen, P. & Tuori, M. Replacing grass silage with pea-barley intercrop silage for dairy cows Table 4. The effect of the treatment on in vivo apparent digestibility of the diet and feed and nutrient intake. Treatment1 PBS0 N=7 Diet digestibility (g kg-1) Organic matter 710 Crude protein 669 Neutral detergent fibre 592 Intake Silage [kg dry matter (DM) d-1] 9.2 Concentrate (kg DM d-1) 11.5 Total (kg DM d-1) 20.8 -1 Concentrate content (g kg DM) 560 Organic matter (kg d-1) 19.3 Crude protein (g d-1) 3447 Neutral detergent fibre (g d-1) 8400 Indigestible neutral detergent fibre (g d-1) 1468 Cell solubles (g d-1)3 10863 Water soluble carbohydrates (g d-1) 2269 Starch (g d-1) 3743 Amino acids absorbed from the small 2071 intestine (g d-1)4 Metabolizable energy (MJ d-1)5 219. Contrasts2. PBS33 N=7. PBS67 N=8. PBS100 N= 7. SEM. Linear. 696 650 576. 707 665 561. 704 673 531. 10.3 12.2 15.2. **. 9.7 11.5 21.1 550 19.6 3617 8176 1723 11455 1988 4065 2108. 9.0 11.5 20.4 570 19.0 3634 7436 1822 11569 1622 4334 2059. 7.1 11.5 18.5 630 17.2 3419 6210 1702 10983 1253 4424 1906. 0.72 0.13 0.70 21.5 0.65 105.1 341.2 94.3 310 67.2 62.5 55.9. *** * * *** *** *. 219. 215. 193. 6.5. **. Quadratic. **. *. ** ** **. * * * * * *. * * *. PBS0 = grass silage 100% of the silage DM; PBS33 = grass silage 67%, pea-barley silage 33% of the silage DM; PBS67 = grass silage 33%, pea-barley silage 67% of the silage DM; PBS100 = pea-barley silage 100% of the silage DM 2 No significant cubic effects; 3 Organic matter-neutral detergent fibre; 4 According to Finnish Feed Tables (MTT 2004) 5 Based on in vivo apparent digestibility Statistical significance *** = P < 0.001, ** = P < 0.01, * = P < 0.05, o = P < 0.10 1. branched-chain volatile fatty acids (BCVFA); isobutyric acid and isovaleric acid. No interactions were found between treatments and the time of sampling for any rumen fermentation parameters.. nor lactose concentrations (Table 6). Milk protein concentration decreased linearly (P < 0.05) with increasing amount of PBS. Milk fat yield was not affected by the treatment. Milk protein yield tended to change quadratically (P < 0.10) and lactose yield tended to increase linearly (P < 0.10) in response to increasing proportion of PBS in the diet. Replacing GS with PBS increased linearly (P < 0.01) milk linoleic acid (C18:2) and conjugated linoleic acid (cis-9,trans-11CLA) concentrations (Table 6). Considering the organoleptic quality (smell, taste) of milk, there was no distinct difference between the treatments (Pcub. < 0.10). Feeding PBS increased milk urea concentration linearly (P < 0.001) (Table 6). The efficiency. Milk yield, milk composition and feed utilisation Milk yield increased linearly (P < 0.05) as the proportion of PBS in the diet increased (Table 6) in spite of the impaired silage intake. However, increase in energy-corrected milk (ECM) yield was not significant. Treatment neither affected milk fat. 242.
(9) AGRICULTURAL AND FOOD SCIENCE Vol. 15 (2006): 235–251. Table 5. The effect of the treatment on rumen fermentation of the cows in square 1 (mean values of all sampling times). Treatment1. pH Ammonia N, mmol/L Total VFA, mmol/L Mmol/mol: Acetic acid Propionic acid Butyric acid Isobutyric acid Isovaleric acid Valeric acid Caproic acid. Contrasts. PBS0 N=3. PBS33 N=3. PBS67 N=4. PBS100 N=3. SEM. Linear. 6.18 4.51 120.0. 6.17 6.84 123.1. 6.34 7.76 116.5. 6.38 9.46 114.8. 0.075 0.094 2.66. o *. 644 207 115 6.3 7.7 15.1 4.5. 637 213 112 7.4 10.4 15.1 4.8. 639 203 116 8.3 11.5 15.4 6.0. 618 219 117 9.9 14.1 16.4 5.6. 2.2 3.5 2.7 0.26 0.68 0.31 0.36. *. Quadratic. Cubic. *. * *. ** ** *. PBS0 = grass silage 100% of the silage DM; PBS33 = grass silage 67%, pea-barley silage 33% of the silage DM; PBS67 = grass silage 33%, pea-barley silage 67% of the silage DM; PBS100 = pea-barley silage 100% of the silage DM Statistical significance *** = P < 0.001, ** = P < 0.01, * = P < 0.05, o = P < 0.10 1. of conversion of feed N into milk N differed quadratically (P < 0.001) between the treatments and was highest for pure PBS and GS. Live weight of the cows tended to increase during the experiment and was highest for PBS0 (Plin. < 0.10). The effect of replacing GS with PBS on the utilisation of ME for milk production (kl) was quadratic (P < 0.05).. under Finnish conditions, digestibility of whole crop barley is higher compared to that of whole crop wheat (MTT 1999). Higher digestibility is attributed to a greater ear-to-straw ratio and also to a better digestibility of straw compared with wheat. If rated according to DM yield wheat is superior to barley (MTT 1999). Changes in the CP, NDF and starch content of both pea and barley plants during maturation are consistent with earlier studies (Åman and Graham 1987, Mannerkorpi and Taube 1995, Mustafa and Seguin 2004). In pea plant fractions, a decline in the CP content (g kg-1 DM per day) from the full bloom to the harvest when the lower pods were already full was 8.6 g for pods, 5.1 g for leaves, 4.6 g for tendrils and 3.5 g for stems. Despite the greatest decline in the CP content, leaves and pods were the most protein-rich fractions of pea plant at harvest. The increase in the NDF content of pea during maturation remained moderate because the proportion of pods increased up to 500 g kg-1 DM and the proportion of fibre-rich stems and tendrils decreased from around 700 g kg-1 DM to 350 g kg-1 DM. In addition, the NDF content of pods de-. Discussion Intercrop and feed composition Foreign research of the potential of legume-cereal intercrop silage in dairy cow feeding has focused on pea-wheat silage (Salawu et al. 2002a, Ade sogan et al. 2004). In Finland both barley and spring wheat are suitable cereals for whole-crop silage production. In the present study barley was chosen as a companion crop for pea because only scarce information on the effects of pea-barley intercrop silage on milk production is available and,. 243.
(10) AGRICULTURAL AND FOOD SCIENCE Pursiainen, P. & Tuori, M. Replacing grass silage with pea-barley intercrop silage for dairy cows Table 6. The effect of the treatment on milk yield, milk composition and feed utilisation. Treatment1 PBS0 N=7 Milk yield (kg d-1) 28.7 Energy-corrected milk (kg d-1) 3 30.3 Fat (g kg-1) 41.3 Protein (g kg-1) 38.5 Lactose (g kg-1) 47.5 Fat (g d-1) 1185 Protein (g d-1) 1099 Lactose (g d-1) 1374 Fatty acids (g per 100 g total fatty acids)4 C4-C145 27.14 C16:0 30.32 C18:0 10.43 2.86 C18:1transmono6 18.55 C18:1cis-9 C18:2 2.06 C18:3 0.58 0.45 cis-9,trans-11CLA Milk organoleptic quality4,7 3.90 Urea (g L-1) 0.214 Milk N/feed N8 0.31 Energy corrected milk (kg kg-1 DM 1.46 intake) kl9, 10 0.64 Live weight (kg) 636 Live weight change (kg d-1) 0.84. PBS33 N=7 28.5 29.8 41.4 37.8 47.6 1165 1063 1368. PBS67 N=8 29.5 30.3 40.6 37.0 47.3 1178 1083 1408. 27.17 30.67 10.81 2.67 18.29 2.19 0.56 0.44 4.10 0.230 0.29 1.41 0.55 641 0.53. 27.11 31.07 9.83 2.61 18.70 2.22 0.52 0.48 3.95 0.245 0.29 1.47 0.58 632 0.29. Contrasts2 PBS100 N=7 30.3 31.3 40.4 37.1 47.4 1216 1115 1451 27.07 29.53 10.06 3.08 19.17 2.45 0.55 0.51 4.10 0.259 0.32 1.71 0.65 630 0.05. SEM 2.27 2.05 1.61 1.30 1.08 70.8 75.0 125.7 0.465 0.867 0.526 0.267 0.442 0.101 0.025 0.025 0.063 0.0123 0.021 0.108 0.039 19.2 0.291. Linear Quadratic *. *. o o. * * ** ** *** ***. *** ** *. o. PBS0 = grass silage 100% of the silage DM; PBS33 = grass silage 67%, pea-barley silage 33% of the silage DM; PBS67 = grass silage 33%, pea-barley silage 67% of the silage DM; PBS100 = pea-barley silage 100% of the silage DM 2 No significant cubic effects, except for milk organoleptic quality (Pcub.< 0.10) 3 According to Sjaunja et al. (1991): ECM (kg d-1) = milk yield (kg d-1) × [38.3 × fat (g kg-1) + 24.2 × protein (g kg-1) + 16.54 × lactose (g kg-1) + 20.7] / 3140 4 Analysed from the milk of the cows in square 2 (N = 4); 5Sum of C4:0, C6:0, C8:0, C10:0, C10:1, C12:0 and C14:0 6 Sum of C18:1(trans-6-8, trans-9, trans-10, trans-11, trans-12, trans-13 and -14, trans-15) 7 Scale: 0 = unsuitable for human consumption, 1 = extremely poor, 2 = poor, 3 = satisfactory, 4 = good, 5 = excellent 8 (milk protein g-d / 6.38) / (crude protein intake g-d / 6.25) 9 Efficiency of utilisation of ME for milk production, live weight change included 10 Based on in vitro (Friedel 1990) digestibility Statistical significance *** = P < 0.001, ** = P < 0.01, * = P < 0.05, o = P < 0.10 1. creased by 7.6 g kg-1 DM per day while that of stems and tendrils increased by 1.3 and 2.1 g kg-1 DM per day from the full bloom to the harvest. The development of the chemical composition of the different pea plant fractions and changes in. their proportion of the plant DM during maturation suggests that harvest should be delayed until pod filling stage is well advanced. Particularly important for the nutritional value of the silage is the substantial increase in starch content due to rapid. 244.
(11) AGRICULTURAL AND FOOD SCIENCE Vol. 15 (2006): 235–251. increase of the proportion of pods from the total plant DM. In their experiment, Åman and Graham (1987) suggested that for ruminants pea should be harvested when pods are only partly developed to ensure high digestibility and good ensiling characteristics. Apart from timing the harvest right, maintaining the nutritive value of forage also during harvesting is demanding. In the present study the starch content of PBS raw material at the outset of baling was clearly lower than that of either of the plants separately before mowing and after baling plenty of pieces of pods and ears were observed on the ground. This indicates that during mowing and baling part of the pods and ears were shed suggesting the importance of proper harvesting techniques to avoid harvesting losses of the most nutritive fractions. The DM content of PBS was approximately half of the DM content of GS. The major reason for this was the difference in weather conditions between the two ensilings. Grass was ensiled during a spell of dry and warm weather (+22.7ºC – +24.2ºC, max. temperatures for the days of mowing and ensiling, respectively) resulting in a rapid increase in the DM content. Wilting of PBS failed due to unstable weather conditions and also during baling there was a short but heavy rainfall. Partly the low DM content of PBS could be attributed to high proportion of pea (740 g kg-1 DM) in the mixture as also shown by Lunnan (1989). The DM content of pea plant tends to be low and increases slower than that of cereals during ripening (Lunnan 1989). Due to high proportion of pea in the intercrop PBS contained 39 g more CP kg-1 DM than GS. The NDF content of PBS decreased by 4% during ensiling. Hemicellulose breakdown during ensiling can be caused by hemicellulases present in the original herbage, bacterial hemicellulases or hydrolysis by organic acids which are produced during fermentation (McDonald et al. 1991). The composition of NDF differed between GS and PBS. The INDF content in the silage DM was 1.7fold higher in PBS compared to GS. Similarly, Stensig and Robinson (1997) and Kuoppala et al. (2005) reported higher INDF concentrations in. perennial legume silage compared to grass silage. Accumulation of INDF in rumen may limit intake (Stensig and Robinson 1997). Recently, Nousiai nen et al. (2003) showed that the INDF content of grass silage predicted its organic matter digestibility (OMD) more accurately than OM pepsin-cellulase solubility. Pea-barley silage was more extensively fermented than grass silage. This was attributed to the low DM content and high buffering capacity of PBS raw material. Furthermore, the preservative may not have been correct for PBS as AIV2000 is designed for wilted silages and thus the reduction of pH in PBS may not have been adequately fast. The proportion of ammonia N in PBS exceeded 80 g kg-1 total N, which is the limit for good quality silage according to Finnish recommendations (KTTK 1998). A high level of ammonia N in PBS was partly due to use of ammonium formiate containing preservative as there was almost no butyric acid, which is an indicator of clostridial activity (McDonald et al. 1991). Ammonium formiate is formed through the neutralization of part of the formic acid, which makes the additive less corrosive. When taking into account the additive originated ammonia N the proportion of ammonia N was 66 g kg-1 total N in PBS. Proteolysis was minimal in GS. Increased fermentation of PBS was also evidenced by the 77% lower WSC content of PBS compared to raw material. The lower starch content of PBS compared to that of raw material was probably mainly a result of a combination of losses of pods and ears during mowing and baling and to some degree of degradation of starch during ensiling (Rooke and Hatfield 2003). The D-values of the silages were similar and slightly low. In Finland, a minimum value of 690 g digestible organic matter per kg DM is recommended for high quality grass silage. However, D-value of both silages was based on OMD determination using cellulase method (Friedel 1990). No information of suitability of this method for predicting digestibility of pea-cereal silage is available. Overall, the considerably different DM content of the silages affected the extent of fermentation during ensiling. This, in turn, probably affected si-. 245.
(12) AGRICULTURAL AND FOOD SCIENCE Pursiainen, P. & Tuori, M. Replacing grass silage with pea-barley intercrop silage for dairy cows lage intake complicating the interpretation of the results. Accordingly, the results obtained in the present study represent replacement of wilted, restrictively fermented grass silage with more extensively fermented pea-barley silage.. et al. 2002, Adesogan et al. 2004) relating partly to changes in leaf-to-stem ratio (Mustafa and Seguin 2004). Digestibility of DM (Mustafa and Seguin 2004) and OM (Adesogan et al. 2002) of pea-cereal silage was suggested to be more dependent on the pea-to-cereal ratio than on the maturity of the sward at harvest, contrary to the digestibility of NDF (Adesogan et al. 2002, Mustafa and Seguin 2004). In their experiment, Mustafa and Seguin (2004) observed by 11.4% reduced in vitro NDF digestibility of pea-barley silage when harvesting was delayed from the flowering stage of pea to the pod fill stage. Intake of pure pea-barley silage was on an average 2.1 kg DM per day lower than the intake of pure grass silage. This is in contrast with previous studies where the intake of pea-wheat silage has been higher than that of grass silage both for cows (Salawu et al. 2002a, Adesogan et al. 2004) and sheep (Adesogan et al. 2002). However, in the present study cows fed PBS33 had higher silage DM intake than cows fed pure grass silage. Similarly, greater intakes of mixtures of perennial legumes and grass silage (Tuori et al. 2002, Dewhurst et al. 2003a, Kuoppala et al. 2005) and of wholecrop cereals and grass silage (Sutton et al. 1997, Jaakkola et al. 2003) than that of pure grass silage have been reported previously. Low intake of pure PBS was probably mainly attributed to its fermentation characteristics as high lactic acid and ammonia N concentrations are known to reduce silage intake (Huhtanen et al. 2002). Low intake of PBS100 was well described by silage DM intake index which is calculated on the basis of total fermentation acids, ammonia N content and D-value of the silage (Huhtanen et al. 2002). Low DM content of pea-barley silage raw material led to extensive fermentation with high level of lactic acid which is in accordance with information given by McDonald et al. (1991). Increasing the DM content of silage raw material by wilting (McDonald et al. 1991) or by reducing pea-to-cereal ratio (Lunnan 1989) appears to be beneficial to ensiling quality. Lower pea-to-cereal ratio could also diminish the impairing effect of high buffering capacity of pea on the ensiling quality. This suggests that considering the ensiling. Diet digestibility and feed intake Apparent digestibility of diet OM and CP was unaffected by replacing grass silage with pea-barley silage. This is in contrast to Adesogan et al. (2004) who reported significantly greater in vivo OM and CP digestibilities for pea-wheat (50:50 and 80:20) silages compared to first-cut grass silage. The CP contents of the silages were 166, 177 and 186 g kg-1 DM and NDF content 520, 520 and 534 g kg-1 DM, respectively. Using sheep, Adesogan et al. (2002) also measured higher CP digestibility values for pea-wheat (75:25) silage conserved at full pod stage compared to second-cut grass silage (Dvalue 584 g kg-1 DM), but found no difference in OM digestibility between the two forages. However, diet NDF digestibility in the present study decreased when the proportion of PBS in the feeding increased. The INDF content of PBS was also higher compared to that of GS in accordance with the lower in sacco NDF degradability (40.8 and 33.7% for GS and PBS, respectively, unpublished results). In addition, the higher NDF intake from concentrates for PBS100 cows (52.4% of diet NDF) compared to PBS0 cows (39% of diet NDF) partly accounted for the lower diet NDF digestibility for PBS100, since most of the concentrate NDF originated from barley and rapeseed whose fibre is poorly digested compared to silage fibre (MTT 2004). Similarly, Adesogan et al. (2002) reported lower NDF digestibility for pea-wheat silage compared to grass silage. Adesogan et al. (2004) on the contrary, found no significant difference in the in vivo NDF digestibility between pea-wheat silage and grass silage. Differences in digestibility of intercrop silages reflect differences in pea-to-cereal ratio (Salawu et al. 2002b), in maturity of the sward at harvest (Salawu et al. 2002b, Mustafa and Sequin 2004) and between pea varieties (Lunnan 1989, Mustafa. 246.
(13) AGRICULTURAL AND FOOD SCIENCE Vol. 15 (2006): 235–251. characteristics of pea the ratio of pea-to-barley was too high in the present study. From the point of view of the nutrition, silages from pea-cereal mixtures generally have lower nutritive value compared to pea monocultures (Mustafa and Seguin 2004). Salawu et al. (2002b) suggested that if the proportion of peas in the sward is less than 200 g kg-1 DM digestibility of pea-wheat intercrop silage is not more than moderate. According to Adesogan et al. (2002) increasing the proportion of peas above 400 g kg-1 DM only marginally increases the overall forage quality. Intake of PBS100 was probably also influenced by the low DM content of the silage. According to Steen et al. (1998) maximum grass silage intake was achieved at a DM concentration of 320 g kg-1. However, Rook and Gill (1990) found an increase in grass silage intake only up to a DM concentration of 250 g kg-1. Contribution of rumen fill to reduction in silage intake with increasing INDF intake as observed by Stensig and Robinson (1997) is unclear, since in the present study the intake of INDF was equal for PBS33 and PBS100.. high concentrations of WSC and low concentrations of lactic acid are characterised by rumen fermentation pattern rich in lipogenic VFAs (acetic acid and butyric acid), whereas rumen fermentation pattern in cows fed silages with high lactic acid concentration is characterised by increased proportion of propionic acid (Huhtanen et al. 2003b). Feeding PBS also increased the proportion of BCVFAs in rumen fluid. The BCVFAs are produced in the rumen by deamination and decarboxylation of the branched-chain amino acids (valine, leucine and isoleucine) and are required by many cellulolytic bacteria as essential growth factors (Gorosito et al. 1985). As there is no distinct difference in the branched-chain amino acid content between pea and barley seeds and grass (MTT 2004), the increase in proportion of BCVFAs in rumen fluid probably related to the higher amount of CP in PBS compared to that of GS. Dewhurst et al. (2003b) also found that concentration of BCVFAs in the rumen fluid increased when grass silage was replaced with forage legumes containing silages. Adesogan et al. (2004) observed no significant difference in molar percentages of isobutyric acid and isovaleric acid between pea-wheat silage and grass silage, but the proportion of BCVFAs in rumen fluid was numerically greater for pea-wheat intercrop diets.. Rumen fermentation The ammonia N content of rumen fluid increased with increasing proportions of PBS in the diet. This is in accordance with Charmley (2001) who reported increasing ruminal ammonia concentration with increasing amount and solubility of silage CP. In response to feeding PBS proportion of acetic acid in rumen fluid decreased and that of propionic acid increased in contrast to the results of Adesogan et al. (2004). Differences in rumen acetic acid and propionic acid contents between the experiments are likely related to differences in fermentation characteristics of the silages or in proportion of concentrate in the diet. In the present study the concentrate content of the diet [560 (PBS0), 550 (PBS33), 570 (PBS67) and 630 (PBS100) g kg-1 DM] differed significantly between the treatments and may have had some effect (McDonald et al. 2002). However, ensiling quality probably had a more marked effect. Restrictively-fermented silages containing relatively. Milk yield, milk composition and feed utilisation Replacing GS with PBS increased milk yield despite the decreased silage intake. However, treatment had no significant effect on the ECM yield. Cows fed PBS0 increased body weight more than cows fed PBS100 suggesting that there were differences in energy partition. Although in the present study the live weight change probably related more to differences in silage intake between the treatments. Milk fat and lactose concentrations remained unchanged in the present study being in agreement with study carried out with pea-wheat silage (Ade-. 247.
(14) AGRICULTURAL AND FOOD SCIENCE Pursiainen, P. & Tuori, M. Replacing grass silage with pea-barley intercrop silage for dairy cows sogan et al. 2004). In contrast to Adesogan et al. (2004) feeding PBS decreased milk protein concentration compared to grass silage. Salawu et al. (2002a) found that pea-wheat intercrop silage resulted in lower milk fat concentration than moderate quality second-cut grass silage but milk protein concentration was unaffected. Differences in milk fat and protein content between the experiments are partly related to differences in the fermentation quality of the silages. Increased fermentation of silage significantly decreases milk fat content through the effects on silage DMI and on the ratio of lipogenic to glucogenic VFA in the rumen. Milk protein content and yield decrease with increasing fermentation or proteolysis in the silo relating to reduced silage intake and microbial protein synthesis in the rumen (Huhtanen et al. 2003b). Furthermore, milk protein content is suggested to have a negative relationship with rumen pH (Seymor et al. 2005). The increase of conjugated linoleic acid (cis9,trans-11CLA) concentration in response to feeding PBS was statistically significant but numerically small. Adesogan et al. (2004) found no difference in milk C18:2 and cis-9,trans-11CLA concentrations between pea-wheat and grass silage. Salawu et al. (2002a) reported that feeding peawheat intercrop silages led to similar concentrations of CLA and higher concentrations of C18:2 compared to grass silage. Also perennial legumes have been reported to increase the levels of polyunsaturated fatty acids (PUFA) in milk (Dewhurst et al. 2003a). Dewhurst et al. (2003b) suggested that increased rumen passage rates with legumes may have reduced rumen biohydrogenation of PUFA to some extent. Furthermore, in their experiment Boufaïed et al. (2003) showed that perennial legumes had higher concentrations of C18:2 compared to perennial grasses. Feeding PBS increased milk urea concentration. The most important nutritional factor influencing milk urea N is dietary CP content (Nousiainen et al. 2004). In the present study the CP content of the diets were 166 (PBS0), 171 (PBS33), 178 (PBS67) and 185 (PBS100) g kg-1 DM. Milk urea concentration exceeded 0.16 g per l in all treatments indicating that there was no deficiency. in rumen degradable protein (Nousiainen et al. 2004). However, milk urea concentration remained clearly below 0.30–0.35 g per l in all treatments. This is suggested to be an upper limit attributed to poor N utilisation by rumen microbes (Huhtanen and Shingfield 2005). The efficiency of conversion feed N into milk N was higher for PBS0 and PBS100 and similar for PBS33 and PBS67 compared to the average efficiency of N utilisation (0.282) in grass silage based diets calculated by Huhtanen et al. (2003a). Furthermore, the efficiency of N utilisation for milk production in this experiment was notably higher in all treatments than Salawu et al. (2002a) reported for pea-wheat intercrop or grass silages. Differences in N utilisation between the experiments can be attributed to differences in the maturity of pea at harvest (Ade sogan et al. 2002, Salawu et al. 2002a, b) as well as CP concentration of grass silage, and thus to differences in CP content of the silages.. Conclusions Differences in the DM content and fermentation quality between the silages complicate the interpretation of the results of the present study. Accordingly, it can be concluded that pea-barley intercrop silage can replace up to two thirds of wilted, moderate quality grass silage in the feeding of dairy cows without decreasing silage intake. Further research on the potential of pea-cereal intercrop silage compared to high quality grass silage in the feeding of the high yielding dairy cows is needed. Also the need of protein supplementation on pea-cereal intercrop silage based diets requires further attention. Acknowledgements. The authors wish to thank the staff of the Viikki Research Farm for excellent caring for the experimental animals. The study was financially supported by the Finnish Ministry of Agriculture and Forestry. Pirjo Pursiainen gratefully acknowledges the financial support from the Agricultural Research Foundation of August Johannes and Aino Tiura.. 248.
(15) AGRICULTURAL AND FOOD SCIENCE Vol. 15 (2006): 235–251.. References Adesogan, A.T., Salawu, M.B. & Deaville, E.R. 2002. The effect on voluntary feed intake, in vivo digestibility and nitrogen balance in sheep of feeding grass silage or pea-wheat intercrops differing in pea to wheat ratio and maturity. Animal Feed Science and Technology 96: 161–173. Adesogan, A.T., Salawu, M.B., Williams, S.P., Fisher, W.J. & Dewhurst, R.J. 2004. Reducing concentrate supplementation in dairy cow diets while maintaining milk production with pea-wheat intercrops. Journal of Dairy Science 87: 3398–3406. Åman, P. & Graham, H. 1987. Whole crop peas. I. Changes in botanical and chemical composition and rumen in vitro degradability during maturation. Animal Feed Science and Technology 17: 15–31. Boufaïed, H., Chouinard, P.Y., Tremblay, G.F., Petit, H.V., Michaud, R. & Bélanger, G. 2003. Fatty acids in forages. I. Factors affecting concentrations. Canadian Journal of Animal Science 83: 501–511. Charmley, E. 2001. Towards improved silage quality. Canadian Journal of Animal Science 81: 157–168. Christie, W.W. 1982. A simple procedure for transmethylation of glycerolipids and cholesterol esters. Journal of Lipid Research 23: 1073–1075. Dewhurst, R.J., Fisher, W.J., Tweed, J.K.S. & Wilkins, R.J. 2003a. Comparison of grass and legume silages for milk production. 1. Production responses with different levels of concentrate. Journal of Dairy Science 86: 2598–2611. Dewhurst, R.J., Evans, R.T., Scollan, N.D., Moorby, J.M., Merry, R.J. & Wilkins, R.J. 2003b. Comparison of grass and legume silages for milk production. 2. In vivo and in sacco evaluations of rumen function. Journal of Dairy Science 86: 2612–2621. Friedel, K. 1990. Die Schätzung des energetischen Futterwertes von Grobfutter mit Hilfe einer Cellulasemethode. Wissenschaftliche Zeitschrift der Universität Rostock , N-Reihe 39, 8: 78–86. Givens, I. & Rulquin, H. 2004. Utilisation by ruminants of nitrogen compounds in silage-based diets. Animal Feed Science and Technology 114: 1–18. Gorosito, A.R., Russell, J.B. & Van Soest. P.J. 1985. Effect of carbon-4 and carbon-5 volatile fatty acids on digestion of plant cell wall in vitro. Journal of Dairy Science 68: 840–847. Griinari, J.M., Dwyer, D.A., McGuire, M.A., Bauman, D.E., Palmquist, D.L. & Nurmela, K.V.V. 1998. Trans-octadecenoic acids and milk fat depression in lactating dairy cows. Journal of Dairy Science 81: 1251–1261. Huhtanen, P., Blauwiekel, R. & Saastamoinen, I. 1998. Effects of intraruminal infusions of propionate and butyrate with two different protein supplements on milk production and blood metabolites in dairy cows receiving grass silage-based diet. Journal of the Science of Food and Agriculture 77: 213–221. Huhtanen, P., Khalili, H., Nousiainen, J.I., Rinne, M., Jaakkola, S., Heikkilä, T. & Nousiainen, J.����������� 2002. Prediction of the relative intake potential of grass silage. by dairy cows. Livestock Production Science 73: 111– 130. Huhtanen, P., Nousiainen, J.I. & Khalili,H. 2003a. Efficiency of N utilisation in milk production. In: Proceedings of the NJF’s 22nd congress “Nordic agriculture in global perspective”, Turku, Finland. Updated 15 Sept 2003. Available on the Internet: http:// www.njf.dk/njf/reports/njfreports.htm Huhtanen, P., Nousiainen, J.I., Khalili, H., Jaakkola, S. & Heikkilä, T.����������������������������������������� 2003b. Relationships between silage fermentation characteristics and milk production parameters: analyses of literature data. Livestock Production Science 81: 57–73. Huhtanen, P. & Shingfield, K. 2005. Grass silage: factors affecting efficiency of N utilisation in milk production. In: Park, P.S. & Stronge, M.D. (eds.). Silage production and utilisation. Proceedings of the 24th international silage conference, a satellite workshop of the 20th international grassland congress, Belfast, Northern Ireland. Wageningen, Wageningen Academic Publishers. p. 35–50. Huida, L., Väätäinen, H. & Lampila, M. 1986. Comparison of dry matter contents in grass silages as determined by oven drying and gas chromatographic water analyses. Annales Agriculturae Fenniae 25: 215–230. Jaakkola, S., Saarisalo, E. & Heikkilä, T. 2001. Whole-crop barley silage for dairy cows. In: Production and utilization of silage, with emphasis on new techniques. NJF seminar no. 326, Lillehammer, Norway. p. 69–74. Jaakkola, S., Saarisalo, E. & Heikkilä, T. 2003. Concentrate supplementation of dairy cow diet based on whole crop barley and wheat silage. In: Niemeläinen, O. & TopiHulmi, M. (eds.). Proceedings of the NJF’s 22nd congress “Nordic agriculture in global perspective”, Turku, Finland. Updated 15 Sept 2003. Available on the Internet: http:// www.njf.dk/njf/reports/njfreports.htm. p. 10. Kokkonen, T., Tuori, M., Leivonen, V. & Syrjälä-Qvist, L. 2000. Effect of silage dry matter content and rapeseed meal supplementation on dairy cows. 1. Milk production and feed utilisation. Animal Feed Science and Technology 84: 213–228. KTTK 1998. Kasvintuotannon tarkastuskeskus/maatalouskemian osasto. Tiedote 7. Kuoppala, K., Ahvenjärvi, S., Rinne, M. & Vanhatalo, A. 2005. NDF digestion in dairy cows fed grass or red clover silages cut at two stages of growth. In: Park, P.S. & Stronge, M.D. (eds.). Silage production and utilisation. Proceedings of the 24th international silage conference, a satellite workshop of the 20th international grassland congress, Belfast, Northern Ireland. Wageningen, Wageningen Academic Press. p. 164. Littell, R.C., Milliken, G.A., Stroup, W.W. & Wolfinger, R.D. 1996. SAS system for mixed models. SAS Institute Inc., Cary, NC. Lunnan, T. 1989. Barley-pea mixtures for whole crop forage. Effects of different cultural practises on yield and quality. Norwegian Journal of Agricultural Science 3: 57–71. McDonald, P., Edwards, R.A., Greenhalgh, J.F.D. & Mor-. 249.
(16) AGRICULTURAL AND FOOD SCIENCE Pursiainen, P. & Tuori, M. Replacing grass silage with pea-barley intercrop silage for dairy cows forages harvested at different maturity stages for ruminants. Animal Feed Science and Technology 96: 43– 53. Salawu, M.B., Adesogan, A.T., Weston, C.N. & Williams, S.P. 2001. Dry matter yield and nutritive value of pea/ wheat bi-crops differing in maturity at harvest, pea to wheat ratio and pea variety. Animal Feed Science and Technology 94: 77–87. Salo, M.-L. & Salmi, M. 1968. Determination of starch by the amyloglucosidase method. Journal of the Scientific Agricultural Society of Finland 40: 38–45. Seymor, W.M., Campbell, D.R. & Johnson, Z.B. 2005. Relationships between rumen volatile fatty acid concentrations and milk production in dairy cows: a literature study. Animal Feed Science and Technology 119: 155– 169. Sjaunja, L.O., Baevre, L., Junkkarinen, L., Pedersen, J. & Setälä, J. 1991. A Nordic proposal for an energy corrected milk (ECM) formula. In: Gaillon, P. & Chabert, Y. (eds.). Performance recording of animals: State of the art 1990. EAAP Publication no. 50, PUDOC, Wageningen, the Netherlands. p. 156–157. Steen, R.W.J., Gordon, F.J., Dawson, L.E.R, Park, R.S., Mayne, C.S. Agnew, R.E., Kilpatrick, D.J. & Porter, M.G. 1998. Factors affecting the intake of grass silage by cattle and prediction of silage intake. Animal Science 66: 115–127. Stensig, T. & Robinson, P.H. 1997. Digestion and passage kinetics of forage fiber in dairy cows as affected by fiber-free concentrate in the diet. Journal of Dairy Science 80: 1339–1352. Sutton, J.D., Abdalla, A.L., Phipps, R.H., Cammell, S.B. & Humphries, D.J. 1997. The effect of the replacement of grass silage by increasing proportions of urea-treated whole-crop wheat on food intake and apparent digestibility and milk production by dairy cows. Animal Science 65: 343–351. Tuori, M., Syrjälä-Qvist, L. & Jansson, S. 2002. Red clover and meadow fescue in different proportions in milk production. In: Gechie, L.M. & Thomas, C. (eds.). Proceedings of the 9th international silage conference, Auchincruive, Scotland. SAC. p. 130–131. Van Keulen, J. & Young, B.A. 1977. Evaluation of acid-insoluble ash as a natural marker in ruminant digestibility studies. Journal of Animal Science 44: 282–287. Van Soest, P.J., Robertson, J.B. & Lewis, B.A. 1991. Methods for dietary fiber, neutral detergent fiber, and nonstarch polysaccharides in relation to animal nutrition. Journal of Dairy Science 74: 3583–3597. Weissbach, F. 1992. Bestimmung der Pufferkapazität. Manual, Bundesforschungsanstalt für Landwirtschaft Braunschweig-Völkenrode, (FAL), Institut für Grünlandund Futterpflanzenforschung. 3 p.. gan, C.A. 2002. Animal nutrition. 6th ed. Pearson Education Ltd. 693 p. McDonald, P., Henderson, A.R. & Heron, S.J.E. 1991. The Biochemistry of silage. 2nd ed. Chalcombe Publications, Marlow, UK. 340 p. Mannerkorpi, P. & Taube, F. 1995. Feeding value of barley plants as related to stage of maturity. 1. Morphological and chemical composition and in vitro digestibility. Acta Agriculturae Scandinavica, Section A, Animal Science 45: 147-151. MTT 1999. Kokoviljasäilörehu maatilan viljelyresurssien optimoinnissa: viljalajin ja -lajikkeiden vaikutus rehuarvoon. Loppuraportti. Maatalouden tutkimuskeskus ja Boreal Suomen Kasvinjalostus. 48 p. MTT 2004. Rehutaulukot ja ruokintasuositukset (Feed tables and feeding recommendations). Jokioinen: MTT Agrifood Research Finland. Updated 30 June 2004. Cited 17 May 2005. Available on the Internet: http:// www.agronet.fi/rehutaulukot/ Mustafa, A.F., Christensen, D.A. & McKinnon, J.J. 2000. Effects of pea, barley and alfalfa silage on ruminal nutrient degradability and performance of dairy cows. Journal of Dairy Science 83: 2859–2865. Mustafa, A.F. & Seguin, P. 2004. Chemical composition and in vitro digestibility of whole-crop pea and pea-cereal mixture silages grown in south-western Quebec. Journal of Agronomy and Crop Science 190: 416–421. Mustafa, A.F., Seguin P., Ouellet, D.R. & Adelye, I. 2002. Effects of cultivars on ensiling characteristics, chemical composition, and ruminal degradability of pea silage. Journal of Dairy Science 85: 3411–3419. Nousiainen, J., Rinne, M., Hellämäki, M. & Huhtanen, P. 2003. Prediction of the digestibility of primary growth and regrowth grass silages from chemical composition, pepsin-cellulace solubility and indigestible cell wall content. Animal Feed Science and Technology 110: 61–74. Nousiainen, J., Shingfield, K.J. & Huhtanen, P. 2004. Evaluation of milk urea nitrogen as a diagnostic of protein feeding. Journal of Dairy Science 87: 386–398. Rook, A.J. & Gill, M.S. 1990. Prediction of the voluntary intake of grass silages by beef cattle. 1. Linear regression analyses. Animal Production 50: 425–438. Rooke, J.A. & Hatfield, R.D. 2003. Biochemistry of ensiling. In: Buxton, D.R. et al. (eds.). Silage science and technology. Agronomy No 42. ASA-CSSA-SSSA. Madison, Wisconsin, USA. p. 95–139. Salawu, M.B., Adesogan, A.T. & Dewhurst, R.J. 2002a. Forage intake, meal patterns and milk production of lactating dairy cows fed grass silage or pea-wheat bi-crop silages. Journal of Dairy Science 85: 3035–3044. Salawu, M.B., Adesogan, A.T., Fraser, M.D., Fychan, R. & Jones, R. 2002b. Assesment of the nutritive value of whole crop peas and intercropped pea-wheat bi-crop. 250.
(17) AGRICULTURAL AND FOOD SCIENCE Vol. 15 (2006): 235–251.. SELOSTUS Herne-ohrakasvustosta säilörehua lypsylehmille nurmisäilörehun sijaan Pirjo Pursiainen ja Mikko Tuori Helsingin yliopisto. Tässä tutkimuksessa selvitettiin herneen ja ohran seoskasvustosta tehdyn säilörehun vaikutusta lypsylehmien rehun syöntiin, rehun sulavuuteen ja maitotuotokseen. Tutkimuksessa oli mukana kahdeksan ayrshirelehmää, jotka jaettiin koejärjestelyssä kahteen 4 × 4 latinalaiseen neliöön. Herneen ja ohran seoskasvustosta tehdyllä säilörehulla korvattiin 0, 33, 67 tai 100 % säilörehun kuivaaineesta nurmisäilörehun osuuden vastaavasti vähentyes sä. Herne-ohrasäilörehu paalattiin, kun palkojen osuus herneen kuiva-aineesta oli puolet ja ohra oli taikinavaiheen alussa. Herneen osuus seoksen kuiva-aineesta oli 74 %. Nurmisäilörehu oli esikuivattua ensisadon timotei-nurminatarehua. Molemmat rehut tehtiin pyöröpaaleihin AIV2000-liuosta (5 l/tn rehua) käyttäen. Herne-ohrasäilörehussa oli kuiva-ainetta keskimäärin 255 ja nurmisäilörehussa 559 g kilossa. Rehujen pH oli vastaavasti 3,96 ja 5,16. Herne-ohrasäilörehu sisälsi raakavalkuaista keskimäärin 170 ja neutraalidetergenttikuitua 419 g kilossa kuiva-ainetta ja nurmisäilörehu vastaavasti 131 ja 557 g kilossa kuiva-ainetta. Herne-ohrasäilörehu oli pidemmälle käynyttä kuin nurmisäilörehu (käymishappojen kokonaismäärä 120 vs. 12 g kilossa. kuiva-ainetta). Rehuissa oli erittäin vähän voihappoa. Lehmät saivat säilörehua vapaasti. Väkirehuna oli viljarypsipohjainen perustäysrehu, jota annettiin 12 kg tai 14,5 kg päivässä. Säilörehun syönti oli eri ruokinnoilla 9,2 (0 %), 9,7 (33 %), 9,0 (67 %) ja 7,1 (100 %) kiloa kuiva-ainetta päivässä. Ruokinta ei vaikuttanut dieetin orgaanisen aineen eikä raakavalkuaisen sulavuuteen. Neutraalidetergenttikuidun sulavuus heikkeni herne-ohrasäilörehun osuuden kasvaessa. Maitotuotos eri ruokinnoilla oli 28,7 (0 %), 28,5 (33 %), 29,5 (67 %) ja 30,3 (100 %) kiloa päivässä. Energiakorjatussa maitotuotoksessa ei ollut merkitsevää eroa eri ruokintojen välillä. Maidon val kuaispitoisuus kuitenkin pieneni herne-ohrasäilörehun osuuden lisääntyessä. Säilörehujen erilainen kuiva-ainepitoisuus ja käymislaatu vaikeuttavat kokeen tulosten tulkintaa. Kuitenkin tämän tutkimuksen mukaan herneen ja ohran seoskasvustosta tehty säilörehu voi korvata kaksi kolmasosaa esikuivatun, sulavuudeltaan keskimääräisen nurmisäilörehun kuiva-aineesta lypsylehmien ruokinnassa vähentämättä säilörehun syöntiä.. 251.
(18)
Figure
+3
Related documents
rubens as a subspecies is based only on a superficial similarity of inflorescence structure (compact panicle) and is otherwise not actually justified. Based on the number of
Public Information: The competencies inform the public, employers, and other health care providers about registered nursing practice, and assist with accurate expectations
• Dose arrives, prepared and administered by NM • Patient care from familial caregivers and nurses • Patient discharges after 4-5 days. • Imaging on last day
This chapter is a brief methodological note on the matching of Italian firms in the AIDA (Bureau van Dijk) database with patent applicants to the European Patent Office (EPO) from
In full factorial designs, or in high-resolution designs, the higher order interactions can be assumed to be not active, and the squared mean of their
single binary problem by maximising the margin between multiple k- classes as well as relationship between the classes using stochastic gradient descent algorithm with
This implies that the Proposed Alternative Robust Method is insensitive to both percentage and magnitude of outliers than the Minimum Covariance Determinant
