A Framework for Scientific Data Mining
in Hydro-Acoustic Data Sets
Bart Buelens, Ray Williams, Arthur Sale
School of Computing
University of Tasmania
Sandy Bay, Tasmania, Australia
[email protected]
Tim Pauly
SonarData Pty Ltd
Hobart, Tasmania, Australia
A
BSTRACTA data mining framework for handling large volumes of scientific hydro-acoustic backscatter data is proposed. The method is applicable to data collected by the new generation of multibeam echosounders, capable of logging acoustic backscatter data for the full watercolumn. Such instruments are increasingly used for fisheries applications. The data mining technique is based on an inverse modeling of the underlying physics and electronics of a generic multibeam sonar system. A set of tagged soundings is obtained, which serves as a base for further advanced analysis techniques. It is anticipated that the proposed framework will serve as a tool for scientific fisheries research.
1. INTRODUCTION
Current scientific research projects often produce enormous data sets containing a variety of measured, modeled or predicted quantities. Typical examples include climate modeling and weather forecasting, but also astronomy, biology, geology and other scientific disciplines have to cope with very large data sets. Techniques to process and analyze such data sets are referred to as scientific data mining techniques, data mining being the process of extracting useful information from the data [1].
Recently, a new generation of multibeam echosounders has become available. These systems have the capability of recording backscattered sound pressure measurements for the whole water column, not just the seafloor as was previously the case. This collection of mid-water data has increased the data volumes considerably, and has made the structure of the data more complicated. Mid-water data is typically collected with single beam digital fisheries echosounders, which have only one narrow acoustic beam, while multibeam systems have a fan of dozens or even hundreds of beams. The multibeam data is basically 3-dimensional, rather than 2-dimensional, as is the case for single beam systems. A basic multibeam system would collect at least 128 by 500 complex-valued data points every half a second or faster, for hours at end, sometimes even days. A data collection rate of 1 Gigabyte per hour is not exceptional. Data is generally stored in a custom binary format on disk.
In recent years, processing and analysis of echosounder data has always been possible on standard high-end desktop or laptop computers. The scientific community is expecting that to be the case as well for mid-water
multibeam data. In this paper, a data mining framework to handle these multibeam data sets is outlined.
2. MULTIBEAM ECHOSOUNDING
Echosounding is a common technique to see underwater, by acoustic means. Traditional single beam systems have one narrow acoustic beam down in the water, while multibeam systems have a fan of beams all working simultaneously [2-4].
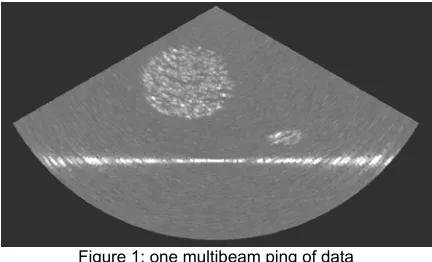
[image:1.612.316.532.468.599.2]A multibeam echosounder transmits a short acoustic pulse, and receives its echo on an array of transducer elements. The received signal is sampled and subsequently beamformed. The echo return of one pulse is commonly referred to as a ping. A multibeam ping of data is a 2-dimensional array of complex numbers (amplitude and phase of the return signal). The amplitudes can be visualized to form an acoustic image, as in figure 1. A multibeam data set contains thousands of such pings, where each ping has some meta-data associated with it as well, including a time stamp, geographic location, depth of transducer below the water, compass heading of the vessel on which the system was deployed, vessel attitude (roll, pitch, heave) etc.
Figure 1: one multibeam ping of data
Multibeam data sets are stored on disk by the multibeam data recording instrumentation, and are then available to scientists for their use. Multibeam data can be used for various purposes.
Echosounding, both traditional bottom-only multibeam as well as mid-water single beam sounding, has three main applications. They are described below.
2.1. FISH AND BIOMASS
fish, and other organisms in the water. Appropriate analysis of the data can provide scientists with a measure of fish abundance, and of fish school sizes. Standard techniques exist to derive such information from data from single beam echosounders [2], but these algorithms are not applicable to multibeam data. Even the proper calibration of multibeam systems has proven to be less than straightforward [5]. The extra dimension of multibeam data will also allow for better target tracking of individual fish, school determination, observation of single fish and schooling behaviour, and ultimately species identification and classification [4].
2.2. BATHYMETRY
Standard multibeam systems are used for the determination of the bathymetry, or seabed surface. This allows for the creation of a Digital Elevation Model (DEM) which can be used to generate navigation charts for example. It is common practice in hydrography to use standard multibeam systems for bathymetric work, without collecting mid-water data [3].
2.3. SEABED CLASSIFICATION
Bathymetry offers a measurement of depth, but gives no information about the characteristics of the seabed in a particular area.
Techniques exist to determine the seabed type from data collected by single beam systems; types of seabed can be sand, rock, seagrass etc. These techniques consist of the extraction of signal features from the acoustic backscatter data which are used as surrogates to infer seabed type [6-7].
Multibeam backscatter data is also increasingly used for seabed classification, for example [8]. The increased availability of water column multibeam data from new systems will also improve the availability of data for seabed classification. Multibeam systems result in better overall statistical classification confidence because of their much greater coverage. Seabed classification algorithms have been under development for some time but no general standard has been adopted.
2.4. THE MULTIBEAM ADVANTAGE
New challenges lie in exploiting multibeam data for fisheries applications, and in the combined usage of the data for determination of bathymetry, as well as seabed classification. The drive for multi use of this data is coming from funding agencies and scientists who have identified significant savings through both hardware costs (use of a single rather than multiple systems) and survey costs with multiple uses for data sets. The multiple uses of these data sets require a new approach to analysis. The next section describes a suggested approach which will facilitate such analyses.
3. ADATA MINING FRAMEWORK
Classical approaches to echosounding using standard instrumentation like single beam echosounders are well established, but these new multibeam echosounders
present the scientists with a problem as far as data handling and extraction of useful information is concerned. For example, it is no longer possible to visualize a few hours of raw recorded data in one image.
Approaching this issue from the computational intelligence perspective, the problem of extraction of information is placed in a data mining framework. Data mining is the procedure of analyzing and processing raw echosounder data and generating derived data products. A data product is an end result, presented in such a form that it provides useful information to scientists. Depending on the use being made of the multibeam data set (see sections 2.1 – 2.3), data products can take different shapes and forms.
In the next section, a process is described that leads to a basic data product that can be used directly, or that can be the starting point for further, more advanced data mining and information extraction procedures.
4. MODELING AND MODEL INVERSION
In analyzing scientific measurements, it often helps to have background knowledge of the underlying system that brought those measurements about. It may then be possible to work backwards from the measurements, and thus gain an insight in what was being measured [9].
The following sections describe this approach for the multibeam echosounding process.
4.1. MODELING THE MULTIBEAM ECHOSOUNDING PROCESS
To gain a better understanding of the underlying principles of a multibeam system, a computational model is required. In previous work, the authors developed a model of the multibeam echosounding process [10]. The model includes an acoustic model, describing the propagation, refraction and reflection of underwater sound, and a model of a generic multibeam echosounder and its digital signal processor unit. The model acts as a simulator, by generating a multibeam dataset, given a description of an underwater environment in 3 dimensions. It was shown that the data generated by the model is representative of data collected by real multibeam instruments.
Formalizing this approach, define
Ψ the underwater environment,
M the model,
∆ the data (output of the model).
Appling the model in a standard forward fashion, we get
∆ = M(Ψ)
includes a sequence of acoustic images (see figure 1), as well as the associated meta-data, such as time tag and geographic location.
4.2. THE MODEL INVERSION PRINCIPLE
The computational multibeam echosounding model described in the previous section is used as a starting point for applying the model inversion technique, working backwards from the data to the input to the model, the 3-dimensional underwater environment. Inverting the model means calculating Ψ, given ∆, as follows
Ψ = M-1(∆).
Often, the inverse model M-1 is not easily available, even though M is known. M is generally a complex system, which is not analytically invertible. While the acoustic ray tracing component of the model is invertible in principle, the subsequent signal processing functions are not, which means that the multibeam echosounding model M is not invertible overall.
The situation where the inverse of a known model has to be determined is called an inverse problem (see [11] for a list of references). There are various approaches to model inversion. The one that is followed here is to approximate M by an invertible model, say F. If F is invertible, it is possible to calculate F-1(∆),
F-1(∆) = Ω,
where Ω needs to be a close enough approximation of Ψ
for F to be useful. It is essential to choose a model F
which is invertible and which approximates M closely.
4.3. CONVOLUTION AS A CHOICE FOR F
As a proof of concept, a convolution function C is chosen, so that it approximates M. More sophisticated approximations to M are possible, and may result in improved overall outcomes. However, the visual as well as the acoustic image generation process is often modeled as a convolution, with its inverse being a deconvolution [12-14]. It can therefore be expected that this choice will lead to reasonable results.
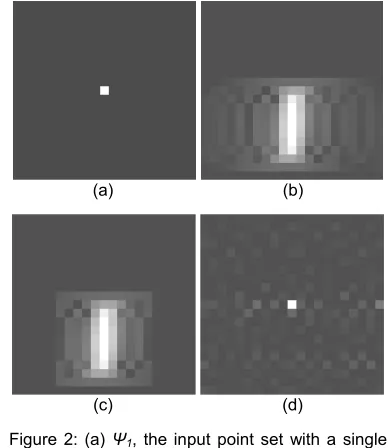
In order to determine C for a given M, a special input set
Ψ1 is created consisting of a single scatterer. The data set ∆1 = M(Ψ1) contains a single acoustic image with a
response at the location of the single scatterer. The Point Spread Function (PSF) of the convolution C is now defined in terms of ∆1, by choosing the local
neighborhood of the response in the output image ∆1.
C(Ψ1) must be close enough to M(Ψ1) for the choice of
the PSF to be considered appropriate. An example is given in figure 2 (a)-(c).
The PSF of C is used in the deconvolution C-1,
approximating M-1. Indeed, it was found that
Ω1 = C-1(∆1) is a good approximation of
Ψ1 = M-1(∆1).
See figure 2 (d).
4.4. MODEL INVERSION FOR REAL DATA
In the case of real data, rather than modeled data, the model M is not available. Information about real world echosounding systems is not generally released into the public domain by instrument manufacturers, so it is not possible to model such systems accurately. Furthermore, the actual physical conditions of the underwater environment, such as the sound speed, water temperature, salinity etc, are not always known exactly. All of these quantities will affect the propagation and refraction of underwater sound.
As explained in the previous section, finding C-1 is
equivalent to finding an appropriate PSF. In the modeled data, the PSF was defined in terms of the output data of the model, without actual knowledge of the model itself. For this to be possible with real data, an appropriate data set is needed. Such a data set must include the response of a single scatterer, and it must also be known where the scatterer was located in the acoustic beam at the time of the ping.
Fortunately, placing a single scatterer (a calibration sphere) in the acoustic beam in a known location is part of the echosounder calibration procedure [2, 5]. This means that in practice, anyone undertaking serious fisheries work with a multibeam instrument will have the required data set available to construct the PSF needed for the model inversion C-1.
(a) (b)
(c) (d)
Figure 2: (a) Ψ1, the input point set with a single scatterer; (b) ∆1, the resulting acoustic image; (c) graphical representation of C(Ψ1); (d) Ω1 = C-1(∆1), the result of the inverse model. Observe the similarity between (a) and (d).
5. DATA PRODUCTS
[image:3.612.325.519.371.595.2]A hydro-acoustic data set can lead to a variety of data products. A good data mining technique allows for easy creation of different data products, depending on the application, and the needs of the scientists.
5.1. THE SET OF TAGGED SOUNDINGS
The procedure for model inversion as described in the previous section leads from a raw data set ∆ to a derived set Ω. Ω is a set of data points with 3 spatial coordinates, a time tag, and a quantity describing the strength of the returned echo signal at that point. Each such point will be referred to as a sounding, maintaining analogy and consistency with terminology in multibeam echosounding for hydrographic purposes (see section 2.1). Formally,
Ω = {si}, i = 1…N,
with N the number of soundings s in Ω.
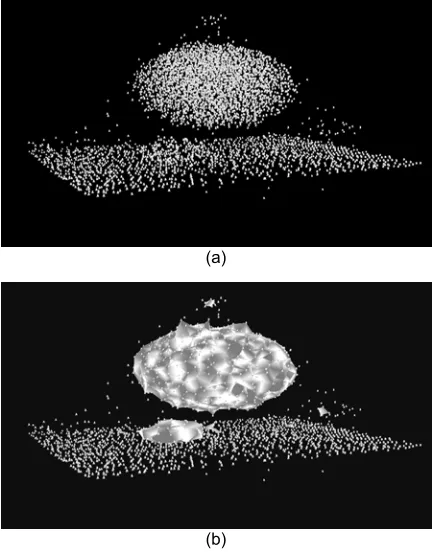
The direct visual representation of Ω in itself is a data product, in that Ω forms an approximation to the underlying underwater environment Ψ. It is an adequate data product for fish behavior studies. Figure 3 (a) shows a 3-dimensional interactive environment, which is a scientific visualization. The data shown in figure 3 was obtained by applying the model inversion technique to a data set that was generated using the forward multibeam echosounding model (see section 4.1). Scientific data visualization is an important aspect of data mining, and is also becoming recognized as a tool in underwater acoustics in general, and in fisheries acoustics research in particular [15].
Also, Ω can be used as a new base for further analysis, possibly in combination with the original data set ∆. It is envisaged that new attributes can be tagged to the soundings, for example information describing their spatial distribution, the average echo strength signal in a neighborhood, etc.
Further data products can be derived from Ω by applying various algorithms. An example is given in the next section.
5.2. FISH SCHOOL VOLUMES
As an example of a data product derived from Ω, fish school volumes are determined from the set of soundings
Ω. In doing so, only the spatial coordinates of the soundings are taken into account, assuming that the time scale is short enough to be irrelevant (i.e. all spatial neighbouring data was collected in a short time frame). A 3-dimensional spatial segmentation is thus obtained.
A 3-dimensional mesh of tetrahedra can be created by using the common computational geometry technique of Delaunay triangulation [16], applied in 3 dimensions. Of the set of resulting tetrahedra, only those for which all edges are shorter than a selected threshold value are retained. Coherent groups of remaining tetrahedra are considered to be objects: in this case fish schools. This volumetric description provides measures of school
volume and surface area and enables the calculation of the mean echo intensity. An example of a data set containing some schools is given in figure 3. This is effectively a spatial clustering of the elements of Ω.
Clusters can be processed further, for example by rejecting small clusters, or clusters which do not conform to a preselected model.
(a)
(b)
Figure 3: (a) visual representation of the spatial dimensions of the soundings in the set Ω; (b) volumetric segmentation in clusters, effectively describing fish schools.
6. GATEWAY TO ADVANCED DATA MINING
Having a set of tagged soundings available, and being able to link them together in coherent clusters, thus effectively forming a volumetric segmentation, offers a basis for further advanced data mining techniques.
It will now be possible to use features of both individual soundings as well as of clusters, to classify the data, leading to classifications of fish into classes of different species, and of areas of seabed into classes of different seabed types.
This research is currently ongoing, with new results expected in the near future.
7. CONCLUSIONS
A general framework was outlined describing a data mining approach to processing and analyzing multibeam echosounder measurements. A base data product, a set of tagged soundings, is obtained as a result.
[image:4.612.316.535.138.415.2]8. ACKNOWLEDGEMENTS
SonarData Pty Ltd, Hobart, Tasmania, Australia are funding this research. Their continuing support is acknowledged.
It is anticipated that some or all of the research results presented in this paper will be incorporated in the SonarData products, in particular in the Echoview software package.
R
EFERENCES[1] R. Grossman, Data mining for scientific and engineering applications. Kluwer Academic Publishers, 2001.
[2] D. N. McLennan, E. J. Simmonds, Fisheries acoustics. Chapman & Hall, 1991.
[3] E. Hammerstad, “Advanced multibeam echosounder technology,” Sea Technology, vol. 36, pp. 67-69, 1995.
[4] F. Gerlotto, M. Soria, P. Fréon, “From two
dimensions to three: the use of multibeam sonar for a new approach in fisheries acoustics,” Canadian Journal of Fisheries and Aquatic Science, vol. 56, pp. 6-12, 1999.
[5] N. A. Cochrane, Y. Li, G. D. Melvin,
“Quantification of a multibeam sonar for fisheries assessment applications,” Journal of the Acoustical Association of America, vol. 114, pp. 745-758, 2003.
[6] T. A. Wilding, M. D. J. Sayer, P. G. Provost, “Factors affecting the performance of the acoustic ground discrimination system RoxAnn ™,” ICES Journal of Marine Science, vol. 60, pp. 1373-1380, 2003.
[7] K. E. Ellingsen, J. S. Gray, E. Bjornbom,
“Acoustic classification of seabed habitats using the QTC View ™ system,” ICES Journal of Marine Science, vol. 59, pp. 825-835, 2002. [8] R. J. Kloser, T. Ryan, P. Sakov, et al. “Remote
sensing of seabed types in the Australian South East Fishery: development and application of normal incident acoustic techniques and associated ground truthing,” Marine and Freshwater Research, vol. 52, pp. 475-489, 2001.
[9] D. S. Thompson, R. K. Machiraju, M. Jiang, J. S. Nair, G. Craclun, and S. S. D. Venkata, "Physics-based feature mining for large data exploration," Computing in Science & Engineering, vol. 4, pp. 22-30, 2002.
[10] B. Buelens, R. Williams, T. Pauly, A. Sale, “Midwater acoustic modelling for multibeam sonar simulation,” 146th Meeting of the Acoustical Society of America, Austin, Texas, Nov 2003.
[11] “Inverse Problems”,
http://www.inverse-problems.com, 2004. [12] C. Konstantopoulos, L. Mittag, G. Sandri, R.
Beland, “Deconvolution of Gaussian filters and
antidiffusion,” Journal of Applied Physics, vol. 68, pp. 1415-1420, 1990.
[13] J. L. Starck, E. Pantin, F. Murtagh, “Deconvolution in astronomy: a review,” Publications of the Astronomical Society of the Pacific, vol. 114, pp. 1051-1069, 2002.
[14] M. Jiang, “Mathematical models in computer vision and image processing,” on-line book, 2001.
[15] L. Mayer, Y. Li, G. Melvin, “3D visualization for pelagic fisheries research and assessment,” ICES Journal of Marine Science, vol. 59, pp. 216-225, 2002.