Views and Constructs for Knowledge Management in India—A
Confirmatory Factor Analysis
Work in progress
Abstract
Knowledge management in the digital economy is playing a critical role in the strategic direction of any organization. Factors that determine the key characteristics of any knowledge management systems are critical for understanding the phenomena of knowledge management. For this reason that sharing and managing knowledge involves a series of activities that are related to culture, the findings in a geographic area or a certain industry may not necessarily be applicable to other areas or industries with different cultural backgrounds. This research builds on the qualitative data to develop a survey instrument to understand the views of Indian region towards the knowledge management in an Indian organization. Four major cities were selected, with 100 participants in each city to build on the findings of the qualitative study. Finding of this research shows that most of the participants views the nine constructs identify in this research are relevant to knowledge management systems in an organization.
Keywords:
Knowledge Management, KMS, Enablers, Organisational Outcome
1.
INTRODUCTION
Knowledge management (KM) plays an important role for organisations. It involves activities such as the process of creating, acquiring, sharing and managing knowledge at individual and organizational level (Alavi and Leidner, 2001). Knowledge and knowledge management are both multi-faceted concepts and activities, and strongly related to cultural background (Bock et al., 2005). In this context, Srinivas (2009) indicates that the theories of knowledge management generated—based on western cultural background—are not necessarily applicable to eastern cultures such as India. Researchers have provided definitions to better understand the concepts of knowledge and knowledge management. For example, knowledge management has been defined as the process of capturing, storing, sharing, and using knowledge (Davenport and Prusak, 1998). KM is also the systematic and explicit management of knowledge-related activities, practices, programs and policies within the enterprise (KM, 1997), or the art of creating value to organisations by leveraging intangible assets (Sveiby, 1997). Accordingly, knowledge is defined as a justified belief that increases an entity‘s capacity for effective action (Alavi and Leidner, 2001, Huber, 2001). Knowledge can be further viewed as a state of mind; an object; a process; a condition of having access to information; or a capability (Alavi and Leidner, 2001).
In this study, the nine constructs (Collaboration (C), Mutual Trust (MT), Learning (L), Leadership (LS), Incentives & Rewards (IR), Non-Centralisation (NC), and T-shaped Skills (TSS), to the dependent variable Information Communications Technologies (ICT)) of knowledge management are analysed for the four major cities (Chennai, Coimbatore, Madurai, and Vilupuram) of India to understand business views towards these constructs.
2.
LITERATURE REVIEW
about diverting or overloading employees‘ work-related attention (Constant et al., 1996). Once knowledge sharing is limited across an organisation, the likelihood increases that knowledge gaps will arise, and these gaps are likely to produce less-than-desirable work outcomes (Bock et al., 2005).
Recent studies have attempted to provide guidelines and successful experiences to reduce obstacles. For instance, there are four areas that need to be focused on when implementing knowledge management systems. These areas include (Emelo, 2009): understanding who the knowledge sources are; measuring where and how knowledge flows; getting knowledge to flow more rapidly and freely; and reinforcing knowledge with supportive relationships. Additionally, a review of the literature reveals that there are many enablers that are known to influence knowledge management practices (Gan, 2006). These enablers can be broadly classified into either a social or technical perspective. The social perspective of knowledge management enablers plays an important role and has been widely acknowledged (Smith, 2004). These enablers are further discussed below.
One of the enablers is collaboration. Collaboration is an important feature in knowledge management adoption. It is defined as the degree to which people in a group actively assist one another in their tasks (Lee and Choi, 2003). A collaborative culture in the workplace influences knowledge management as it allows for increased levels of knowledge exchange—a prerequisite for knowledge creation. This is made possible because collaborative culture eliminates common barriers to knowledge exchange by reducing fear and increasing openness in teams (Gan, 2006).
Another enabler is mutual trust. It exists in an organisation when its members believe in the integrity, character and ability of each other (Robbins et al., 2001). Trust has been an important factor in high performance teams as explained in organisational behaviour literature. The existence of mutual trust in an organisation facilitates open, substantive and influential knowledge exchange. When team relationships have a high level of mutual trust, members are more willing to engage in knowledge exchange.
A further important enabler is learning. It is defined as any relatively permanent change in behaviour that occurs as a result of experience (Robbins et al., 2001). In organisations, learning involves the dynamics and processes of collective learning that occur both naturally and in a planned manner within the organisation (Gan, 2006).
In addition to the above, leadership is often stated to be a driver for effective knowledge management in organisations (Khalifa and Liu, 2003). Leadership is defined as the ability to influence and develop individuals and teams to achieve goals that have been set by the organisation (Robbins et al., 2001). Adequate leadership can exert substantial influence on organisational members‘ knowledge creation activities. The presence of a management champion for the knowledge management initiative in order to set the overall direction for knowledge management programmes—and who can assume accountability for them—is crucial to effective knowledge management (Yu et al., 2004).
both intrinsic and extrinsic rewards have a positive influence on knowledge management performance in organisations (Yu et al., 2004).
Organisational structure plays an important role as it may either encourage or inhibit knowledge management. The structure of the organisation impacts the way in which organisations conduct their operations and, in doing so, affects how knowledge is created and shared amongst employees (Lee and Choi, 2003). One enabler to KM is the level of non-centralisation. This refers to the degree to which decision making is non-concentrated at a single point, normally at higher levels of management in the organisation (Robbins et al. 2001; Wood et al. 1998). The concept of centralisation includes only formal authority—that is, rights inherent in one‘s position. An organisation is said to be highly centralised if the top management makes the organisation‘s key decisions with little or no input from lower level employees (Robbins et al., 2001).
Another structural enabler is the level of non-formalisation. It refers to the written documentation of rules, procedures and policies to guide behaviour and decision making in organisations (Wood et al., 1998). When an organisation is highly formalised, employees would then have little discretion over what is to be done, when it is to be done and how they should do it, resulting in consistent and uniform output (Robbins et al., 2001). However, formalisation impedes knowledge management activities. This is because knowledge creation requires creativity and less emphasis on work rules, thus, the range of new ideas that emerge from a highly formalised structure is limited.
Most teams are composed of individuals who operate from a base of deeply specialised knowledge (Davvy, 2006). These individuals need mechanisms to translate across the different ‗languages‘ that exists in organisations (Ford and Staples, 2006). This brings rise to the need for employees with T-shaped skills—that is, skills that are both deep and broad (Leonard-Barton, 1995). Employees who possess T-shaped skills not only have a deep knowledge of a particular discipline (e.g. financial auditing), but also about how their discipline interacts with other disciplines (e.g. risk analysis, investment analysis and derivatives). Iansiti (1993) states that the deep knowledge in a particular discipline is aptly represented by the vertical stroke of the ‗T‘, whilst knowledge of how this discipline interacts with other disciplines is represented by the horizontal top stroke of the ‗T‘ (Iansiti, 1993).
Lastly, but not less important as an enabler, is IT infrastructure. It plays an important role in knowledge management. Technology infrastructure includes information technology and its capabilities which are considered to assist organisations to get work done, and to effectively manage knowledge that the organisation possesses (Holsapple, 2005). The information technology infrastructure within an organisation can be broadly categorised into hardware technologies and software systems. It has been found that information technology infrastructure plays a crucial role in knowledge management as it allows for easy knowledge acquisition and facilitates timely communication amongst employees. Information technology infrastructure also speeds up the pace of knowledge creation and assists in the process of building organisational memory (Okunoye and Karsten, 2002). These aspects were investigated in this study for their applicability in the Indian context.
3.
RESEARCH METHODOLOGY
were interviewed with focus given to the exploration of factors that influence KMS implementation. Hence, the unit of analysis is ‗organisation‘.
Four Indian cities were selected based on the statistics and introduction. It is understandable that each of the Indian cities has its unique economic structure, population, history and culture. They cover different economic and geographic areas of India. The four cities can then be grouped into two main categories for further analysis: metropolitan and regional cities. The metropolitan group includes Chennai and Coimbatore, and the regional group includes Madurai and Villupuram. In later sections of this study, it is found that even in the same nation, the results of data analysis can significantly vary from one group to another. Subsequent to the findings of the qualitative 1data gathered through multiple case study and model building, a survey was administered in the same Indian cities to further examine and confirm the results of the case study. The survey either adapted measures that had been validated by other researchers, or converted the definitions of constructs into a questionnaire. A five-point Likert scale was used to measure the extent that each factor influenced the respondents‘ organisations. Opinions from 400 respondents (100 in each city) in the domain of KMS implementation, with a focus on what the enablers of KMS were collected and analysed.
The nine KM constructs (Collaboration (C), Mutual Trust (MT), Learning (L), Leadership (LS), Incentives & Rewards (IR), Non-Centralisation (NC), and T-shaped Skills (TSS), to the dependent variable Information Communications Technologies (ICT) are based on a review of the literature and a multiple case study with 80 organisations in four Indian cities. These cities are located in metropolitan and regional areas with various population sizes, social structures and history.
4.
DATA ANALYSIS AND DISCUSSIONS
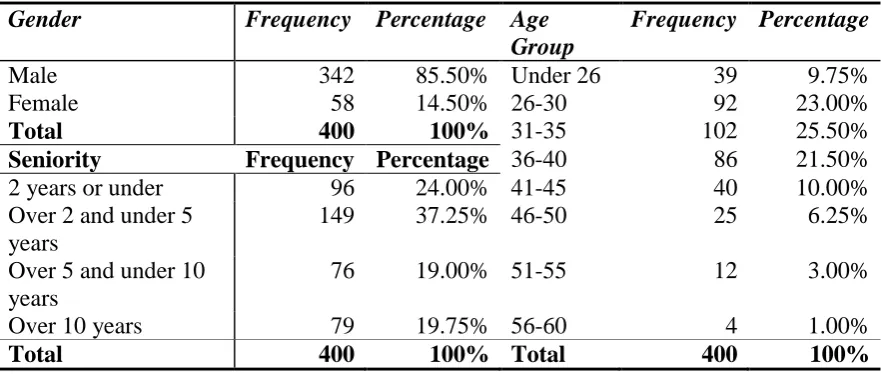
Before using the Amos to conduct the confirmatory factor analysis, data were analysed through descriptive analysis to provide the reader better understanding of the data. The results of the descriptive analysis are presented in this section. Table 1 illustrates the demographic information of the survey respondents.
Gender
Frequency Percentage Age
Group
Frequency Percentage
Male
342
85.50% Under 26
39
9.75%
Female
58
14.50% 26-30
92
23.00%
Total
400
100%
31-35
102
25.50%
Seniority
Frequency Percentage
36-40
86
21.50%
2 years or under
96
24.00% 41-45
40
10.00%
Over 2 and under 5
years
149
37.25% 46-50
25
6.25%
Over 5 and under 10
years
76
19.00% 51-55
12
3.00%
Over 10 years
79
19.75% 56-60
4
1.00%
[image:4.595.78.519.507.694.2]Total
400
100% Total
400
100%
Table 1: Frequency Distribution of Survey
Before conducting the higher level statistical analysis to understand the relationship of the independent determinants Collaboration (C), Mutual Trust (MT), Learning (L), Leadership (LS),
Incentives & Rewards (IR), Non-Centralisation (NC), and T-shaped Skills (TSS), to the dependent variable Information Communications Technologies (ICT), a reliability analysis was conducted on the instrument. The instrument value of Cronbach‘s Alpha was above .9, and according to Hair (2006), such a value for the Cronbach‘s Alpha corresponds to a very high value of reliability. A summary analysis for the composite variable is displayed in Table 2:
Variables
Cronbach'
s Alpha
Cronbach's Alpha Based
on Standardised Items
No. of
Items
Collaboration
0.939
0.943
4
Mutual Trust
0.905
0.919
4
Learning
0.957
0.960
4
Leadership
0.980
0.983
4
Incentives &
Rewards
0.972
0.973
4
Centralisation
0.963
0.963
4
Formalisation
0.975
0.976
4
T-shaped Skills
0.955
0.962
4
[image:5.595.69.528.605.770.2]IT infrastructure
0.951
0.958
4
Table 2: Reliability statistics
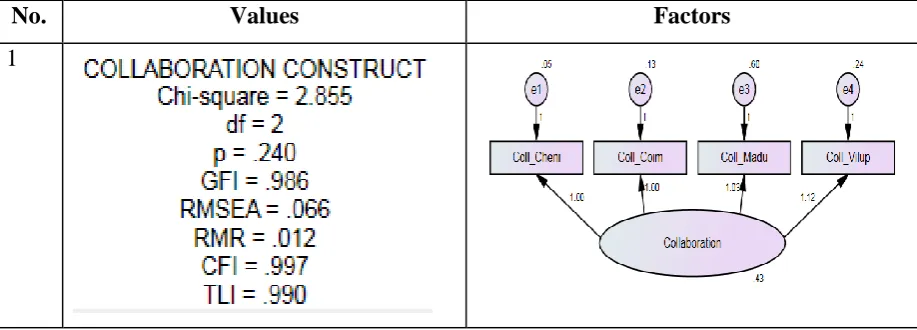
A model is considered to be a good fit if the difference between the sample variances and covariances, and the implied variances and covariances derived from the parameter estimates, is small (Holmes-Smith, 2000). The number of ‗fit‘ statistics have been used by researchers to assess how well the model fits the data (Byrne, 2001; Hair et al., 2006). The fit statistics used in this research can be summarised as follows.
Chi-square (For χ2, an acceptable level of fit is p > 0.05; a reasonable level of fit is p > 0.001) Normed Chi-square (For χ2/df, an acceptable level of fit is 1 < χ2/df < 2; a reasonable level of fit is χ2/df < 3)
Goodness-of-fit index (For GFI, and acceptable level of fit is 0.95 < GFI < 1; a reasonable fit value would be 0.90 < GFI < 0.95)
Tucker-Lewis Index (For TLI, an acceptable value is TLI > 0.95; a reasonable value of fit is 0.9 < TLI < 0.95; a lack of model parsimony would be TLI > 1)
Root-Mean-Square Error of Approximation (For RMSEA, an acceptable fit value is RMSEA < 0.05; a reasonable level of fit would be 0.05 < RMSEA < 0.08).
(Byrne, 2001; Holmes-Smith, 2000)
AMOS version 18 was used to establish the confirmatory factor analysis. Table 3 below provides the summary of factor loading their respective values of the Indies.
No.
Values
Factors
2
3
4
6
7
8
10
Table 3: Summary of confirmatory factor analysis for the enabler of knowledge management
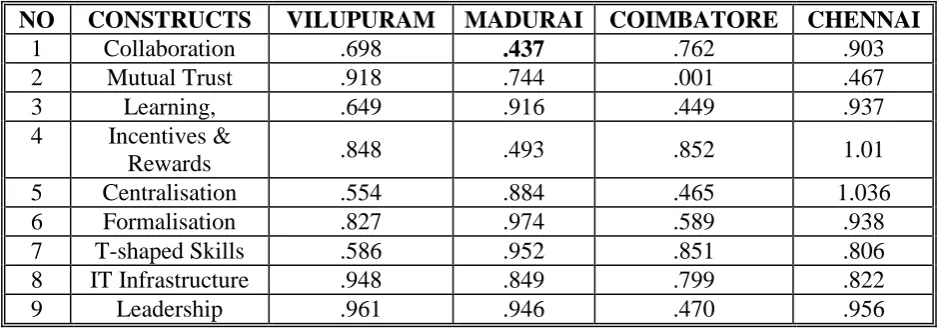
In the above table, we conducted the analysis of four Indian cities Chennai, Coimbatore, Madurai, and Vilupuram in the context of nine constructs of knowledge management Collaboration, Mutual Trust, Learning, Leadership, Incentives & Rewards, Centralisation, Formalisation, T-shaped Skills, and Information Technology Infrastructure. Confirmatory factor analysis to understand the views of participants towards nine constructs of the knowledge management in the Indian region. Results show that square multiple correlations (SMC) for all the three cities to individual constructs of knowledge management in some cases are not measuring the same constructs. For example, SMC for all three cities (Chennai, Coimbatore, and Vilupuram) for the construct Collaboration is very high (values range from 0.7 to 0.9). Whereas SMC for Madurai is only 0.4, this suggests that participants from the Madurai city see Collaboration differently as compare to other three cities. However in the case of construct ―Mutual Trust‖, two cities Chennai and Coimbatore are highly correlated. This suggests that participants in these cities see the construct ―Mutual Trust‖ quite identical. Therefore, city Coimbatore does not really uniquely contribute to the construct ―Mutual Trust‖. This outcome was also supported by the SMC values, for cities Chennai, Madurai, and Vilupuram SMC values range from 0.5 to 0.9 and for city Coimbatore the value of SMC is less than 0.01.
NO
CONSTRUCTS
VILUPURAM
MADURAI COIMBATORE
CHENNAI
1
Collaboration
.698
.437
.762
.903
2
Mutual Trust
.918
.744
.001
.467
3
Learning,
.649
.916
.449
.937
4
Incentives &
Rewards
.848
.493
.852
1.01
5
Centralisation
.554
.884
.465
1.036
6
Formalisation
.827
.974
.589
.938
7
T-shaped Skills
.586
.952
.851
.806
8
IT Infrastructure
.948
.849
.799
.822
9
Leadership
.961
.946
.470
.956
Table 4: Summary of square multiple correlations for the nine constructs
[image:8.595.65.540.467.631.2]From the above confirmatory factor analysis, it can be concluded that Vilupuram city views all the nine constructs as strong measures of knowledge management. Madurai city participants view constructs Collaborations, and Incentive & Rewards are not strong representative of knowledge management. Coimbatore city participants considered constructs such as Mutual Trust, Learning, Leadership and Centralization do not provide strong measure of the respective constructs. Chennai city participants, view Mutual Trust construct are not strong representation. Therefore, Coimbatore participants have quite different views about the constructs of knowledge management as compare to their counter parts in Vilupuram, Madurai, and Chennai. However, the reason behind this difference was not in the scope of the research.
5.
CONCLUSIONS
For most of the nine constructs for the knowledge management in the three Indian cities represent good measurements for the constructs. The implications of such a finding would be that all the three cities view nine knowledge management constructs similarly. Future research can concentrate on finding out the reasons behind this and to be able to explain why there were a few differences exist as mentioned above. The limitation, to the researchers‘ best knowledge, this study is the first study of this nature and needs further investigation before generalization of the finding of the study.
References
ALAVI, M. & LEIDNER, D. E. (2001) Review: knowledge management and knowledge
management systems: conceptual foundations and research issues. MIS Quarterly, 25, 107-136. BOCK, G.-W., ZMUD, R. W. & KIM, Y.-G. (2005) Behavioral intention formation in knowledge
sharing: Examining the roles of extrinsic motivators, social-psychological forces, and organisational climate. MIS Quarterly, 29, 87-111.
CONSTANT, D., KIESIER, S. & SPROULL, L. (1996) The kindness of strangers. Organization Science, 7, 119-135.
DAVENPORT, T. H. & PRUSAK, L. (1998) Working knowledge, Boston, Harvard Business School Press.
DAVVY, C. (2006) Recipients: the key to information transfer. Knowledge Management Research and Practice, 4, 17-25.
EMELO, R. (2009) The future of knowledge management. Chief Learning Officer.
FORD, D. & STAPLES, D. (2006) Perceived value of knowledge: the potential informer's perception. Knowledge Management Research and Practice, 4, 3-16.
GAN, G. G. G. (2006) Knowledge management practices in multimedia super corridor status companies in Malaysia. Business Faculty. University of Southern Queensland.
HOLMES-SMITH, P. (2009) Structural Equation Modeling From the Fundamentas to Advanced Topics: ACSPRI Course Notes. Victoria, Australia, Scsool Research, Evaluation and Measurement Services.
HOLSAPPLE, C. (2005) The inseparability of modern knowledge management and computer-based technology. Journal of Knowledge Management, 9, 45-52.
HUBER, G. P. (2001) Transfer of knowledge in knowledge management systems: unexplored issues and suggested studies. European Journal of Information Systems, 10, 72-79.
IANSITI, M. (1993) Real-world R&D: jumping the product generation gap. Harvard Business Review, 138-147.
KHALIFA, M. & LIU, V. (2003) Determinants of sccessful knowledge management programs. Electronic Journal of Knowledge Management, 1, 103-112.
LEE, H. & CHOI, B. (2003) Knowledge management enablers, processes and organisational knowledge: an integrative view and empirical investigation. Journal of Management Information Systems, 20, 179-228.
LEONARD-BARTON, D. (1995) Wellsprings of Knowledge: Building and Sustaining the Sources of Innovation, Boston, Harvard Business School Press.
OKUNOYE, A. & KARSTEN, H. (2002) ITI as a Enabler of Knowledge Management: Empirical Perspective from Research Organisations in sub-Saharan Africa. 35th Hawaii International
Conference on System Sciences. Hawaii, USA.
ROBBINS, S., MILLET, B. & CACIOPPE, R. (2001) Organisational behaviour: leading and managing in Australia and New Zealand, Malaysia, Prentice Hall.
SMITH, P. (2004) Knowledge management: people are important. Journal of Knowledge Management Practice.
SRINIVAS, N. (2009) Mimicry and revival: the transfer and transformation of management
knowledge to India 1959–1990. International Studies of Management and Organisation, 38, 38-57. SVEIBY, K. (1997) The new organisational wealth: managing and measuring knowledge-based
assets, San Francisco, Berret-Koehler Publishers.
WOOD, J., WALLACE, J., ZEFFANE, R., SCHERMERHORN, J., HUNT, J. & OSBORN, R. (1998) Organisational Behaviour: An Asia-Pacfic Perspective, Australia, John Wiley. YU, S.-H., KIM, Y.-G. & KIM, M.-Y. (2004) Linking Organisational Knowledge Management
Drivers to Knowledge Management Performance: An exploratory study. 37th Hawaii International Conference on System Sciences. Hawaii, USA.