R E S E A R C H A R T I C L E
Open Access
A dynamic model and some strategies
on how to prevent and control hepatitis c
in mainland China
Wanru Jia
1†, Jie Weng
2, Cong Fang
3and Yong Li
1,4*†Abstract
Background: Hepatitis C virus (HCV) is a leading cause of chronic liver disease. As yet there is no approved vaccine protects against contracting hepatitis C. HCV seriously affects many people’s health in the world.
Methods: In this article, an epidemiological model is proposed and discussed to understand the transmission and prevalence of hepatitis C in mainland China. This research concentrates on hepatitis C data from Chinese Center for Disease Control and Prevention (China’s CDC). The optimal parameters of the model are obtained by calculating the minimum chi-square value. Sensitivity analyses of the basic reproduction number and the endemic equilibrium are conducted to evaluate the effectiveness of control measures.
Results: Vertical infection is not the most important factor that causes hepatitis C epidemic, but contact transmission is. The proportion of acute patients who are transformed into chronic patients is about 82.62%. The possibility of the hospitalized patients who are restored to health is about 76.24%. There are about 92.32% of acute infected are not treated. The reproduction number of hepatitis C in mainland China is estimated as approximately 1.6592.
Conclusion: We find that small changes of transmission infection rate of acutely infected population, transmission infection rate of exposed population, transition rate for the acutely infected, and rate of progression to acute stage from the exposed can achieve the purpose of controlling HCV through sensitivity analysis. Finally, based on the results of sensitivity analysis, we find out several preventions and control strategies to control the Hepatitis C.
Keywords: Hepatitis C, Basic reproduction number, Parameter estimation, Sensitivity analysis, Preventions and control strategies
Background
Hepatitis C virus(HCV) seriously affects lots of people’s health in the world. Recently (18 July, 2018), the World Health Organization (WHO) estimates that approxi-mately 71 million people have chronic hepatitis C virus (HCV) infection worldwide and approximately 399,000 people die each year after HCV diagnosis, mostly from cirrhosis and hepatocellular carcinoma (HCC) [1]. An estimated 3.5 million people in the United States (US) has chronic hepatitis C [2]. In 2016, there are 18,153 hepatitis
*Correspondence:[email protected]
†Wanru Jia and Yong Li contributed equally to this work.
1School of Information and Mathematics, Yangtze University, Jingzhou 434023, China, Nanhuan Road, 434023 Jingzhou, China
4Institute of Applied Mathematics, Yangtze University, Nanhuan Road, 434023 Jingzhou, China
Full list of author information is available at the end of the article
C-related deaths in the US which is lower than from 2012 to 2015 (18,650 to 19,629) [3]. In the European region, approximately 14 million people are chronically infected with HCV, representing about 20% of the global burden of disease due to HCV infection [4]. The areas where have the highest reported prevalence rates locate in Africa and Asia, and China in the Asia whose citizens account for about one fifth of the world’s populace, has a reported seroprevalence about 3% [5–7].
HCV was discovered in 1989 by Choo et al. [8,9], it is a small, enveloped, single-stranded ribonucleic acid (RNA) virus, which be part of the Flaviviridae family. Hepatitis C is an infectious disease caused by HCV which basically affect the liver. The spread ways of the virus are blood transmission, sexual transmission and mother-to-child transmission, but the leading way is blood transmission,
such as sharing injection equipment, inputing the con-taminated blood or blood products, tattooing [10]. As yet there is no approved vaccine to protect against contract-ing hepatitis C. The focus of prevention efforts should be safe blood supply in the developing world, safe injec-tion practices in health care and other settings, and less amount of people who inject drugs [11]. In those per-sons who do develop symptoms, the mean time period from exposure to symptom onset is 3–12 weeks (range: 2–24 weeks) [12,13]. HCV infection has both acute and chronic forms, the incubation for chronic HCV can be between 14 to 180 days [12]. Acute hepatitis C infection is hard to diagnose, because 70% to 80% of the patients are symptomless [13,14]. Most of them are unconscious of their exposure to HCV, and fail to get diagnosed in time until the occurring of the secondary symptoms to the liver. Some studies show, however, the acute infection phase is very impressionable to treatment, so it is an unique occa-sion to prevent the evolution of chronic infection [15]. Chronic hepatitis C can bring about cirrhosis and HCC. The average rate of progression of the disease is extremely slow. Using data collected in Japan, investigators estimate that, following acute infection, chronic hepatitis could be ensured 13.7±10.9 years later, chronic active hepatitis could be ensured 18.4±11.2 years later, cirrhosis of the liver could be ensured 20.6±10.1 years later, and hepato-cellular carcinoma could be ensured in 28.3±11.5 years [16,17].
Some mathematical models were used to analyze the spread of hepatitis C disease and come up with some effective strategies. Martcheva M and Castillo-Chavez C [10] considered an epidemiological model with a chronic infectious phase and variable population size, and the analysis consequences revealed that treatment strategies directed forward speeding up the transition from acute to chronic stage in effect conduce to the eradication of the diseases. This model was extended by Das P et al. [15] who incorporate the immune class and was also extended by Yuan J [18] who consider the latent period. Imran M [19] formulated epidemic models of hepatitis C considering an isolation class and analyzed the effects of the isolation class on the transmission dynamics of the disease. Mathematical modeling of hepatitis C treat-ment for injecting drug users (IDUs) were studied in [20–
22] where the treated individuals are supposed not to infect the susceptible individuals. Lately, there are some researches [23,24] about hepatitis C epidemic cases which suggest some measures to control hepatitis C infection continental China. But these models did not consider the vertical infection. It is not effortless to diagnosis due to the shortage of the residents’ consciousness and the characteristics of the patients with hepatitis C, so it is probable that patients will transmit HCV to their children.
The aim of this work is to use mathematical modelling to investigate the influences of hepatitis C, then probe and draw some conclusions about effective policy. The orga-nization of this paper is as follows. In the next section, an epidemic model for hepatitis C is proposed to prevent and control the infectious disease. Then we acquire its optimal parameter values by Matlab tool fmincon and compare the reported data and simulative results. Sensitivity anal-yses of the basic reproduction number and the endemic equilibrium are performed in “Results” section. After that, discussion on the model parameters and the main factors affecting the spread of hepatitis C in “Discussion” section, and we end this article with how to control the hepatitis C in “Conclusions” section.
Methods Data
We have found clinical cases of hepatitis C in China every month from 2011 to 2016 from the China Center for Disease Control and Prevention (China’s CDC), which is a public welfare institution organized by the Chinese government to implement state-level disease prevention and control and public health technology management and services. China’s CDC conducts monthly statistics on patients infected with hepatitis C virus in mainland China (i.e., except Hong Kong, Macao and Taiwan) [25] including gender, occupation, date of birth, address, date of onset, date of diagnosis, especially the classification of the disease, which is marked as a clinically diagnosed case. In general, it is unreasonable to determine HCV infec-tions just by relying on HCV antibody positive which just means you were infected before. To determine whether infected with HCV, HCV-RNA test needs to be done. Once the HCV-RNA test results indicate that the outpa-tient is infected with the hepatitis C virus, he or she will need hospitalization. In the case of ignoring the patient’s home treatment, we believe that the data provided by the China’s CDC is the number of hospitalizations.
By producing re-sampling a larger artificial data set, which is generated based on the existing limited reported monthly data, using the linspace function from Matlab (the Mathworks, Inc.), we interpolate the 12-month data and turn into 365-day data. In order to keep the total number of data, the interpolation formula of each year as following:
ˆ D2(tj)=
D2(tj) 12
i=1
D1(si)
365
j=1D2(tj)
,j=1, 2,· · ·, 365,
where,D1(si),i=1, 2· · ·, 12, denote the 12-month actual
data, D2(tj),j = 1, 2· · ·, 365, denote the 365-day data
the 365-day data after the zoom. With the aid of linear interpolation, we will obtain more useful data, and the fit results will be better. We still give a comparison chart for each month’s case data and simulative data.
Model formulation
In order to study the epidemic of hepatitis C in China, we consider the hepatitis C model is homogeneous mixing-an individual has an equal chance of contacting any individ-ual among the population, by ignoring the impacts of the space structure and seasonal changes to simulate the data year after year, and we assume that natural birth rate is equal to natural mortality.
The mathematical model for hepatitis C to understand the transmission dynamics and prevalence consists of a system of ordinary differential equations, where pop-ulation is divided into six subgroups: susceptible S(t), exposedE(t)(defined as not infected but infectious), acute infectionIa(t), chronic infection Ic(t), treated T(t) and
recovered R(t) individuals. The total population size is denoted byN(t)=S(t)+E(t)+Ia(t)+Ic(t)+T(t)+R(t).
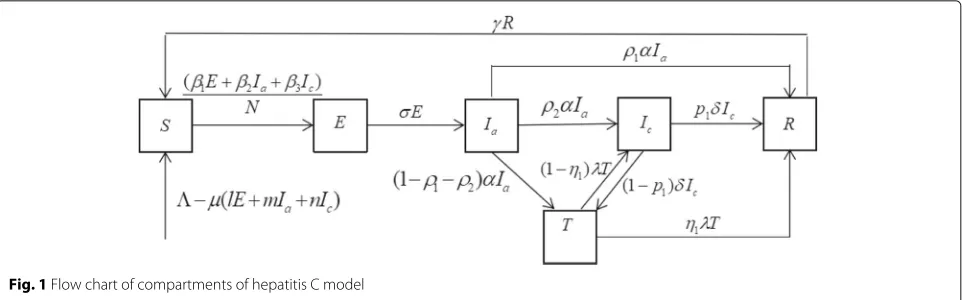
New susceptible individuals enter into theS compart-ment with a recruitcompart-ment rate. Letμbe the natural birth and death rate of the population. By the influence of their parents, generations of the individuals in theE(t), Ia(t), Ic(t)may be infected with HCV at rate ofl,m,n, respec-tively. This is what is called vertical infection. Susceptible individuals are infected by contacting with patients in theE(t), Ia(t), Ic(t)compartments at rates ofβ1,β2, β3, respectively. Once infected, the individuals move into the exposed compartment (E) and then progress to the acute stage at a rate ofσ. In the acute stage, the individuals may die at rate ofd1. Letαbe the transition rate for the acutely infected individuals. In the conversion of acute infection, the individuals will restore health relying on their own immune system with the ratioρ1, progress to the chronic stage with the ratio ρ2, go to the hospital for treatment with the ratio 1−ρ1−ρ2. At the same, the individuals may die at rate of d2 in the chronic stage. Letδ be the transition rate for the chronically infected individuals. In the conversion of chronic infection, the individuals will restore health relying on their own immune system with the ratiop1, go to the hospital for treatment with the ratio 1−p1. Individuals in the treated compartment (T) who have the transition rate ofλ, succeed in clearing HCV and move to the recovered compartment (R) with the ratio η1, while the others fail and move back to the chronic stage with the ratio 1−η1. Individuals in theR compart-ment lose their immunity and eventually return to the susceptible compartment (S) at rate ofγ. The schematic flow diagram illustrating the transmission dynamics of the HCV infection with treatment are illustrated in Fig. 1. And the biological meanings and acceptable ranges of all parameters are listed in Table1.
The model is represented by the following system of ordinary differential equations:
⎧ ⎪ ⎪ ⎪ ⎪ ⎪ ⎪ ⎪ ⎪ ⎨ ⎪ ⎪ ⎪ ⎪ ⎪ ⎪ ⎪ ⎪ ⎩
dS
dt=−μlE−μmIa−μnIc−(β1
E+β2Ia+β3Ic)S
N +γR−μS, dE
dt=(β1
E+β2Ia+β3Ic)S
N −σE−μE+μlE+μmIa+μnIc, dIa
dt =σE−αIa−μIa−d1Ia, dIc
dt =ρ2αIa−δIc+(1−η1) λT−μIc−d2Ic, dT
dt =(1−ρ1−ρ2) αIa+(1−p1) δIc−λT−μT, dR
dt =p1δIc+ρ1αIa+η1λT−γR−μR.
(1)
The biologically feasible region= {(S,E,Ia,Ic,T,R)∈
R6
+:S+E+Ia+Ic+T+R< μ}is a positively invariant set of system (1).
The basic reproduction number (R0) represents the number of infected during the initial patient’s infectious (not sick) period. What this threshold will do determine whether a disease will die out (if R0 < 1) or become epidemic (ifR0 > 1). For models with complex dynam-ics,R0 < 1 is not the only condition to guarantee that the disease is extinct, but the smaller the better. Follow-ing Van den Driessche P and Watmough J [26], the basic reproduction number for the model (1) is given by the formula:
R0=(β1+μl)σ+1μ+(β2+μm)(σ+μ)(ασ+μ+d1)+(β3+μn)A
=R01+R02+R03+R04+R05+R06,
where,R01 = σβ+1μ,R02 = (σ+μ)(αβ2σ+μ+d1),R03 = β3A, R04 = σμ+lμ,R05 = (σ+μ)(αμm+σμ+d1), R06 = μnA, A =
ασ[ρ2(λ+μ)+λ(1−η1)(1−ρ1−ρ2)]
(σ+μ)(α+μ+d1)[(δ+μ+d2)(λ+μ)−δλ(1−p1)(1−η1)].
R01,R02andR03represent the average numbers of the infected individuals by a single exposed, acute infection or chronic infection individual in a fully susceptible popula-tion, respectively.R04,R05andR06represent the average numbers of the infected infants by the exposed, acute infection or chronic infection parents, respectively. They represent the contributions of the 6 HCV transmission ways to the the basic reproduction numberR0.
Parameter estimation
Fig. 1Flow chart of compartments of hepatitis C model
the population as the sampled population, and denote as ˜
N = 1.08×10⁹. So we estimate the standard rateβˆi = ˜
βiN˜ ∈[ 0.0225, 0.0323] ,i=1, 2, 3. The values ofβ1,β2and β3in model (1) are chosen randomly in this interval.
[image:4.595.58.539.87.237.2]Then, we have to estimate the other 15 parameters and 6 initial values every year through calculating the minimum sum of chi-square [28,29]
Table 1Model parameters and their interpretations
Parameter Description
μ Natural birth or death rate
in(102, 106) Recruitment rate
lin (0, 0.1) Transmission rate of the exposed generation
min (0, 0.1) Transmission rate of the acute infection generation
nin (0, 0.1) Transmission rate of chronic infection generation
β1in (0, 0.1) Transmission infection rate of exposed population
β2in (0, 0.1) Transmission infection rate of acutely infected population
β3in (0, 0.1) Transmission infection rate of chronically infected population
γin (0, 1/30) Remove rate from recovered to susceptible
σin (0, 0.05) Rate of progression to acute stage from the exposed
αin (0, 0.5) Transition rate for the acutely infected
d1in (0, 0.01) The mortality of acutely infected population
d2in (0, 0.01) The mortality of chronically infected population
ρ1in (0, 0.1) The proportion of natural recovered from acutely infected population
ρ2in (0.5, 1) The proportion of chronic infection from acutely infected population
δin (0, 0.1) Transition rate for the chronically infected
η1in (0, 1) The proportion of recovered from treated population
λin (0, 1) Transition rate for the treated
p1in (0, 1) The proportion of natural recovered from chronically infected population
R0 The number of infected during the initial patient’s infectious (not sick) period
J(θ)= 72
i=1
(T(ti)− ˆT(ti)) 2
ˆ T(ti)
with the MATLAB (the Mathworks, Inc.) tool fmincon that is a part of optimization toolbox. Where,T(ti),i =
1, 2,· · ·, 72 show the true value each month, Tˆ(ti),i =
1, 2,· · ·, 72 show the estimated value each month. Fcon function is a Matlab function for solving the min-imum value of constrained nonlinear multivariate func-tion. Fmincon implements four different algorithms: inte-rior point, sequence quadratic program (SQP), active set, and trust region reflective. In this paper, we choose the SQP algorithm to solve the optimal solution of model (1). MATLAB SQP method is divided into three steps: firstly, update the Lagrangian Hessian matrix, then solve the quadratic programming problem, and finally calculate the one-dimensional search and objective function.
According to the epidemiological characteristics of hep-atitis C and the biological significance of the parameters, we set the lower and upper boundaries of each parameter, as shown in Table1. Although the outbreak of hepatitis C is not seasonal, it still has a certain periodicity. Our model does not have a periodic solution, so we can only simu-late the annual parameter values separately. The simusimu-lated annual parameter values are shown in Table 2. Taking year as the research unit, the parameters of the model (1) vary from year to year because of the annually differ-ent natural conditions and environmdiffer-ental factors, but the same parameters are not significantly different in different years.
[image:4.595.58.293.384.735.2]Table 2Annual simulation values of the parameters between 2011 and 2016 andR0
parameter 2011 2012 2013 2014 2015 2016 Source
8.15×10² 1.58×10⁴ 100 113 2.05×10⁴ 7.03×10³ Estimation
l 1×10⁻¹⁰ 4.41×10⁻⁵ 1×10⁻¹⁰ 0.1 0.1 0.1 Estimation
m 1×10⁻¹⁰ 1.03×10⁻³ 1×10⁻¹⁰ 0.1 1.06×10⁻³ 0.1 Estimation
n 4.89×10⁻⁶ 2.78×10⁻⁵ 1×10⁻¹⁰ 0.1 9.46×10⁻² 0.1 Estimation
β1 2.23×10⁻² 2.24×10⁻² 2.23×10⁻² 2.23×10⁻² 2.23×10⁻² 2.23×10⁻² [24]
β2 2.46×10⁻² 3.10×10⁻² 2.46×10⁻² 2.46×10⁻² 2.46×10⁻² 2.46×10⁻² [24]
β3 2.20×10⁻² 2.34×10⁻² 2.20×10⁻² 2.20×10⁻² 2.20×10⁻² 2.20×10⁻² [24]
γ 8.45×10⁻⁴ 1.01×10⁻³ 10−6 8.90×10⁻⁴ 3.81×10⁻⁵ 2.11×10⁻³ Estimation
σ 2.88×10⁻² 5.00×10⁻² 3.63×10⁻² 3.03×10⁻² 3.33×10⁻² 2.72×10⁻² Estimation
α 1.85×10⁻² 5.30×10⁻² 2.20×10⁻² 1.40×10⁻² 1.45×10⁻² 1.62×10⁻² Estimation
d1 10−2 5.08×10⁻³ 10−2 10−2 9.89×10⁻³ 10−2 Estimation
d2 10−2 9.53×10⁻³ 10−2 10−6 10−2 2.50×10⁻³ Estimation
ρ1 0.1 8.20×10⁻² 0.1 0.1 0.1 0.1 Estimation
ρ2 0.82 0.80 0.84 0.83 0.80 0.87 Estimation
δ 0.1 8.30×10⁻² 0.1 9.46×10⁻² 0.1 0.1 Estimation
η1 0.46 0.34 0.90 0.95 0.97 0.96 Estimation
λ 0.99 0.94 0.96 0.96 0.91 0.92 Estimation
p1 0.93 0.82 0.94 0.91 0.90 0.93 Estimation
R0 1.75 1.21 1.50 1.87 1.77 1.86 Calculated
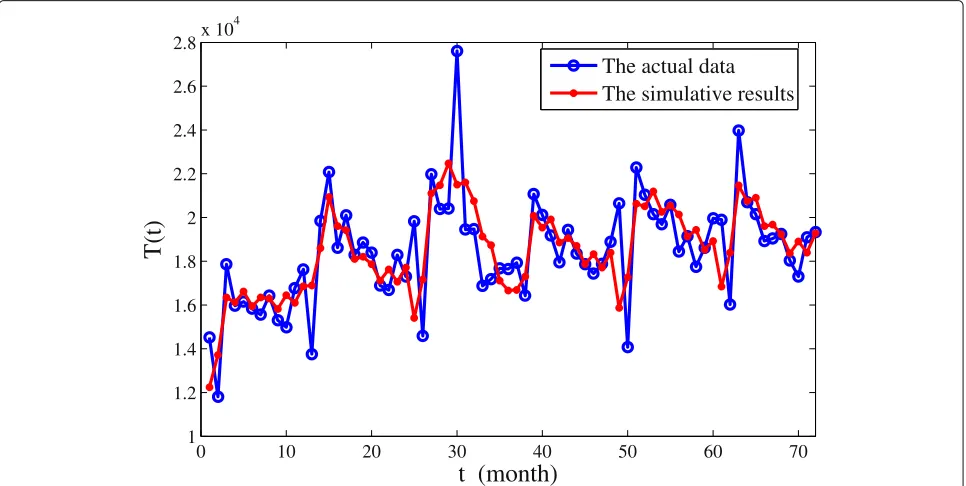
from 2011 to 2016 except one point which represent the number of treated patients in June 2013. So we guess the abnormality of this data could be related to the emergence of new avian influenza H7N9 [30] and the 7.8-magnitude earthquake in Ya’an, Sichuan province [31] in China in
April of that year. Our model is based on the ideal state, without considering the impact of unexpected events, so the model is not able to capture that outbreak.
We found the optimal parameter values and the initial values of the model in 2011 after continuous debugging,
0 10 20 30 40 50 60 70
1 1.2 1.4 1.6 1.8 2 2.2 2.4 2.6 2.8x 10
4
t (month)
T(t)
The actual data
The simulative results
[image:5.595.58.541.470.713.2]then, using the optimal parameter values of the model in 2011 as the starting value, we have found the optimal parameter values of each subsequent year through contin-uous simulation. Where, the optimal values of parameters are listed in Table2, and the each initial condition from 2011 to 2016 is fixed as (4.23×10⁷, 3.81×10⁵, 102, 7.46× 10⁴, 4.69×10², 4.08×10⁷),(3.66×10⁷, 8.54×10⁴, 1.16× 10², 3.08×10⁴, 4.36×10², 1.10×10⁷),(9.01×10⁷, 4.18× 10⁵, 1.18 × 10², 105, 6.53 × 10², 4.80 × 10⁷),(7.07 × 10⁷, 4.64×10⁵, 6.51×10⁴, 6.12×10⁴, 5.77×10², 8.98× 10⁷),(5.36×10⁷, 3.48×10⁵, 9.10×10⁴, 6.17×10⁴, 6.98× 10², 4.52 × 10⁷),(2.66 × 10⁷, 9.71 × 10⁵, 102, 8.81 × 10⁴, 6.46×10², 5.83× 10⁷). Here, we also calculate the basic reproduction number each year. The average value of the 6 basic reproduction numbers is estimated as approximately 1.6592. Using the optimal parameters of 2015, one also calculatesR01 = 0.6701,R02 = 1.0050, R03=0.0958,R04=1.0992×10⁻⁴,R05=1.5888×10⁻⁶, R06=1.5094×10⁻⁵. Hence, vertical infection is not the main factor that cause hepatitis C epidemic, but trans-mission of HCV from exposed and infection to others is the most important factor. We will discuss this argument again in next sections. However, because of China’s big population base, vertical infection is still worthy of our attention.
Results
Sensitivity analysis ofR0
In this section we performed a sensitivity analysis of the basic reproduction number to determine several param-eters that have the most influential paramparam-eters on the prevalence and transmission of hepatitis C. Sensitivity analysis is a useful tool to identify how closely input parameters are related to predictor parameters and it helps to determine level of change necessary for an input parameter to find the desire value of a predictor parameter [32,33]. If a small change in a parameter can cause a large change in the number of the basic reproduction number, then this parameter is called a sensitivity factor, otherwise called an insensitive factor.
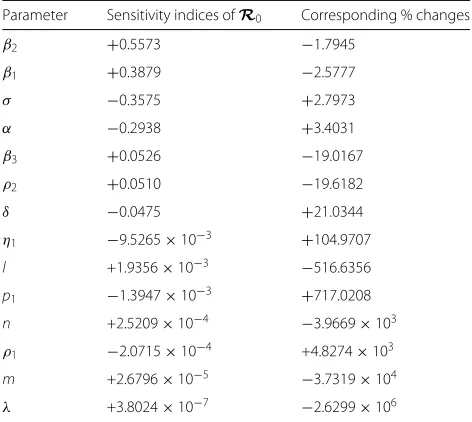
In this section, following Samsuzzoha M’s [32] method, we used the 2015 simulated parameter values to perform a sensitivity analysis of the basic reproduction number, thus we can put some effective control strategies of HCV. The sensitivity indices of each parameter to the basic reproduction numberR0are shown in Table3.
[image:6.595.303.539.109.320.2]We can observe thatβ2,β1,β3, ρ2,l,n, m,λ, (σ, α,δ, η1, p1, ρ1) have positive (negative) impacts on R0. The sensitivity indices and corresponding % value needed to affect a 1% decrease inR0are shown in Table3(e.g., in order to decrease the value ofR0by 1% it is necessary to decrease the value ofβ2by 1.7945% or increase the value ofσ by 2.7973%.) The greater absolute value of the sen-sitivity index, the more sensitive the parameter is toR0.
Table 3Sensitivity indices ofR0, the corresponding % changes needed to affect a 1% decrease/increase in the value ofR0
Parameter Sensitivity indices ofR0 Corresponding % changes
β2 +0.5573 −1.7945
β1 +0.3879 −2.5777
σ −0.3575 +2.7973
α −0.2938 +3.4031
β3 +0.0526 −19.0167
ρ2 +0.0510 −19.6182
δ −0.0475 +21.0344
η1 −9.5265×10⁻³ +104.9707
l +1.9356×10⁻³ −516.6356
p1 −1.3947×10⁻³ +717.0208
n +2.5209×10⁻⁴ −3.9669×10³
ρ1 −2.0715×10⁻⁴ +4.8274×10³
m +2.6796×10⁻⁵ −3.7319×10⁴
λ +3.8024×10⁻⁷ −2.6299×10⁶
Therefore, the most sensitive parameter forR0isβ2 fol-lowed by β1,σ, α,β3,ρ2,δ, η1, l,p1, n, ρ1, m,λ. From Table3, we can see that parametersl,m,ncan be negli-gible on the influence of the basic reproduction number (R0) compared with the most sensitive parametersβ2,β1, σ,α. Hence, vertical infection is not the main factor that cause hepatitis C epidemic in China. In the “Conclusions” section, we will put forward some specific human inter-vention measures according to the results.
Sensitivity analysis of the endemic equilibrium
Table 4Sensitivity indices of the endemic equilibrium
parameter S∗ E∗ I∗a I∗c T∗ R∗
l +1.20×10⁻⁴ −7.96×10⁻⁵ −7.96×10⁻⁵ −8.15×10⁻⁵ −4.07×10⁻⁴ −1.33×10⁻⁴
m +1.74×10⁻⁶ −1.15×10⁻⁶ −1.15×10⁻⁶ −1.18×10⁻⁶ −5.89×10⁻⁶ −1.92×10⁻⁶
n +1.65×10⁻⁵ −1.09×10⁻⁵ −1.09×10⁻⁵ −1.12×10⁻⁵ −5.59×10⁻⁵ −1.82×10⁻⁵
β1 +0.4145 −0.2740 −0.2740 −0.2806 −1.4024 −0.4573
β2 +0.6216 −0.4109 −0.4109 −0.4209 −2.1034 −0.6859
β3 +0.0592 −0.0392 −0.0392 −0.0401 −0.2004 −0.0654
σ −0.4131 +1.2710 +0.2710 +0.2776 +1.3872 +0.4524
α −0.9452 +0.2684 +0.8617 −0.1417 −0.7081 −0.2309
ρ1 +0.0737 −0.0049 −0.0049 +0.0020 +1.1541 +0.0753
ρ2 −0.4462 −0.0035 −0.0035 −0.9918 +0.9775 −0.5742
δ −0.1720 +0.0436 +0.0436 +0.9510 −0.1872 −0.0609
η1 +0.0838 +6.51×10⁻⁴ +6.51×10⁻⁴ +0.1863 +0.8164 +0.1078
λ +3.86×10⁻⁷ −3.77×10⁻⁶ −3.77×10⁻⁶ −4.10×10⁻⁶ +0.9999 −1.30×10⁻⁵
p1 −0.6518 +0.0453 +0.0453 +0.0464 +0.2317 −0.6588
analysis, we can see that the sensitivity of the four param-etersβ1,β2,α,σare at the top of the sensitivity indices of the endemic equilibrium, especially forIa∗, and the sensi-tivity ofρ2,δ,β2,β1,σ are at the top ofI∗c. So if we want
to reduce the number of cases, we can propose specific preventive control measures from these parameters in the “Conclusions” section.
Discussion
From Table2, according to discuss the arithmetic means of parameters of our model, we have some conclusions
as follows: ¯l = 5.00% (e.g.,¯l = 16 2016
i=2011li, the method of calculating the average value of other parameters is the same.),m¯ = 3.37%, n¯ = 4.91%, these suggest that the probabilities of exposed, the acute and the chronic patients spread virus to their kids on hepatitis C are about 5.00%, 3.37% and 4.91%, respectively.ρ¯1=9.70%, it shows that the proportion of patients who recover naturally in all acute patients is about 9.70%.ρ¯2 = 82.62%, it shows that the proportion of acute patients who turned into chronic patients is about 82.62%. From Chen SL [13], approxi-mately 75%−85% of infected patients do not clear the virus in 6 months, and become chronic hepatitis patients. 1− ¯ρ1− ¯ρ2 = 7.68%, it indicates that the proportion of acute patients who are treated in hospital is about 7.68%. This result is similar to that of Cox AL’s [34], he denotes that 95% of infected are not treated.η¯1 =76.24%, it sug-gests that the proportion of the resident patients who can recover is about 76.24%. From Seeff LB [35], about 80% of HCV-infected individuals seem to be no progression to end-stage liver disease, but 20% who get histologic fibro-sis and cirrhofibro-sis will develop into serious end-stage liver disease. And in our paper, 1− ¯η1 = 23.76%, it suggests
that the proportion of the resident patients who failed to recover is about 23.76%, while we don’t consider that chronic patients develop histologic fibrosis and cirrhosis, which will be our follow-up work. 1/γ¯ ≈ 1226.03 days, i.e., 3.36 years, it suggests that the average time that the antibody disappear is about 3.36 years. 1/σ¯ ≈29.12 days, it shows that the average incubation time is about 29.12 days. 1/δ¯ ≈ 10.39 days, it shows that the average period of chronic patients deciding whether to be treated or not is about 10.39 days. Then, these conclusions have been conformed to the actual situation [1,25].
According to the values of the parameters and sensi-tivity analysis of the basic reproduction number and the endemic equilibrium, we can find that vertical infection is not the primary cause of hepatitis C epidemic in China, the reasons are as follows:
(1)R¯04 =6.07×10⁻⁵,R¯05 =4.9×10⁻⁵,R¯06 =8.85× 10⁻⁶, these represent the average contribution from the generation of the exposed, the acute and the chronic to the basic reproduction number (R0), respectively. We can observe that vertical infection has little influence on the spread of hepatitis C.
(2)From the result of the sensitivity analysis of R0, we can find that parametersl,m,nhave negligible influ-ence on the spread of hepatitis C, compared to the most sensitive parametersβ2,β1,σ,α(see Table3for details).
(3)From the sensitivity analysis of the endemic equilib-rium, we can see that parametersl,m,nare not sensitive to it. So reducing the transmission rate of vertical infec-tion has no influence on controlling the scale of patients with HCV (see Table4for details).
Therefore, it is reasonable to ignore vertical infection in the existing hepatitis C dynamics models [10,15,18–
blood, using public syringe, sexual behavior and so on) is the main factor for the epidemic of the hepatitis C in China, the reasons are as follows:
(1)R¯01 = 0.6759, R¯02 = 0.8529, R¯03 = 0.1303 rep-resent the average contribution of the exposed infection, the acute infection and the chronic infection to the basic reproduction number (R0), respectively. We can find that contact transmission has great effect on the spread of hepatitis C.
(2)From the result of the sensitivity analysis ofR0, we can find that the sensitive indexes of the parametersβ1 (the second), β2 (the first), β3 (the fifth) are extremely large (see Table3for details).
(3)From the result of the sensitivity analysis of the endemic equilibrium, we can see that the parametersβ1, β2,β3are sensitive to it. So reducing the transmission rate β1,β2,β3can effectively control the scale of patients with hepatitis C (see Table4for details).
In addition, the exposed and the acute infection tend to be asymptomatic, so the susceptible have more chance to contact them. Therefore, contact transmission is the main reason for the epidemic of hepatitis C in China.
Conclusions
In this paper, we constructed anSEIaIcTRdynamic model
for hepatitis C transmission based on the reported data from China’s CDC to search the most influential parame-ters. From the last line in Table2, the basic reproductive number R0 in each year is larger than 1. Thus, we con-clude that HCV will persist in China under the current conditions. As a matter of fact, there is no effective vaccine for HCV, but if we can provide some preventive measures to control the HCV, it will be very meaningful.
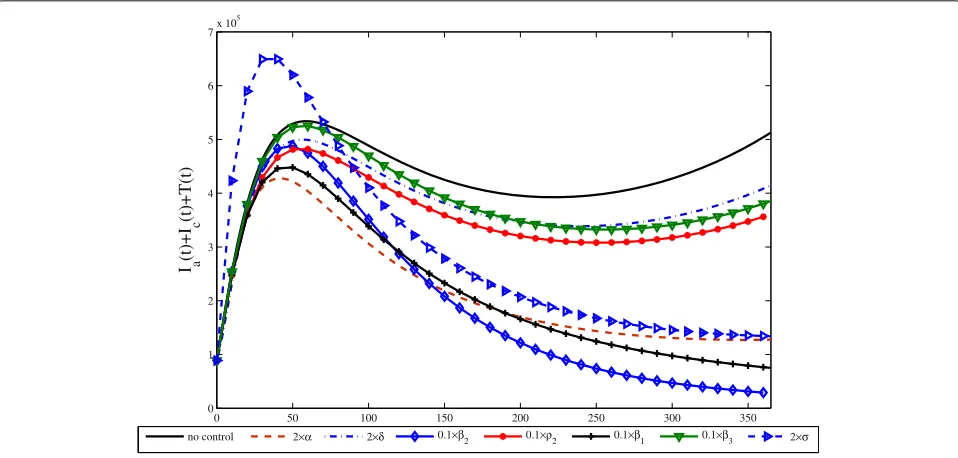
Next, we selected the data of 2016 to simulate the future prevalence trend of hepatitis C in China under various cir-cumstances, and the results were shown in Fig.3. We can observe thatβ2,β1,αandσare the most sensitive parame-ters comparing with the others because just slight changes can achieve the goal of control. These existing measures to control and prevent HCV can be essentially attributed to how to reduceβ2 andβ1. Based on the discussion in this paper, it is vitally important not only to reduceβ2and β1, but also to increaseα andσ. In addition, it is more effectively to reduceβ2andβ1than to reduceβ3precisely because chronic patients will pay more attention to the contact with others and do a good job of protection than those who do not show symptoms in the incubation and acute period.
Based on the above analysis, we propose some preven-tive measures as follows:
(1) It can control the spread of the HCV by reduc-ing infection rate of contactreduc-ing with the exposed and the acutely infected to the susceptible (β1andβ2) (see Fig.3). Therefore, it is vital to advocate public education so that
we can understand the spread of HCV well and reduce the probability of contacting with the patients. For exam-ple, avoid unnecessary injection, transfusion and using of blood products unless go to formally medical health insti-tutions. It is necessary to disinfect strictly for bloody items and the humoral pollutants. Stay away from drugs and educate intravenous drug users to let them know the harm of impurity injection and give them some advice about drug rehabilitation.
(2) It can control the spread of HCV at a lower level by shortening the diagnosis time of acute infection (1/α) and the hesitant time for being treated of chronically infected patients (1/δ) (see Fig.3). That is, improve the transition rates of the acute (α) and chronic infection patients (δ), especially for α, which has extremely high sensitivity not only to the basic reproduction number but also to the endemic equilibrium. If we often do exer-cise to improve our immunity, even if we are infected by HCV, we can restore health by autoimmunity. Check your body regularly, and hospital treatment can prevent the disease from aggravation. Although some HCV patients will recover after a period of oral medication at home, it is still necessary to encourage more chronic patients to receive treatment in hospital as quickly as possible, after all, it is more likely to recover and it could con-tact with less patients in the process of rehabilitation, so that the risk of being infected is also smaller for the susceptible.
(3) It can effectively control the spread of HCV by reduc-ing the diagnosis time of exposed (1/σ), i.e., improve the rate of progressing to acute stage from the exposed stage (σ) (see Fig.3). Thence, once we fell uncomfortable, we should go to a hospital for diagnosis in time, because the earlier you detect of the illness and treat, the more possibility you can recover [36].
(4) Reduce the proportion of chronic infection from acutely infection populationρ2(see Fig.3). From Tables3 and 4, we can see that it is very sensitive to the basic reproduction number and the endemic equilibrium. So it is meaningful to received timely treatment, which can reduce the source of infection. Because 70% to 80% patients are asymptomatic [13,14], it is difficult to diag-nose acute HCV infection. But some studies suggest that acute infection stage is very sensitive to treatment, and it is an unique opportunity to prevent the evolution of chronic infection [15].
0 50 100 150 200 250 300 350 0 1 2 3 4 5 6 7x 10
5
I a
(t)+I
c
(t)+T(t)
no control 2 2 0.1
2 0.1 2 0.1 1 0.1 3 2
Fig. 3Simulation of the sum of not hospitalized infectiousIa(t)+Ic(t)and hospitalized infectiousT(t)with all parameters,
2α=2×0.0162=0.0324, 2δ=2×0.1=0.2, 0.1β2=0.1×0.0246=0.00246, 0.1ρ2=0.1×0.87=0.087, 0.1β1=0.1×0.0223=0.00223, 0.1β3=0.1×0.022=0.0022, 2σ=2×0.0272=0.0544 from the seventh column of Table2, respectively, when one parameter takes a specific value, the other parameters take the value of the seventh column in Table2
In a word, if we can implement these control measures, HCV will be controlled well, and with the time flies, the number of patients will decrease.
Appendix
By the parameters value of 2015 given in Table2, we can calculate the endemic equilibrium values:
P∗=(S∗,E∗,Ia∗,Ic∗,T∗,R∗)=(184287929.9, 575029.5,
783783.9, 83492.0, 1880.2, 140659573.5).
The variables (S,E,Ia,Ic,T,R) have been
replaced by x1, x2, x3, x4, x5, x6; the parameters l,m,n,β1,β2,β3,σ,α,ρ1,ρ2,δ,η1,λ,p1,γ,,μ,d1,d2 by y1,y2,y3,y4,y5,y6,y7,y8,y9,y10,y11,y12,y13,y14,y15,y16,y17,
y18,y19; the point of endemic equilibrium
(S∗,E∗,Ia∗,Ic∗,T∗,R∗) by x∗1,x∗2,x∗3,x∗4,x∗5,x∗6 and six equilibrium equations of the model by
fi(x1, ...,x6;y1, ...,y19)=0,i=1, 2, 3, 4, 5, 6.
f1(x1, ...,x6;y1, ...,y19)=y16−y17y1x2−y17y2x3−y17y3x4
− (y4x2+y5x3+y6x4)x1 x1+x2+x3+x4+x5+x6 +y15x6−y17x1=0,
f2(x1, ...,x6;y1, ...,y19)= (y4x2+y5x3+y6x4)x1
x1+x2+x3+x4+x5+x6−y7x2−y17x2
+y17y1x2+y17y2x3+y17y3x4=0,
f3(x1, ...,x6;y1, ...,y19)=y7x2−y8x3−y17x3−y18x3=0,
f4(x1, ...,x6;y1, ...,y19)=y10y8x3−y11x4
+(1−y12)y13x5−y17x4−y19x4=0,
f5(x1, ...,x6;y1, ...,y19)=(1−y9−y10)y8x3
+(1−y9)y11x4−y13x5−y17x5=0,
and
f6(x1, ...,x6;y1, ...,y19)=y14y11x4+y9y8x3+y12y13x5 −(y15+y17)x6=0.
LetAXj=Kjbe the system of equations where
A= ⎡ ⎢ ⎢ ⎢ ⎢ ⎢ ⎢ ⎣
a11 a12 a13 a14 a15 a16 a21 a22 a23 a24 a25 a26 a31 a32 a33 a34 a35 a36 a41 a42 a43 a44 a45 a46 a51 a52 a53 a54 a55 a56 a61 a62 a63 a64 a65 a66
⎤ ⎥ ⎥ ⎥ ⎥ ⎥ ⎥ ⎦ ;
Xj= ⎡ ⎢ ⎢ ⎢ ⎢ ⎢ ⎢ ⎢ ⎢ ⎢ ⎢ ⎢ ⎣
∂x∗1 ∂yj ∂x∗2 ∂yj ∂x∗3 ∂yj ∂x∗4 ∂yj ∂x∗5 ∂yj ∂x∗6 ∂yj
⎤ ⎥ ⎥ ⎥ ⎥ ⎥ ⎥ ⎥ ⎥ ⎥ ⎥ ⎥ ⎦
;Kj= ⎡ ⎢ ⎢ ⎢ ⎢ ⎢ ⎢ ⎢ ⎢ ⎢ ⎢ ⎣
−∂f1 ∂yj −∂f2 ∂yj −∂f3 ∂yj −∂f4 ∂yj −∂f5 ∂yj −∂f6 ∂yj
[image:9.595.59.538.87.316.2]a11= (xx1(x2y4+x3y5+x4y6)
1+x2+x3+x4+x5+x6)2−
x2y4+x3y5+x4y6
x1+x2+x3+x4+x5+x6−y17, a12= (xx1(x2y4+x3y5+x4y6)
1+x2+x3+x4+x5+x6)2−y1y17−
x1y4
x1+x2+x3+x4+x5+x6, a13= (xx1(x2y4+x3y5+x4y6)
1+x2+x3+x4+x5+x6)2−y2y17−
x1y5
x1+x2+x3+x4+x5+x6, a14= (xx1(x2y4+x3y5+x4y6)
1+x2+x3+x4+x5+x6)2−y3y17−
x1y6
x1+x2+x3+x4+x5+x6, a15= (xx1(x2y4+x3y5+x4y6)
1+x2+x3+x4+x5+x6)2,a16=y15+
x1(x2y4+x3y5+x4y6)
(x1+x2+x3+x4+x5+x6)2, a21= x1+x2xy24++xx33+yx54++xx45y+6x6−
x1(x2y4+x3y5+x4y6)
(x1+x2+x3+x4+x5+x6)2, a22=y1y17−y17−y7−(xx1(x2y4+x3y5+x4y6)
1+x2+x3+x4+x5+x6)2+
x1y4
x1+x2+x3+x4+x5+x6, a23=y2y17−(xx1(x2y4+x3y5+x4y6)
1+x2+x3+x4+x5+x6)2+
x1y5
x1+x2+x3+x4+x5+x6, a24=y3y17−(xx1(x2y4+x3y5+x4y6)
1+x2+x3+x4+x5+x6)2+
x1y6
x1+x2+x3+x4+x5+x6, a25= −(xx1(x2y4+x3y5+x4y6)
1+x2+x3+x4+x5+x6)2,a26= −
x1(x2y4+x3y5+x4y6)
(x1+x2+x3+x4+x5+x6)2, a31=0,a32=y7,a33= −y8−y17−y18,a34=0,a35
=0,a36=0,a41=0,a42=0,
a43=y8y10,a44= −y11−y17−y19,a45= −y13(y12−1),a46
=0,a51=0,a52=0,
a53= −y8(y9+y10−1),a54= −y11(y9−1),a55= −y13−y17,a56
=0,a61=0,a62=0,
a63=y8y9,a64=y11y14,a65=y12y13,a66= −y15−y17.
Finally, the sensitivity index of the point of endemic equilibrium,x∗i to the parameter,yjis given by ∂x
∗ i ∂yj
yj
x∗i for 1≤i≤6 and 1≤j≤16.
Abbreviations
China’s CDC: Chinese center for disease control and prevention; HCC: Hepatocellular carcinoma; HCV: Hepatitis C virus; IDUs: Injecting drug users; RNA: Ribonucleic acid;SEIaIcTR: Susceptible-exposed-acute infection-chronic
infection-treated-recovered; SQP: Sequence quadratic program; WHO: The world health organization
Acknowledgments
We would like to thank anonymous reviewers for very helpful suggestions which improved greatly this manuscript.
Authors’ contributions
LY, JW and WJ conceptualized and designed the study, drafted the initial manuscript, and approved the final manuscript as submitted. FC and WJ analyzed the data and simulated parameters. JW and LY carried out the initial analyses, reviewed and revised the manuscript. All authors read and approved the final manuscript.
Funding
The work was partially supported by the National Natural Science Foundation of China (11547006, 11471133), Scientific Research Project of Hubei Provincial Department of Education (B2017039), Undergraduate Training Program of Yangtze University for Innovation and Entrepreneurship (20150094). The funding body had no role in the study design, collection, analysis, interpretation of data and in writing the manuscript.
Availability of data and materials
The data that support the findings of this study are available from the China Center for Disease Control and Prevention (China’s CDC) (http://www.nhc.gov. cn/jkj/s2907/new_list.shtml?tdsourcetag=s_pcqq_aiomsg), these network direct data are completely open, and we count these data month by month.
Ethics approval and consent to participate
Not applicable.
Consent for publication
Not applicable.
Competing interests
The authors declare that there is no conflict of interests regarding the publication of this article. No authors have potential conflicts of interest with reference to this work.
Author details
1School of Information and Mathematics, Yangtze University, Jingzhou 434023, China, Nanhuan Road, 434023 Jingzhou, China.2College of Mechanical and Vehicle Engineering, Hunan University, Lushan South Road, 410082 Changsha, China.3School of Mechanical and Automotive Engineering, South China University of Technology, Wushan Road, 510641 Guangzhou, China.4Institute of Applied Mathematics, Yangtze University, Nanhuan Road, 434023 Jingzhou, China.
Received: 19 June 2018 Accepted: 24 July 2019
References
1. Hepatitis C.http://www.who.int/news-room/fact-sheets/detail/hepatitis-c. Accessed 9 July 2019.
2. Edlin BR, Eckhardt BJ, Shu MA, Holmberg SD, Swan T. Toward a more accurate estimate of the prevalence of hepatitis c in the united states. Hepatology. 2015;62(5):1353–63.
3. Surveillance for Viral Hepatitis-United States. 2016.https://www.cdc.gov/ hepatitis/statistics/2016surveillance/pdfs/2016HepSurveillanceRpt.pdf. Accessed 11 Jan 2017.
4. Hope VD, Eramova I, Capurro D, Donoghoe MC. Prevalence and estimation of hepatitis B and C infections in the WHO European Region: a review of data focusing on the countries outside the European Union and the European Free Trade Association. Epidemiol Infect. 2014;142(2):270–86. 5. Young J, Weis N, Hofer H, Irving W, Weiland O, Giostra E, Pascasio JM,
Castells L, Prieto M, Postema R, et al. The effectiveness of daclatasvir based therapy in european patients with chronic hepatitis c and advanced liver disease. BMC Infect Dis. 2017;17(1):45.
6. Razali K, Thein HH, Bell J, Cooper-Stanbury M, Dolan K, Dore G, George J, Kaldor J, Karvelas M, Li J, et al. Modelling the hepatitis c virus epidemic in australia. Drug Alcohol Depend. 2007;91(2–3):228–35.
7. Dazley JS, Sriramulu LD, Slim J. Decompensated hcv patients with co morbidities including hiv who are medically treated are shown to minimize decompensation related admissions and healthcare cost: A case series. J Infect Pub Health. 2017;10(2):228–31.
8. Choo Q-L, Kuo G, Weiner AJ, Overby LR, Bradley DW, Houghton M. Isolation of a cdna clone derived from a blood-borne non-a, non-b viral hepatitis genome. Science. 1989;244(4902):359–62.
9. Kuo G, Choo Q-L, Alter H, Gitnick G, Redeker A, Purcell R, Miyamura Te, Dienstag J, Alter M, Stevens C, et al. An assay for circulating antibodies to a major etiologic virus of human non-a, non-b hepatitis. Science. 1989;244(4902):362–4.
10. Martcheva M, Castillo-Chavez C. Diseases with chronic stage in a population with varying size. Math Biosci. 2003;182(1):1–25.
11. Shepard CW, Finelli L, Alter MJ. Global epidemiology of hepatitis c virus infection. Lancet Infect Dis. 2005;5(9):558–67.
12. What Is the Incubation Period for Hepatitis C?https://www.healthline. com/health/hepatitis-c-incubation-period. Accessed 27 Aug 2017. 13. Chen SL, Morgan TR. The natural history of hepatitis c virus (hcv)
infection. Int J Med Sci. 2006;3(2):47.
14. Alberti A, Chemello L, Benvegnù L. Natural history of hepatitis c. J Hepatol. 1999;31:17–24.
15. Das P, Mukherjee D, Sarkar A. Analysis of a disease transmission model of hepatitis c. J Biol Syst. 2005;13(04):331–9.
16. Tong MJ, El-Farra NS, Reikes AR, Co RL. Clinical outcomes after transfusion-associated hepatitis c. N Engl J Med. 1995;332(22):1463–6. 17. Seeff LB. Natural history of hepatitis c. Hepatology. 1997;26(S3):21–8. 18. Yuan J, Yang Z. Global dynamics of an sei model with acute and chronic
stages. J Comput Appl Math. 2008;213(2):465–76.
19. Imran M, Hassan M, Dur-E-Ahmad M, Khan A. A comparison of a deterministic and stochastic model for hepatitis c with an isolation stage. J Biol Dyn. 2013;7(1):276–301.
methadone maintenance programs. Drug Alcohol Depend. 2010;110(3): 228–33.
21. Martin NK, Vickerman P, Hickman M. Mathematical modelling of hepatitis c treatment for injecting drug users. J Theor Biol. 2011;274(1):58–66. 22. Martin NK, Vickerman P, Foster GR, Hutchinson SJ, Goldberg DJ,
Hickman M. Can antiviral therapy for hepatitis c reduce the prevalence of hcv among injecting drug user populations? a modeling analysis of its prevention utility. J Hepatol. 2011;54(6):1137–44.
23. Zhang S, Zhou Y. Dynamics and application of an epidemiological model for hepatitis c. Math Comput Model. 2012;56(1–2):36–42.
24. Shen M, Xiao Y, Zhou W, Li Z. Global dynamics and applications of an epidemiological model for hepatitis c virus transmission in china. Discret Dyn Nat Soc. 2015;2015:13. Article ID 543029.
25. Prevention and Control of Infectious Diseases (in Chinese).http://www. nhc.gov.cn/jkj/s2907/new_list.shtml?tdsourcetag=s_pcqq_aiomsg. Accessed 4 Aug 2019.
26. Van den Driessche P, Watmough J. Reproduction numbers and sub-threshold endemic equilibria for compartmental models of disease transmission. Math Biosci. 2002;180(1–2):29–48.
27. National Bureau of Statistics of China (in Chinese).http://data.stats.gov. cn/easyquery.htm?cn=C01. Accessed 4 Aug 2019.
28. Zhang X, Zhao Y, Neumann AU. Partial immunity and vaccination for influenza. J Comput Biol. 2010;17(12):1689–96.
29. Li Y, Wang L, Pang L, Liu S. The data fitting and optimal control of a hand, foot and mouth disease (hfmd) model with stage structure. Appl Math Comput. 2016;276:61–74.
30. Information on Human Infection with H7N9 Avian Influenza (5 April 2013) (in Chinese).http://www.gov.cn/gzdt/2013-04/06/content_2370976.htm. Accessed 6 Apr 2013.
31. Xinhua Net, “A 7.0-magnitude Strong Earthquake Hit Ya’an, in Sichuan Province” (in Chinese).http://www.xinhuanet.com/politics/earthquake/ index.htm. Accessed 20 Apr 2013.
32. Samsuzzoha M, Singh M, Lucy D. Uncertainty and sensitivity analysis of the basic reproduction number of a vaccinated epidemic model of influenza. Appl Math Model. 2013;37(3):903–15.
33. Chitnis N, Hyman JM, Cushing JM. Determining important parameters in the spread of malaria through the sensitivity analysis of a mathematical model. Bull Math Biol. 2008;70(5):1272.
34. Cox AL. Global control of hepatitis c virus. Science. 2015;349(6250):790–1. 35. Seeff LB. Natural history of hepatitis c. Am J Med. 1999;107(6):10–5. 36. Cohen J. Calling all baby boomers: get your hepatitis C test. Am Assoc
Adv Sci. 2012;337(6097):903.
37. Enserink M. First specific drugs raise hopes for hepatitis C. Am Assoc Adv Sci. 2011;332(6026):159–60.
38. Hill A, Cooke G. Hepatitis c can be cured globally, but at what cost? Science. 2014;345(6193):141–2.
39. Cohen J. Despite setbacks, optimism on drugs for hepatitis C. Am Assoc Adv Sci. 2012;337(6101):1450–1.
Publisher’s Note