JUNE-JULY, 2017, VOL. 4/22 www.srjis.com Page 5933 SPECTROSCOPIC & CHROMATOGRAPHIC METHODS
Mr. Shivaji R. Aher
The aim of the present study was to investigate the use of spectroscopic methods, near-infrared (NIR) and Raman spectroscopy, in elucidating phenomena taking place during wet granulation. More specifically, a processing-induced transformation, hydrate formation, which takes place during wet granulation, was studied. In addition, the use of near-infrared spectroscopy in the process monitoring of high-shear wet granulation was studied by comparing it to impeller torque measurements, which is an established process monitoring method. The measurements were performed off- or at-line. Moreover, the difficulty to grasp the large data amounts produced by different process monitoring methods was addressed by combining the data and visualizing it with projection methods. Two different approaches were investigated, principal components analysis and self-organizing maps, which are linear and non-linear methods, respectively. The development of the pharmaceuticals brought a revolution in human health. These pharmaceuticals would serve their intent only if they are free from impurities and are administered in an appropriate amount. To make drugs serve their purpose various chemical and instrumental methods were developed at regular intervals which are involved in the estimation of drugs. These pharmaceuticals may develop impurities at various stages of their development, transportation and storage which makes the pharmaceutical risky to be administered, thus they must be detected and quantitated. For this analytical instrumentation and methods play an important role.
Keywords: Spectroscopic, Chromatographic, Methods, Analytical, Instruments, Pharmaceuticals,
Quality, Chromatography, etc.
INTRODUCTION:
Polyphenols belong to a chemical class of flavonoids which are widely distributed in
vegetables and plants. They possess a number of biological activities and thus received much
attention in phytotherapy research. The phospholipid complexes were originally coined as
“Phytosomes”. No literature has been reported on the reactivity of polyphenols towards
phospholipids depending upon refluxing time, cooling temperature, nature of phospholipids
and the polyphenols in mixture form or in an isolated form. We aim to compare different
analytical techniques for quantification of biomarkers and their phospholipid complexes. In
this study biomarkers were taken at standard concentrations and its phospholipid complex
were prepared. LC-MS/MS, HPLC, FTIR and NMR analytical techniques were used to Scholarly Research Journal's is licensed Based on a work at www.srjis.com
JUNE-JULY, 2017, VOL. 4/22 www.srjis.com Page 5934 quantify, characterize and monitor the complexes. Methods used for complexation of
biomarkers gave good yields. 1H-NMR and FT-IR were reported for confirmation of
phospholipids complex with natural polyphenols but the present study highlighted the need of
spectrometry and chromatographic system in order to get better clarity regarding the
formation of phospholipids complexes. NMR spectra can only give us the information if the
complex has formed or not but doesn‟t give the required information which flavonoid has
complexed. Mass spectrometry revealed good precision and gave superior results over NMR
of the respective complexes formed. More over the purity of these complexes which were
formed during the reaction can be understood by the chromatographic system. This work
found novelty in terms of revealing the molecules involved and their efficiency in the process
of complexation.
REVIEW OF LITERATURE:
The process of drug development starts with the innovation of a drug molecule that has
showed therapeutic value to battle, control, check or cure diseases. The synthesis and
characterization of such molecules which are also called active pharmaceutical ingredients
(APIs) and their analysis to create preliminary safety and therapeutic efficacy data are
prerequisites to identify the drug candidates for further detailed investigations. In the field of
pharmaceutical research, the analytical investigation of bulk drug materials, intermediates,
drug products, drug formulations, impurities, degradation products, and biological samples
containing the drugs and their metabolites is very important. From the commencement of
official pharmaceutical analysis, analytical assay methods were included in the compendial
monographs with the aim to characterize the quality of bulk drug materials by setting limits
of their active ingredient content. In recent years, the assay methods in the monographs
include titrimetry, spectrometry, chromatography, and capillary electrophoresis; also the
electro analytical methods can be seen in the literature. From the stages of drug development
to marketing and post marketing, analytical techniques play a great role, be it understanding
the physical and chemical stability of the drug, impact on the selection and design of the
dosage form, assessing the stability of the drug molecules, quantitation of the impurities and
identification of those impurities which are above the established threshold essential to
evaluate the toxicity profiles of these impurities to distinguish these from that of the API,
when applicable and assessing the content of drug in the marketed products. The analysis of
drug and its metabolite which may be either quantitative or qualitative is extensively applied
in the pharmacokinetic studies. This review highlights the role of various analytical
JUNE-JULY, 2017, VOL. 4/22 www.srjis.com Page 5935 1. MATERIALS, CHEMICALS AND REAGENTS: All the biomarkers and phospholipids
(Phosphatidylcholine – 60%) were purchased from Sigma (USA). All technical grade
solvents were procured from SD fine chemicals (India).
Preparation of biomarker mixture for HPLC: Three standard polyphenols catechins,
quercetin and myricetinprepared in methanol to give a concentration of 10 µg/ml. All the
solutions were stored in the dark at 4°C. HPLC analysis indicated these solutions were stable
within 2 months. Standard quercetin, catechins and myricetin solution was mixed in
equiproportion (1 ml each of 10 µg/ml solution) to give 10 µg/ml solution of standard
mixture of polyphenols. The final solution of standard polyphenol mixture was made in the
range of 20-15000 ng/ml. These three polyphenols were chosen because these three
polyphenols possess different solubility in various solvents as only myricetin is soluble in
water; catechin is soluble in methanol and ethanol and not in water and quercetin is soluble in
acetone. Methanolic extract was prepared for the polyphenols to successfully quantify using
suitable analytical tools.
High Performance Liquid Chromatographic (HPLC) conditions: The chromatographic
system (Jasco) consisting a PDA detector was used. A reverse phase Qualisil BDS-C column
(4.6 mm f x 25. mm) packed with 5 µm diameter particles was used. In order to estimate the
three polyphenols simultaneously a gradient phase chromatographic methods was developed.
In the course of experiments, several ratio of acetonitrile: water in isocratic system was
studied and the effect of o-phosphoric acid to regulate the pH value was examined.
2 LC INSTRUMENTS AND ANALYTICAL CONDITION: Polyphenols analysis by
LC-ESI-MS/MS were carried out using an Agilent 1100 series LC and LC/MSD Trap VL mass
spectrometer (Agilent Technologies, USA) equipped with electrospray ionization (ESI)
interface. In order to obtain optimum ionizing conditions, the reference solution was used
were both Atmospheric Pressure Chemical Ionization (APCI) and electrospray ionization
interface were tested in positive and negative ion modes by scanning between m/z 200550 per
second. The column temperature was maintained at 25°C. Quantification was achieved using
selected ion monitoring system (SIM) mode of ion. The flow rate was 0.5 ml/min.
Preparation of standard solution and working reference solution for LC-MS/MS:
Standard solution was prepared by dissolving biomarkers like quercetin, catechin and
myricetin in methanol. The concentration prepared was in the range of 5 ppm-200 ppm both
for the biomarkers and the extract. Biomarkers like quercetin, catechin and myricetin were
taken in combination to prepare biomarker mixture as working reference solution for
JUNE-JULY, 2017, VOL. 4/22 www.srjis.com Page 5936 Preparation of phospholipid complex of biomarker mixture: Biomarkers were taken into
a solution of phospholipid in dichloromethane (DCM) in 2:1 proportion (1gm 25 mg of
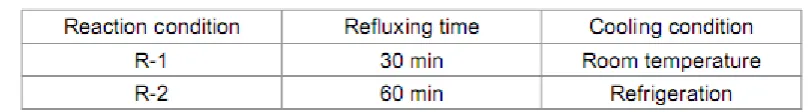
phospholipids and 450 mg of biomarker mixture). Two types of reactions conditions were
maintained during preparation of phospholipid complex. After refluxing for certain time the
mixture was filtered and kept for evaporation under vacuum. The residue was re-dissolved in
the DCM and added slowly to a non-solvent n-hexane. The resultant mixture was kept on
cooling at room temperature (R-1). In second method all the steps were repeated except the
last step where the resultant mixture was kept on cooling in refrigerator for overnight (R-2)
[image:4.595.92.498.277.333.2](Table-1).
Table 1: Reaction condition of phospholipids complex
Recording of mass spectra:In mass spectra an ESI total ion chromatogram (TIC) scans was
performed and analysed.Mass spectrometry was performed with an Agilent 6460 LC/MS/MS
triple quadruple (Agilent Technologies, Santa Clara, CA) and an electrospray ionization
source (ESI). To reduce the surface contact with the interior of the system, samples were
directly infused via the Agilent 1290 automated injection system, with the column adaptation
bypassed; 20 lL of each sample were infused at 100 lL/min. Between each run, the syringe
and insert tubing were cleaned using buffer and chloroform to avoid sample to sample
contamination. Phospholipids were identified by detection of specific leaving groups from
precursor ions after collision-induced dissociation (CID) for example, the leaving group of
fragmented phosphatidylcholine (PC).
Monitoring of phospholipid complexes reaction condition by HPLC:A gradient HPLC
method for the polyphenols catechin, quercetin and myricetin was taken into consideration in
monitoring the reaction condition during preparation of phospholipids. Phospholipids
complex was not soluble in acetonitrile unlike polyphenols. Several solvent has been tested to
dissolve the phospholipid complex and finally dioxane has been selected because its
miscibility with water. Immiscibility of solvent and insolubility of complex in the solvent can
leads to precipitation of complex in the mobile phase leading to clogging on the column
thereby with the dioxane this problem was conquered.
3 THIN LAYER CHROMATOGRAPHY: In thin layer chromatography, a solid phase
(stationary phase), the adsorbent, is coated onto a solid support as a thin layer (about 0.25
JUNE-JULY, 2017, VOL. 4/22 www.srjis.com Page 5937 the absorbent to facilitate the coating. Many different solid supports are employed, including
thin sheets of glass, plastic, and aluminum. The mixture (A plus B) to be separated is
dissolved in a solvent and the resulting solution is spotted onto the thin layer plate near the
bottom. A solvent, or mixture of solvents, called the eluents, is allowed to flow up the plate
by capillary action. At all times, the solid will adsorb a certain fraction of each component of
the mixture and the remainder will be in solution. Any one molecule will spend part of the
time sitting still on the adsorbent with the remainder moving up the plate with the solvent. A
substance that is strongly adsorbed (say, A) will have a greater fraction of its molecules
adsorbed at any one time, and thus any one molecule of A will spend more time sitting still
and less time moving. In contrast, a weakly adsorbed substance (B) will have a smaller
fraction of its molecules adsorbed at any one time, and hence any one molecule of B will
spend less time sitting and more time moving. Thus, the more weakly a substance is
adsorbed, the farther up the plate it will move. The more strongly a substance is adsorbed, the
closer it will stay near the origin.
4 SPECTROSCOPIC TECHNIQUES:
Spectrophotometry: Another important group of methods which find an important place in
pharmacopoeias are spectrophotometric methods based on natural UV absorption and
chemical reactions. Spectrophotometry is the quantitative measurement of the reflection or
transmission properties of a material as a function of wavelength. The advantages of these
methods are low time and labor consumption. The precision of these methods is also
excellent. The use of UV-Vis spectrophotometry especially applied in the analysis of
pharmaceutical dosage form has increased rapidly over the last few years. The Light of
Knowledge is an often used phrase, but it is particularly appropriate in reference to
spectroscopy. Most of what we know about the structure of atoms and molecules comes from
studying their interaction with light (electromagnetic radiation). Different regions of the
electromagnetic spectrum provide different kinds of information as a result of such
interactions.
Mass Spectrometry: Sample molecules are ionized by high energy electrons. The mass to
charge ratio of these ions is measured very accurately by electrostatic acceleration and
magnetic field fluctuations, providing a precise molecular weight. Ion fragmentation patterns
may be related to the structure of the molecular ion.
Ultraviolet-Visible: Spectroscopy Absorption of this relatively high-energy light causes
excitation of electrons. The easily accessible part of this region (wavelengths of 200 to 800
JUNE-JULY, 2017, VOL. 4/22 www.srjis.com Page 5938 Infrared Spectroscopy: Absorption of this lower energy radiation causes vibrational and
rotational excitation of groups of atoms within the molecule. Because of their characteristic
absorptions identification of functional groups is easily accomplished.
Nuclear Magnetic: Resonance Spectroscopy Absorption in the low-energy radio-frequency
part of the spectrum causes excitation of nuclear spin states. NMR spectrometers are tuned to
certain nuclei (e.g. 1H, 13C, 19F and 31P). For a given type of nucleus, high-resolution
spectroscopy distinguishes and counts atoms in different locations in the molecule.
HPLC Coupling with Various Spectroscopic Techniques: HPLC can be combined with
numerous other analytical techniques but the most important coupling principle is the one
with spectroscopy. Chromatography and spectroscopy are orthogonal techniques, i.e. their
types of information are very different. Chromatography is a separation method and
spectroscopy is a technique which yields a „fingerprint‟ of molecules. Coupling with atomic
spectrometry is rarely used although it allows the detection of toxic metals in environmental
samples or of metalloproteinase. Four other techniques, HPLC-UV, HPLC-FTIR, HPLC-MS
and HPLCNMR are more important because excellent spectra are obtained with them, thus
allowing structure elucidation.
CONCLUSION:
This study compared the pre-processing and non-linear modelling techniques for the
calibration of NIR spectroscopy in the presence of light scattering effect. A rigorous
statistical procedure was adopted to obtain reliable comparison results. Although none of the
techniques is always the best on all datasets, OPLEC and GP are found to be the most
promising in terms of low prediction error. Compared with traditional approaches (D1, D2
and SNV), the more recently developed pre-processing methods (EMSC, EISC and OPLEC)
are more favourable. This is due to better modelling of the light scattering effect (such as
including the wavelength terms % in the mode) and more advanced parameter estimation
strategy (such as that of OPLEC). Therefore, if future research can lead to clearer
understanding of the light scattering mechanism, and this information can be chemo
metrically modelled, then more powerful pre-processing techniques may emerge. However,
in some practical situations, the light scattering effect is coupled with other disturbances to
jointly affect the linearity of the spectral measurements. For example, when NIR
spectrometers are applied for in situ monitoring of drying processes, both light scattering and
temperature variation will affect the calibration accuracy. Under these circumstances, the
JUNE-JULY, 2017, VOL. 4/22 www.srjis.com Page 5939 In this regard, non-linear calibration techniques are preferred since they directly model the
spectra-concentration relationship. Among the three non-linear models considered in this
study, GP is recommended since it consistently attained lower RMSEP than ANN and
LS-SVM. Finally, we have attempted to combine pre-processing and non-linear techniques; yet
this strategy does not always outperform the individual techniques. This “hybrid” approach is
conceptually appealing, and it will be further investigated in the future work.
REFERENCES:
C.C. Pelletier, J.L. Lambert, and M. Borchert, Appl. Spectros. 59 (2005) 1024. L. Zhang, G.W. Small, and M. Arnold, Anal. Chem. 75 (2003) 5905.
O. Liesenfeld, J.G. Montoya, S. Kinney, C. Press, and J.S. Remington, J. Infect. Dis. 183 (2001) 1248. J.G. Montoya, O. Liesenfeld, S. Kinney, C. Press, and J.S. Remington, J. Clin. Microbiol.40 (2002)
2504.
B.R. Dannemann,W.C. Vaughan, P. Thulliez, and J.S. Remington, J. Clin. Microbiol.28 (1990) 1928. J.S. Remington, R. McLeod, P. Thulliez, and G. Desmonts, J. S. Remington and J. Klein, eds., W.B.
Saunders, (Philadelphia, 2001) p.205.
P. Thulliez, F. Daffos, and F. Forestier, Scand. J. Infect. Dis. Suppl. 84 (1992) 18.
Chen, T., and J. Ren. 2009. Bagging for Gaussian process regression. Neurocomputing72: 1605-1610.
Gratton, E. 1971. Method for automatic correction of scattering in absorption spectra by using integrating sphere.Biopolymers10: 2629-2634.
Rasmussen, C. E., and C. K. I. Williams. 2006. Gaussian Processes for Machine Learning. MIT press: Cambridge, MA.
Wright, S., S. Brumbck, T. Niebur, and R. Welle. 2002. Near‐infrared spectrometry for real‐time analysis of substances. U.S. Patent No. 6,483,583.
Doherty, W. 2007. A preliminary assessment of methods to measure in field sugar loss, Queensland Univ. of Tech. - Project SR1141, Australia.
Næs, T., Isaksson, T., Fearn, T., and Davies, T. 2004. A user-friendly guide to multivariate calibration and classification. Charlton, Chichester, UK: NIR Publications.