1
EE
Introduction
In April 1995, Scottish unemployment rose by 2,027 to stand at 201,270. This represents a monthly rise of 1% and leaves 8.3% of the Scottish workforce unemployed. Male jobless rose by 1,079 or by 0.7%, whilst the female count rose by 948 or by 2.1%. Male unemployment presently stands at 154,573 or 11.4% of the workforce and female jobless at 46,697 or 4.3% of the female workforce.
Examination of Table 1 indicates that British unemployment continued to fall in April. The British jobless total fell by 7/998 or 0.4% and presently stands at 2,138372 or 7.8% of the workforce. Thus, the Scottish rate continues to be above the British rate, a trend set out in Figures 1 - 3 . For both total and male unemployment, the Scottish rate has been above the British level since mid 1994, however, in April 1996 the female rate rose above the GB rate for the first time since early 1991. In April, British male unemployment fell by 11,901 or %% to stand at 1,628,627 or 10.7% of the male workforce whilst the female count rose by 3,904 or 0.8%.
The jobless count tends to faU in April due to seasonal factors which are most evident amongst females and in the peripheral areas such as Scotland. The seasonally adjusted series for Scotland and GB are set out in Table 2. This indicates that total unemployment in Scotland rose by 2,400 or IV*% which compares unfavourably with a fall of 3,900 or 02% evident in GB. The Scottish male count rose by 1,400 or 0.9% and the female by 1,000 or 2V4%. This is a poorer outcome than for Britain as a whole where male jobless fell by 0.4% and female rose by 0.47c.
In April, the seasonally adjusted count stood at 1,974,000 or 8.1% of the Scottish workforce which is higher than the 7.7% posted in Britain. The Scottish rate has
REVIEW
been at or below the GB rate since June 1995. The relative unemployment rate for Scotland is set out in Figures 4-6. A relative unemployment rate in excess of
100 indicates that Scottish unemployment is more adverse than nationally. Inspection of these figures indicates Scottish unemployment fell below the national rate in Spring 1992 for both sexes. However, the relative has been deteriorating since April 1993 and has been above 100 in the case of males since
1994 Ql. A similar picture can be drawn from the share of Scottish jobless in the GB total presented in Figures 7-9. In April 1996, Scottish male unemployment stood at 151,600 (11.2%) and the GB count at 1,594,200 (10%%). Female jobless in Scotland totally 45,800 whilst
the GB count was 503300. In both countries the female rate was 4.2%.
In the quarter to April 1996, seasonally adjusted unemployment in Scotland rose by 3,800 or 2% whilst jobless in Britain fell by 23,500 or 1.1%. For both males and females, unemployment in Scotland rose whilst falling in GB. In the case of men, the Scottish count rose by 2,100 or 1.4% compared with a national fall of 19,800 or 1V4%. The quarterly rise in female unemployed in Scotland was 1,700 or 3.9% which compares poorly with a 3,700 drop (%%) evident in GB.
In the year to April 1996, Scottish jobless fell by 5,300 or 2.6% whilst the GB count decreased by 145,600 or &A%. Clearly the rate of decline of unemployment has abated more recently. The annual fall is sharper in GB for both males and females than in Scotland. The Scottish male count fell by 5,200 or 3.3% which is a weaker performance than nationally where unemployment decreased by 115,100 or 6%%. In the case of females, the Scottish count fell by 100 or circa V*% compared with a drop of 30,500 or 5.7% in GB.
As we have set out in previous
Commentaries, there have been large cyclical rises in unemployment, particularly in the South in the 1990-93 period. The trend in GB regional unemployment is set out in Figures 10-12. In the presentations, the South of England refers to London, the South East, the South West and East Anglia. Midlands and Wales consisted of East and West Midlands plus Wales and the North of England comprises, Yorkshire & Humberside, the North West and Northern region. In the 1990-93 period, unemployment growth was strongest the further south one looks. In consequence, the fall in unemployed has been sharpest in many areas experiencing the sharpest rises across the recession. However, unemployment remains relatively high compared with pre-recession levels. Indeed, male unemployment remains circa twice 1990 levels in the South and female 1% times higher. Only in Scotland has the jobless queue fallen back to 1990 proportions. This is true for males and females, except for females in the North where female jobless queues are marginally below pre-recession levels.
Figures 13-15 set out the convergence of relative rates across the recession. As we have continued to suggest, the convergence is slowly unwinding. This is most evident in the case of males where relatives in Scotland and the North and in the South appear to be diverging at an increasing rate. Given likely population trends, and job forecast this process of divergence is set to continue. However, we do not expect the Scottish relative to attain the high levels obtained in the late 1980s but may setde down towards the 120 level passed in the middle of the previous decade.
In this review, we restrict our analysis to a detailed scrutiny of trends in the claimant count. Previous analysis suggests that there is little short term correlation between unemployment change and net employment creation due to population changes and volatility in activity rates. We will examine full labour market accounts for 1995 in the next Commentary.
Quarterly Economic Commentary 22
Unemployment in the British Regions
Tables 3-5 set out details of seasonally adjusted unemployment for Scotland, Britain and the standard planning regions for the April 1993-1996 period. Tables 6-8 presents seasonally adjusted unfilled vacancies and derived statistics, most notably the U/V ratio. The U/V ratio measures the number of unemployed chasing each vacancy and is a standard indicator of the tightness of labour markets.
Table 3 illustrates the trend in seasonally adjusted total unemployed. As set out above, the current Scottish rate is 8.1 which is circa 1.05 times the British equivalent. London, Wales and the 3 regions comprising the North of England have higher jobless rates than in Scotland. Scottish unemployment is higher than in the constructed areas of South of England and Midlands and Wales. As indicated above, Scotland's position relative to GB has been deteriorating since spring 1994.
Scottish unemployment decreased by 5300 or 2.6% in die year to April 1996. Only Wales records a weaker performance. The sharpest falls in unemployment were posted in the Rest of the South East (-9.6%), the South West (-8.0%), West Midlands (-7.9%) and London (-7.0%). In die past
12 months, unemployment tends to have fallen faster the further south one looks reversing the situation in the recession. This conclusion is reinforced when one examines the recent quarterly and monthly performance.
In die recent quarter, Scottish unemployment rose by 1,700 or 3.9%. Wales recorded an increase whilst other regions continued to experience a decline. The strongest fall were in London (-2.9%), the Rest of the South East (-2.1%) and East Anglia (-2.1%) with the South West and East Midlands each posting falls of Vh.%. In the month to April
1996, Scottish unemployment increased by 2,400 or
VA% which was the poorest outcome in any
region. Wales (0.9%) Yorkshire and Humberside (0.2%) and the Northern region (0.1%) also recorded rises whilst die sharpest falls were evident in London (-1%) and the rest of the South East (0.8%). In both the monthly and quarterly figures, die differential performance between North and South is manifest.
It is apparent from this analysis that unemployment in Britain is falling at a decreasing rate. British unemployment peaked in the first quarter of 1993. Table 3 sets out die trend between April 1993 and
April 1995 which serves as a good proxy for the decline from peak unemployment. Scottish unemployment fell by 48,900 or 19.9% with only Wales (-19.6%) and the Northern region (-16.7%) performing worse. British unemployment dropped by 750,600 or 26.4% with the sharpest falls evident in the south and North West In GB, the yearly fall was GA.%, the quarterly fall 1.1% and the monthly fall 0.2%. In Scotland, Wales and the north, unemployment is now rising. This poor performance is set to continue on the back of a weak trend in employment growth.
Table 4 sets out the trend in male jobless. In April 1996, the Scottish male count stood at 11 V4% of the workforce. Only London, Wales, Yorkshire and Humberside, The North West and the Northern region present higher male jobless rates. In the year to April 1996, Scottish male unemployment fell by 5200 or 3.3%. Only Wales posted a weaker fall. In the last year, male unemployment fell most strongly in the Rest of the South East (-9%%), the South West (-8.4%) and the West Midlands (-&/*%). Male unemployment is likewise falling most sharply the further south one looks.
Male unemployment in Scotland rose by 1,400 or by 0.9% in the recent quarter. Wales experienced a 1% increase whilst the English regions all posted decreases. The sharpest quarterly fall are evident in London (-2.9%), the Rest of the South East (-1.9%) and East Anglia (-1.7%). In the month to April, Scottish male jobless rose by 1,400 or 0.9%. Wales was the only other region to experience an increase with the sharpest falls evident in the South of England. In Britain, male unemployment fell by 589,500 or 27% from the 'peak' in April 1993 and the rate of decrease has been progressively slowing. Last year, GB male unemployment fell by 6%% and by 1V4% in the latest quarter and by 0.4% in the month to April. The slow down in most evident the further north one looks.
Table 5 presents details of female unemployment. In April 1996, the Scottish female rate was 4.2%, exactly the same as in GB. Only the Rest of the South East (32%), East Anglia (3.3%), the South West (3.7%) and East Midlands (4%) have lower jobless rates. In the past year, Scottish female unemployment fell by 100 or o.2%. This is the lowest decrease posted in any region. The sharpest yearly falls are evident in the Rest of the South East (-9.1%), East Anglia (-8.2%) and the West Midlands. The falls were weakest in Wales and the North.
In the latest quarter, Scottish female unemployment rose by 1,700 or 3%%. The GB count likewise rose but by a more modest 0.4%. Rises were also recorded in Wales (+3%) and the North (+2.8%) with the sharpest quarterly falls evident in East Anglia (-3.1%), London (2%%) and the rest of the South East (2V£%). In the month to April, Scottish
female unemployment rose by 1,000 or 2!/i%. The
female jobless queue only fell in the rest of the South East 0.8%), East Anglia 0.6%), London (-0.6%) and West Midlands (-0.2%). In all other regions female unemployment increased, with the sharpest rise posted in Scotland. British female jobless has fallen by 161,100 or 24.2% since April
1993. Not surprisingly, the sharpest fall are to be found in the South, Midlands and North West. As with males, female unemployment has been decreasing at a decreasing rate and has recently started to rise. The rises are most pronounced in Scotland, Wales and the 'north'.
We turn next to the trends in seasonally adjusted vacancies for the 1990-1996 period. These and related statistics are set out in Tables 6-8 and Figures 16-18. Table 6 indicates that there were 22,800 unfilled vacancies in Scotland which represented 12% of the British total. Scotland's share of GB vacancies rose sharply across the recession and peaked at 15.4% in April 1993. As other parts of the country recovered more quickly Scotland's share of vacancies fell steadily. However, Scotland's share dropped a full 1% in the latest quarter. Examination of Figure 18 reveals the trend decline in Scottish share of GB vacancies since the winter of 1992.
Table 7 sets out the changes in unfilled vacancies across the 1990-1996 period. It is interesting to note that the level of unfilled vacancies in GB is very close to pre-recession levels. However, there is a marked regional disparity. Vacancies in the rest of the South East are down by 12.1% and by 35% in the Northern region but up substantially in London (+18.9%), Yorkshire and Humberside (+16.3%) and East Midlands (+16.1%). In Scotland, the level of vacancies is up by 300 or IV*%. Because of the universally low and regionally differential reporting of vacancies, this data may be a poor guide to the underlying trend in labour demand. However, the data are consistent with a stronger recovery in the south.
Table 8 sets out the trends in the U/V ratio across the 1990-1996 period. The position of Scotland is illustrated in Figures 16 & 17. In April 1996, there were 8.7 Scottish jobless chasing each unfilled
vacancy down from 9.1 in April 1990 and 13.5 in April 1993. At present, only Wales has a lower U/V ratio. The highest ratios are evident in the Northern region (17.6), London (17.2), and Yorkshire & Humberside (13.1), all areas with high relatively high unemployment This may indicate a strong mismatch between labour demand and labour supply.
The U/V ratio in Scotland has been falling since April 1993 and the GB ratio has been falling more sharply since the 4th quarter of 1992. The trends in Scotland and GB are presented in Figure R. In April 1996, the Scottish ratio was 78.2% of GB compared with 115.8% in 1990 and 56.3% in April 1993. The trend in the relative rate is set out in Figure 17. In terms of the British regions, the most remarkable feature is the relative decline of the Northern region where U/V ratios have remained high since 1993 an where the relative position has deteriorated in the last year.
We conclude our appraisal of unemployment and vacancies in die British regions by considering the key trend. Unemployment has virtually stopped falling with Scotland, Wales and the North cooling most noticeably. Unemployment is falling most sharply in the 'South of England' but even there the rate of decrease is abating. It is too early to tell what is driving this trend, although output has weakened substantially since mid 1995. We will present a full set of labour market accounts for in die next Commentary and examine die trend in working population, employment and participation.
To illustrate this point, we present data on employment and unemployment change in die 1990-1995 period in Figures 19-21. Males in employment fell in every region. However, only in the Soudi West was the rise in unemployment higher than die fall in employment In all other regions, die rise in male unemployment fall short of die decrease in employment Indeed, in Scodand, male unemployment actually fell at a time of significant job losses. Outside die South West the male labour market has been characterised by some combination of falling population and falling labour market participation. Past analysis of die Labour Force Survey indicates that male participation remains on a downward trend. This would serve to undermine die effects of any change in employment on unemployment and engender a poor correlation between male employment and unemployment change.
In terms of females, die workforce in employment
actually rose in Scotland, die Noith, Wales, East Midlands, East Anglia and die Soutii West, in the 1990-1995 period. In Wales, East Midlands, East Anglia and die Soudi West female unemployment actually increased. This suggests a considerable displacement of females claimants by market entrants, in these areas. In Scodand and die Northern region, employment and unemployment change are more in line. In die North West bodi female employment and unemployment fell with employment falling more sharply. This suggests a marked fall in participation. In die otiier regions, die rise in unemployed is less than die fall in employment suggesting some change in population and/or participation.
Thus, we are sceptical about inferring to much from die claimant count However, die 1996 unemployment data is consistent with our client forecast that employment creation in botii Scotland and GB will be weak in 1996. In die case of Scodand, we expect unemployment to be fairly static, suggesting that there will continue to be rises in some of the coming months. Employment growth will be subdued, due to ongoing retrenchment in all areas of the economy, particularly, energy, engineering, banking, insurance and finance and die public sector. Prospects are better in 1997 and
1998. Our expectation is that a poor employment performance will mean very hole change in Scottish unemployment and tiiat tiiere will be more months tiiis year in which die seasonally adjusted count will rise. We turn next to unemployment trends within Scodand.
Unemployment in the Scottish and British Counties
In die previous section, we analysed Scottish, British and regional jobless with respect to die Department of Employment seasonally adjusted series. This series adjusts for die numerous revisions to die count which took place over die 1980s. No such adjustments are undertaken for areas smaller than die UK standard planning regions. However, mere have been no significant changes in die counting procedures since 1989, and abstracting from the effects of the restart programme and stricture availability for work, die series are consistent from tiiat point. Seasonality is another matter. More peripheral area tend to experience greater seasonality, as do female markets everywhere. We will emphasise appropriate analyses which minimise this complication.
Table 9 sets out die recent trend in unemployment
in the Scottish local authority regions. These are now redundant in Lothian, Strathclyde, Tayside, Grampian and Central where the unitary local authority structure is now in place. Greater insight into the performance of the new unitary authorities can be gained in many cases with reference to the analysis of TTWAs. We are constrained in presenting an analysis based on the new structure due to the fact that, in the central belt, the new areas are smaller than a TTWA.
Scottish unemployment stood at 201,270 in April 1996 which represents 8.3% of the workforce. The highest rates are evident in Fife (10.4%), Western Isles (10.3%), Strathclyde (9.7%), Highland (9.6%) and Central (9.05) and the lowest in Grampian (4.4%). Shetland Isles (4.4%), Orkney Isles (5%) and Borders (3.7%).
Unadjusted unemployment in Scotland fell by 5,386 or by 2.6% in the year to April. This is largely due to sharper falls in Strathclyde 3.1%), Lothian (-5.2%) and Central (-3.6%). Unemployment change tended to be below the Scottish average in the more rural areas, excepting Shetland Isles (-11.6%) and Western Isles (-11.6%).
The monthly and quarterly changes require to be treated with more circumspection. In the quarter to April, Scottish unemployment fell by 5,557 or by 2.7%. In general, unemployment is down more sharply outside the central belt with small changes evident in Central (-0.4%), Tayside (-0.9%), Lothian (-1.2%) and Strathclyde (-2.1%). However, unemployment in the Shetland isles increased by 18.9%. In the month to April, unemployment growth in the central belt regions outpaced the Scottish average of 1% as did the Shetland Isles.
Table 10 presents the trend in male unemployment in the Scottish LA regions. Scottish male unemployment stood at 154,573 in April 1996. This constitutes 11.4% of the male workforce. Higher than average rates are evident in the Western Isles (14.7%), Strathclyde (13.9%), Highland (13.6%), Fife (13.4%) and Central (12.2%). Male unemployment in Scodand fell by 5,114 or by 3.2% in the year to April. Above average rises are evident in the Western Isles (-13.1%), Orkney Isles (-10.9%), Lothian (-6.4%), Dumfries and Galloway 3.8%) and Strathclyde (-3.4%). Together Strathclyde and Lothian account for circa 80% of the net Scottish fall. Unemployment rose in the Shetland Isles (1256%) and in the Highlands (2.1%). In the recent quarter, Scottish unemployment fell by 5,407 or 3.4%.
Quarterly Economic Commentary
Below average changes are evident in the large central belt areas although unemployment increased in Shetland (17%). In the month to April, unemployment in Scodand rose by 0.7% or 1,079 with unemployment falling in most rural areas and rising in the central belt
Table 11 presents the trend in female jobless. In April 1996, the Scottish female count stood at 46,697 or 4.3% of the female workforce. Above average rates are evident in Fife (6.3%), Dumfries and Galloway (5.8%), Western Isles (5.1%), Highland (3%), Cental (4.8%), Tayside (4.8%) and Strathclyde (4.6%). The lowest rates are found in Shetland (2.7%), Grampian (3.0%), Borders (3.2%) and Lothian (3.3%) and Orkney Isles (3.3%). Scottish female unemployment fell by 272 or 0.6% in the year to April. Unemployment fell in only 5 regions i.e. Orkney (-13.3%), Central (-5.9%), Strathclyde (-1.9%), Grampian (-1.8%) and Lothian (-1%). Elsewhere the female count rose, most sharply in Shetland (+7.3%) and Fife (+5.1%). In the quarter to April, Scottish female unemployment fell by 130 or 0.3%. Again unemployment fell in 5 areas, Orkney (-23.2%), Highlands (-25.1%), Western Isles (-8.7%), Borders (-4.5%) and Tayside (-0.5%). Unemployment rose in the less rural areas. In the month to April, Scottish female unemployment rose by 948 or 2.1%, falling only in Highland and the Orkney Isles. On the mainland, the sharpest rises are found in Central (+9.8%) and Fife (7.1%).
Table 12 sets out the unemployment position in the 66 British regions in the April 1990 - April 1996 period. In terms of total unemployment, Scottish regions occupied 2 of the worst ten positions. Fife ranks sixth and Western Isles eighth. In addition, 7 Scottish regions have unemployment rates above the GB average viz: Fife, Western Isles, Strathclyde, Highland, Central, Tayside and Dumfries and Galloway. In the case of males, Western Isles (6th) and Strathclyde feature in the top 10 areas whilst only Borders, Orkney, Shetland, Lothian and Grampian have rates below the GB average. Fife is the worst of the 66 GB "counties" in terms of female unemployment with a rate 1% times the British average. Dumfries and Galloway rank in 4th place with a relative rate of 1.38. The same regions were below the GB average as for men. The second part of Table 12 highlights the trend in total unemployment in the 1990-93 period. In general, the Scottish regions have higher rankings than before the recession. The exception is Fife whose ranking has slipped from 7th in 1990 to 6th in 1996. Sharp improvements in relative
position are evident in Strathclyde and Central.
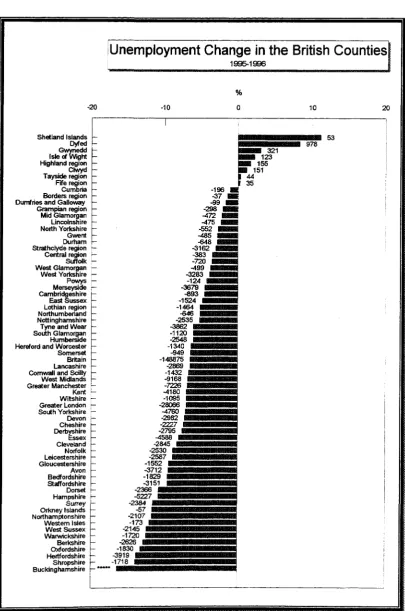
Table 13 sets out unemployment change across the April 1990-April 1996 period. The ranked changes in the 1990-96 and 1995-96 period are presented in Figures 22 and 23, respectively. In the year to April, Scottish counties ranked poorly in terms of unemployment change. Examination of Figure 22 indices on 8 GB counties saw unemployment rise, 4 of these were in Scotland i.e. Shetland, Highlands, Tayside and Fife. Only Orkney performed better than the GB average. Figure 23 sets out the change in the jobless queue in the April 1990-96 period. In this period, unemployment actually fell in 5 counties, 4 of which were in Scotland. Strathclyde experiences the best trend in the claimant count whilst Orkney Isles, Western Isles and Central all posted slight falls. The worst performing region is Grampian whose rise in this period is marginally below the GB average. Despite this, unemployment in many areas of Scotland remains above the British average with the problem more adverse for males.
Table 14 presents details of long term unemployment and young persons unemployment in the GB regions in the April 1990-19% period. In Scotland, there were 62,452 people who had been unemployed for more than 1 year. This represents 31% of the Scottish jobless pool and represents 87.3% of the rate evident in GB. Indeed, only the Western Isles (36.1%) has a higher share of such long term unemployment than the 35.6% national average. The share of 1 year LTU has fallen across the 1990s from 37.4% in 1990 and Scottish regions have tumbled down the GB rankings.
Figure 24-26 set out details of long term unemployment versus unemployment. In general, long term unemployment is higher in areas of higher unemployment However, in 1990, Orkney presented relatively low unemployment and high LTU, whilst Dumfries and Galloway, Central, Fife, Highlands and Western isles posted relative high unemployment with below average LTU. Strathclyde, Lothian and Tayside had both higher relative unemployment and LTU. In the period to April 1993, both unemployment and LTU in the non Scottish counties increased prompting those areas to shoot past the Scottish region in a north easterly direction. Although this has reversed in the period to 1996, Scotland is better placed in both dimensions. In 1996, the position in the English metropolitan counties has become relatively more adverse with Strathclyde and other Scottish areas better relatively placed than before the recession.
Quarterly Economic Commentary
In April 1996, there were 35331 Scots who had been unemployed for 2 or more years. This constitutes 17.6% of the jobless pool and compares favourably with the 19.8% rate evident in GB. Only in Stramclyde (19.9%) and Western Isles (21.9%) is the rate above the British average. As with LTU of 1 year and above, the share is down compared with April 1990 and Scottish regions have tumbled down the GB rankings. There were 54,798 jobless under 25 in April 1996. This represent 27V4% of the total count and is 1.05 times higher than the level posted in GB. Only in Dumfries and Galloway and Highlands and Islands is the share below the GB average.
Table 15 sets out the recent trend in unfilled vacancies at Scottish job centres. Again, this data is not seasonally adjusted. In April 1996, there were 23,009 unfilled vacancies at Scottish job centres which represents 12% of the British total. Strathclyde accounts for 10,942 or 47.6% of the Scottish total. The level of vacancies declined by 313 or 1.3% in Scotland in the year to April 1996. Vacancies continued to rise in our 3 constructed areas, most sharply in the South of England (15V4%). In consequence, Scotland's share of GB vacancies dropped from 13%% to 12%, over the year.
In the year to April, die level of vacancies fell in only 4 areas, ie Lothian (-14%), Fife (-12.1%), Strathclyde (-5.1%) and Highland (-3.3%). The sharpest annual rises were evident in Shetland (27.9%), Grampian (23.7%), Borders (17.6%) and Tayside (16%%). In the quarter to April 1996, Scottish vacancies increased by 2,455 or 11.9%. This compares unfavourably with a 21% rise posted in Britain. All Scottish regions recorded an increase, except Shetland (-40.2%). The sharpest quarterly rises are evident in Highland (46.1%), Borders (29%) and Dumfries and Galloway (24.2%).
Table 16 presents the trend in the U/V ratio in the April 1990-1996 period. In April 1990, Scottish regions accounted for 3 of the highest 10 ratios evident in the 66 GB counties, with a further 3 also in the worst third. At that time, the average ranks of die Scottish regions was 28.1. Scottish regions tumbled down the rankings across the recession. In April 1993, the Scottish regions average rank was 52.3. This has subsequently fallen to stand at 34.6 in April 1996. Currently, there are only 2 Scottish regions with U/V ratios above the British average, ie Fife (128%% of GB) and Western Isles (190%). This compares widi 6 above average regions in April 1990.
Scotland has returned to it's traditional position as an area of relatively high unemployment following a cyclically induced improvement in the first part of the 1990s. However, there continues to be considerable variation in performance with the country clearly split into high and low unemployment regions. At present, 7 of the 12 Scottish regions have high relative unemployment compared with GB. Strathclyde has tended to improve it's position within Scotland on the basis of the criteria discussed above. Fife and, to a lesser extent Highland, have tended to preform poorly in the Scottish context
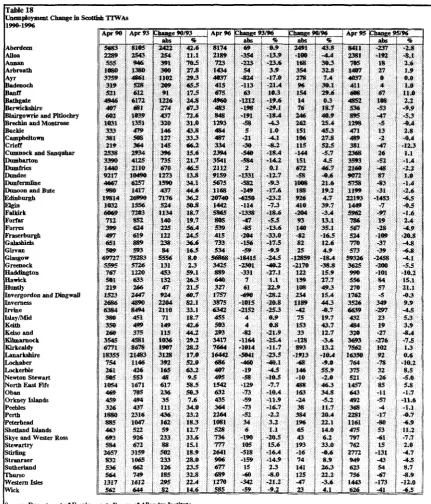
Unemployment Trends in Scottish TTWAs
Table 17 sets out the unemployment position in the Scottish TTWAs between April 1990 and April 1993 and presents the rates, relative rates and rankings for each area. Table 18 presents the trends in jobless across this period. A travel to work area (TTWA)corresponds to a local labour market into and out of which there is little commuting to work. This allows the calculation of unemployment rate, unlike certain of the new unitary authorities. There are 322 TTWAs in Britain and 60 in Scotland.
In April 1996, Cumnock & Sanquhar occupied it's traditional position as the TTWA with the highest unemployment in both Scotland & GB. Forres ranks 3rd worse in GB and 2nd worst in Scotland whilst Arbroath ranks 11th in GB and 3rd in Scotland. However, Scotland continues to present some of the TTWAs with lowest unemployment Scotland's best TTWA in Aberdeen which ranks in 304th place in GB whilst Galashiels ranks 302nd, Orkney 301st and Shetland 294th.
Table 17 further sets out die trend in relative rates and ranks since April 1990. In April 1990, 43 of the 60 Scottish TTWAs had an unemployment rate above the British average. This feD back to 25 in April 1993 before rising to the present total of 32. As with the counties, the general picture is one of Scottish TTWAs slipping down the rankings in the 1990-1993 period and shifting back up thereafter. The most significant improvements in ranking in the 1990-1996 period are evident
in:-Fraserburgh Orkney Isles Greenock Lochaber Stirling Edinburgh Kelso & Jedburgh
Haddington Shetland Islands Peebles
Galashiels Berwickshire Glasgow Ayr Peterhead
It is interesting to note that this is a mix of both urban and rural areas and areas with both high and low unemployment prior to the recession. The following TTWAs have either deteriorated up the rankings are have increased position only modestly. The first 7 have either increased or maintained their position compared with 1990 and are all rural areas.
Buckie Sutherland Forres Huntly
North East Fife Dumfries
Cumnock and Sanquhar Keith
Dunfermline Kirkcaldy
It is interesting to note that the 3 Fife TTWAs have all fared relatively badly in the 1990s, due to the effects of the peace dividend in that area.
Table 18 sets out unemployment change across the April 1990-April 19% period. In the year to April, unemployment fell most sharply in
Forres (-20%%) Crieff (-12V4%) Western Isles (-12%) Orkney Islands (-11.6%) Lochaber (-1CM%) Haddington (-10V4%) Berwickshire (-9.9%) Thurso (-8.9%)
Kelso & Jedburgh (-8.4%) Alloa (-8.1%)
Again, the best performing areas tend to be in rural areas. The worst performing TTWAs in the last year
are:-Hundy (+21.1%) Hawick (+15.1%) Shetland Islands (+8.7%) Banff (+11%)
Inverness (+9.9%)
Sutherland (+8.7%) Lockerbie (+8.5%) North East Fife (+5.8%) Islay and Mid Argyll (+5.3%) Keith (+3.9%)
Again, the poorest performing areas are from outwith the Scottish central belt. In the last year there has clearly been a marked disparity in unemployment change in Scotland's rural areas. with some perfonning extremely well and odiers very poorly.
In the April 1990-1996 period, Scotland has performed well relative to other parts of the UK, in terms of jobless change. However mere is a marked disparity of experience within the country. The areas experiencing the best unemployment trends
are:-Greenock (-38.8%) Glasgow (-18.4%) Fraserburgh (-16.5%) Lanarkshire (-10.4%) Lochaber (-9.0%)
Cumnock & Sanquhar (-5.7%) Orkney Isles (-5.2%)
Alloa (-4.4%) Kilmarnock (-3.6%) Western Isles (-3.6%)
This is a mix of mainly urban and rural areas and the listing indicates why Strathclyde was the best performing Scottish county in this period. It is by no means clear that it is employment growth which has led to this outcome. In Strathclyde and parts within, male and total activity rates have fallen sharply and population declined.
The worst performing Scottish TTWAs in terms of employment change arc mainly rural areas and are as
follows:-Lockerbie (+55.9%) Crieff (+52.5%) Huntly (49.3%) Dumfries (+46.7%) North East Fife (+46.3%) Buckie (+45.3%)
Inverness (44.3%) Aberdeen (+43.8%) Keith (+43.7%) Blairgowrie (40.9%)
This suggests that, although it is less marked than for GB, the early 1990s have seen some
convergence in unemployment across Scotland. In general, the peripheral areas have tended to do less well than the central belt, contributing to a modest change in the geography of Scottish unemployment. However, much of central Scotland continues to be characterised by above average joblessness.
Concluding Remarks
The cyclical improvement in Scotland's relative position is beginning to unwind. At present, the Scottish unemployment rate lies above the British average and the recent trend in Scottish unemployment change is more adverse. As set out in previous commentaries, we expect Scottish employment growth to be weak this year but for the trend fall in male participation rates to continue. Our expectation is that unemployment may remain virtually static between 1995 and 1996 with the balance of probabilities suggesting a slight rise. This implies that there will be more months when the adjusted count will rise. We expect a stronger trend in employment in both 1997 and 1998 when the Scottish jobless count ought to rise further. Although Scottish unemployment may remain high relative to GB in the medium term, we do not expect a return to the high relatives evident in the 1980s.
The sharp rise in both male and female jobless in April and in the latest quarter appears to have surprised Scottish Office ministers and officials. Indeed, as part of the overall outrage over the beef export ban, Industry Minister, George Kynoch suggested that the April rise was due to die BSE crisis. The aggregate evidence appears to belie this. Firstly, examination of the onflows and off-flows of claimants indicates that unemployment rose due to weaker than expected off-flows at a time when on-flows were not particularly strong. Secondly, we would expect many workers in the beef and related sectors to be laid off temporarily, at least initially. The trend in temporarily unemployed workers has been falling in 1996 and shows no sign of an upsurge in April.
This is not to suggest that the beef export ban is not and will not have an impact. Indeed, the bulk of the effects of this on the jobless queue may still be in front of us. At present, we suspect that the faltering unemployment trend evident is Scotland and other parts of die country is due to a more universal weakness in the demand for labour.
Unemployment within Scotland continues to be unequally dispersed. Although the central belt has
experienced a relatively good unemployment trend across the 1990s, many TTWAs in that area continue to experience high joblessness relative to GB. However, it would be fair to say that our metropolitan county, Strathclyde, has performed well in terms of the level and duration of unemployment compared with those in England. However, parts of Strathclyde and elsewhere continue to experience unacceptably high levels of unemployment and long term joblessness which require a focused approach by the authorities. It is of little comfort to the jobless in central Scotland that thing are relatively worse in London, Tyneside, Merseyside, South Yorkshire and the West Midlands.
Clearly, programmes like the successful Glasgow Works and the similar approach of the Wyse Group will continue to be required and to attract attention from the south. Both approaches seek to place long term jobless in paid temporary work, with a training element, and to provide assistance to participants to secure jobs in the formal economy. All such approaches are demonstrating considerable success in increasing the probability of participants securing a real job. However, there remain too few employment opportunities in Scotland and elsewhere. This can only be tackled by improving the supply side performance of the economy. This is a slow business. In die run in to the General Election, we should be aware that there are no quick fixes to increase the demand for labour in a sustainable way. It will be interesting to see how the political arguments unfold.
Table 1
Scottish and British Unemployment April 1990-96
Unadjusted Time Series
Scotland
Apr 1990 Apr 1991 Apr 1992 lApr 1993 JApr 1994
Apr 1995 pvlay 1995 Jun 1995 Jul 1995 !Aug 1995
Sep 1995 Oct 1995 fSov 1995 toec 1995 (jan 1996 Feb 1996 BVlar 1996
Apr 1996 Male Total
150977 163051 180961 192203 184199
159687 154650 150103 156374 155406 149290 146682 147514 151822 159980 158586 153494 154573
Monthly % change
-1.84 0.87 0.27 -0.39 -0.92
-1.81 -3.15 -2.94 4.18 -0.62 -3.94 -1.75 0.57 2.92 5.37 -0.87 -3.21 0.70
Rate
%
10.8 11.5 12.6 13.8 13.4
11.8 11.4 11.1 11.6 11.5 11.0 10.8 10.9 11.2 11.8 11.7 11.3 11.4
Female Total
54927 53940 56936 57857 53376
46969 44335 43199 53073 53561 46035 43508 43586 43771 46847 46974 45749 46697
Monthly % change
-2.42 0.82 -0.28 0.25 -1.52
-1.74 -5.61 -2.56 22.86 0.92 -14.05
-5.49 0.18 0.42 7.03 0.27 -2.61 2.07
Rate
%
5.1 5.0 5.2 5.2 4.9
4.4 4.1 4.0 4.9 5.0 43 4.0 4.0 4.1 4.3 4.4 4.2 4.3
Persons Total
205904 216991 237897 250060 237575
206656 198985 193302 209447 208967 195325 190190 191180 195593 206827 205560 199243 201270
Monthly % change
-2.00 0.86 0.14 -0.24 -1.05
-1.79 -3.71 -2.86 8.35 -0.23 -6.53 -2.63 0.48 2.35 5.74 -0.61 -3.07 1.02
Rate
%
8.3 8.7 9.4 10.0
9.6
8.5 8.2 7.9 8.6 8.6 8.0 7.8 7.9 8.0 8.5 8.5 8.2 8.3
Change across previous
(month 1079 0.70 948 2.07 2027 1.02 jquarter -5407 -3.38 -150 -0.32 -5557 -2.69 ivear -5114 -3.20 -272 -0.58 -5386 -2.61
Great Britain
Apr Apr Apr Apr Apr
Apr May Jun Jul Aug Sep Oct Nov Dec Jan Feb Mar Apr
Chan 1990 1991 1992 1993 1994
1995 1995 1995 1995 1995 1995 1995 1995 1995 1996 1996 1996 1996
ge acr
month quarter year
Male Total
1124500 1592100 2019095 2222986 2024328
1746459 1698429 1661808 1689358 1684734 1655222 1609778 1604524 1640699 1698353 1693270 1640528 1628627
jss previous
-11901 -69726 -117832
Monthly % change
-1.32 2.83 1.24 0.08 -1.69
-1.24 -2.75 -2.16 1.66 -0.27 -1.75 -2.75 -0.33 2.25 3.51 -0.30 -3.11 -0.73
-0.73 -4.11 -6.75
Rate
%
7.0 10.0 12.8 14.3 13.2
11.5 11.1 10.9 11.1 11.0 10.9 10.6 10.5 10.8 11.1 11.1 10.8 10.7
Female Total
404193 507345 613004 672189 611723
540788 518200 507220 554899 573461 546924 517020 507367 503388 525854 523952 505841 509745
3904 -16109 -31043
Monthly % change
-1.27 2.37 0.66 0.40 -1.30
-0.01 -4.18 -2.12 9.40 3.35 -4.63 -5.47 -1.87 -0.78 4.46 -0.36 -3.46 0.77
0.77 -3.06 -5.74
Rate
%
3.4 4.3 5.1 5.6 5.1
4.5 4.3 4.2 4.6 4.8 4.6 4.3 4.2 4.2 4.4 4.4 4.2 4.2
Persons Total
1528693 2099445 2632099 2895175 2636051
2287247 2216629 2169028 2244257 2258195 2202146 2126798 2111891 2144087 2224207 2217222 2146369 2138372
-7997 -85835 -148875
Monthly % change
-1.31 2.72 1.10 0.15 -1.60
-0.95 -3.09 -2.15 3.47 0.62 -2.48 -3.42 -4.70 1.52 3.74 -0.31 -3.20 -0.37
-0.37 -3.86 -6.51
Rate
%
5.5 7.6 9.5 10.5
9.6
8.4 8.1 8.0 8.2 8.3 8.1 7.8 7.8 7.9 8.2 8.1 7.9 7.8
Table 2
Scottish and British Unemployment April 1990-96
Seasonally Adjusted Series
Scotland
jApr Apr Apr Apr Apr
Apr May Jun Jul Aug Sep Oct Nov Dec Jan Feb Mar Apr
1990 1991 1992 1993 1994
1995 1995 1995 1995 1995 1995 1995 1995 1995 1996 1996 1996 1996
Change acn
month quarter year
Male Total
249000 161200 178600 189400 181400
156800 155100 153000 152700 151500 150400 150300 150000 150900 149500 151000 150200 151600
ws previous
1400 2100 -5200
Monthly % change
-0.80 1.83 0.90 0.21 -0.49
-1.38 -1.08 -1.35 -0.20 -0.79 -0.73 -0.07 -0.20 0.60 -0.93 1.00 -0.53
0.93
0.93 1.40 -3.32
Rate
%
10.7 11.4 12.5 13.6 13.2
11.6 11.5 11.3 11.3 11.2 U . I 11.1 U . I 11.1 11.0 11.2 11.1 11.2
Female Total
55100 53900 56300 56900 52500
45900 45500 45200 46000 46000 45300 45200 45000 44700 44100 44300 44800 45800
1000 1700 -100
Monthly % change
-«.90 2.08 0.54 0.89 -0.94
-1.50 -0.87 •0.66 1.77 0.00 -1.52 -0.22 -0.44 -0.67 -1.34 0.45 1.13 2.23
2.23 3.85 -0.22
Rate
%
5.1 5.0 5.1 5.1 4.8
4.3 4.2 4.2 4.3 4 3 4.2 4.2 4.2 4.1 4.1 4.1 4.2 4.2
Persons Total
204100 215100 234900 246300 233900
202700 200600 198200 198700 197500 195700 195500 195000 195600 193600 195300 195000 197400
2400 3800 -5300
Monthly % change
-0.83 1.89 0.82 0.37 -0.59
-1.41 -1.04 -1.20 0.25 -0.60 -0.91 -0.10 -0.26 0 3 1 -1.02
0.88 -0.15
1.23
1.23 1.96 -2.61
Rate |
' %
8.3 ! 8.6 i 9.3 : : 9.8 ! 9.5 !
' 8 . 3 1 : 8 . 2 :
8.1 ! $.2 | 8.1 : 8.0 i 8.o ; . 8.0 i
8.0 1
S.O 8.0 8.0 8.1
Great Britain
Apr Apr Apr Apr Apr
Apr May Jun Jul Aug Sep Oct Nov Dec Jan Feb Mar Apr
1990 1991 1992 1993 1994
1995 1995 1995 1995 1995 1995 1995 1995 1995 1996 1996 1996 1996
Change acn
month quarter year
Male Total
1095100 1561000 1983400 2183700 1986300
1709300 1700600 1695300 1691300 1676700 1659600 1657100 1641500 1636900 1614000 1620300 1599900 1594200
>ss previous
-5700 -19800 -115100
Monthly % change
-0.48 3.45 1.56 0.30 -1.49
-1.03 -0.51 -0.31 -0.24 -0.86 -1.02 -0.15 -0.94 -0.28 -1.40 0.39 -1.26 -0.36
-0.36 -1.23 -6.73
Rate
%
6.8 9.8 12.6 14.0 12.9
11.2 11.2 11.1 11.1 11.0 10.9 10.9 10.8 10.7 10.6 10.6 10.5 10.5
Female Total
402500 504800 607400 664400 604400
533800 531400 530200 531400 526200 517900 521100 516700 512300 507000 506200 501500 503300
1800 -3700 -30500
Monthly % change
-0.15 3.10 0.95 0.48 -1.37
-0.22 -0.45 -0.23 0.23 -0.98 -1.58 0.62 -0.84 -0.85 -1.03 -0.16 -0.93 0.36
0.36 -0.73 -5.71
Rate
%
3.4 4.2 5.1 5.6 5.0
4.4 4.4 4.4 4.4 4.4 4.3 4 3 4 3 4 3 4.2 4.2 4.2 4.2
Persons Total
1497600 2065800 2590800 2848100 2590700
2243100 2232000 2225500 2222700 2202900 2177500 2178200 2158200 2149200 2121000 2126500 2101400 2097500
-3900 -23500 -145600
! Monthly | % change i -0.39 ! 3.36
1.42 • 0.35 : -1.46
! -0.84 ! -0.49 ! -0.29 j -0.13 ! -0.89 i -1.15 i 0.03 1 -0.92 ! -0.42 i -1.31 j 0.26 ! -1.18 | -0.19
-0.19 -1.11 -6.49
! Rate)
%
5.3 7.4 9.4 10.4
9.5 i
8.2 8.2 j 8.2 ; 8.2 ' 8.1 8.0 8.0 7.9 7.9 7.8 7.8 7.7 7.7
s
p
O .
<
L. £1
a, a
22*522221:2!^
225
* * * * * ;
1-1
isg=ssm§§
:-::Se:J>0::m::: JJCIKWJOJ-:-T-saDf.ms*"-:: JOB :•»:>« J• « j a o
'^M-ff&m w:M^$m<* i;
: : t f l : : \ e ::: y i ::. : I - i : i
:o;::o.::g::0::o,;o::o;
? s 5 ? ? : ? s * ? 2 S s * ~
™&&Mm -MM: SsSSsS::
* p :;S * e t : - < o : ::f < ; « J O V - o * * * • ! » JOT .:••
= >;S:: *>i*l'»V: :•» :»1 ^»-: r r i O : «S : •
ill 1*
< * : ; 0: >-« :T« J H * * :«Q: **>rvJSO:J9vj: <«J:iiB:J«S; i J ; « : : « J o *S:5iS5a5J;os";j TOSWfWJWpJW J * * J * » ' *jlj:«r*:-»-t::r<.j;
O S O O O O O O O O
g.•: :9K JS • « : « * » '"tS. :•»: P t » « :
» : W : 2 * « : « : • • * O * : » : « 0 : SO;:.:
: W &i :f*V :
Jl«!Jlie--:!*.:
r> - -
II
WSj-flJ * ^ J I > •:• , :rr: W 3 9 c ••*•> i
sNJ;oeJ3:os:5 ^ S S ^ S * ; - : 3 ; » '
M & M t e M § ^
i - < - * « * • » .« O T - - r .
SI2
o - o?3^SSS33HS3:
MS:
••an 7Tv o r r c e ~r,
r-gi2Ir=?2?
?8S
: * « JOBlllllilllll III
>-<::a0s v ge: ' i n • «o- ae; m * r ^ r : ~ r r .~* <« V ) OV « t> \ »> 00 JOB :*2 O0 JOB.
SBJOOJO&.J .|>::W.06-:
"Jt» aol ' > f * j ' t > |
liilllfllil 111
CC " "
elk
enB ~ C
<~ 5 S
Jii-
s i
a ^ > 7 >
iiiiii
s
ill
s
ta
i
ea
t
u
•3
B1
3
itc
d
B
M E
a si
U
Vlonthl
y
1
m o\ u «
§
Chang
e
Quarterl
y
#
Wi
\ 9
Ja
n
o
han
g
3
yea
r c
a
<
ang
e
i f b I S ; B B •«c
*
.a
*?
Ui
(/) • O
«
#
VI
V )
<
VO
-<
g
u
V I £
«
• . • •
<**•«•;«
:^!*?:i
l l l l l l l
O : : , _ o: Sss
1111
!<***<* *5Ir-o ? : ^ ^
:;:::•::.:
O ; O ! 0 o o o t > : « r > : ; : p <
:r-r; # • * ; * *
ov-soim 0 - : » - t:: > H : 1 . . : ,:::;. I \
l l l l l l l
:>: :._ o o
:»:!»'>»** v e o o w c i
<?-?*?•?
1
i ~
**•»
r-i-o o :
« • • ;
» ! I O , t»v
t - 1
li
O -e : " - " • i >-l::n >« ° M•-!'< » = t
o -e : *"~ n ** ? <N ; c<
II
- * w 1 . <*S
II!
:
111
II!
^8i ^
i f f *
111
r^r'""*w » : W 3
<?<?<?
Ill
••.-.• • • : • •
r> « m
* « • : «
H : ^ : r l
o o o
o o o
n n «
o r v v r )
«:"«:•«
M : H H
&s
III
o l o oo o o
n v f i <-< o f > w V O F - VO
t o o " !
s « s
o l o o o o o *s - « « t - tr, M •>» o m
o o : : i :' -1
O O O O 1-4 l > N i » t 0 6 «
m »
-°:T
n
o o o o * - V > V O W O O i - * » H * - <
• * r * t - f r?t
C O o o o «
K *
o o o o « T T V O * * w n <M - «
ve ve
'
o o o o
as oe o\ —(
(- -* l-< T t
o o o o <-< n VO - H 0 0 — ' -* —«
« : ; o:
o O
: 0 O
:ao
o r*
o o
o o
£
9°-1
:
:o:
o M • © • ;S
•» :-: ;..!;
: :
O - O :
tn •9c-•G
:r>VO » H
© O
i
o ^ r t ^
: 0 O t -O *
1
>e M
o o T
m&\
oi ^ »
c j
: 0 l-H
o o t ~
9 0
1/) * H
o 3 i—( 0 0
s
1
o o ao >e U I
<1
-O o VO
•o
M
m
• .:: » : 0 o o * * CNl : : : < • : • • • »
j :
';• •..
1
o:
o T T
:;S:R;«::
^ ;«:^
«:» 0 0
«»•
III
;;: ;:: o: o
o o ' W C <
:*T:SO :J~:fn : « : r n
t S T T o «
<?<?
11
T « ! » > • • « •
O O o o
m «
« : > C i » v o Cv 'V
22
11
o o o o o n 3 0 : « •-» <o T~ nn " .
• » S
o o o o o o • » « 1 «n r r . ,
« « ? •
1
t
»>< <r»
o o f O •a-0 •a-0 <o
5
1
o o o 0 0 1 -* T^-^
a.
o « »
o \ m l « w \ o m
9 .
• »
•^
: O O l
: • : , * • : »
' • 0 ^:' O l
:t >: w»; 1 " 1
'' O O ' O O .. 9 • « ' . • • B C < «
m so.:
p < < *
: 0:O ! O O : . . 0 0 « : • • • • O l i - O i
O O o o :•: • « : O i
:*•* 0 0 1
ve set • * • < • • » - » : o ve^ t - *e
i i
o = o o m ^,
: 0 O ^ W> >©"
1 4
*~4 — I f .
^^;
o o o o t» «
ao vei
: . f ; V O VO VO!
I •
o o
in r~
' ' o is; o <s; <»> « : o\ o& o I - : t -
«--1 ~:
in so; © O l
O O O O l « 0 0 !
ev vo in vo
bllM.
iiiliiSHl
B « B E a E
^ ^ £
5 * 1
ho
f
and
s
ho
f
3=5 C
5 1 1
£ £ ^ 3 S? .a 5
! i S.-E
Monthl
y
Chang
e
1
^
V I
a
Ma
r
9
5
Quarterl
y
Chang
e
<S
V J a
Ja
n
9
5
3
yea
r
chang
e
Ap
r
9
3
s
Annua
l C
I
#
5 ^
3?
eS
«5
*
5*3 M
Ap
r
9
5
| Ap
r
9
6
V J
eg
^ : - ^ ^ : : « : i ^ : *;: * : ^ s « : * > ; * * i ::
0 ::: © : © : : o;' © '; :.:: .;.:::o" "i±a;::<Es':0::2:::
e « e 3 : e : e:e S S e #
» J : © i « J © « O i 0 ? © i « ? © * O S o S ^ o o o o o o o o o o SO:-00-:«:»< rt : » • : * « O f OBiAOiOOS
«|;H»1: t V i O C i a C i : : «:« : <*)::OeJm : ^ K "
*?:• ?? •«? '"?: r?' :*f;«;°5 « « ; : « : :
S s o ' 2 i o ? o : o x S »; ;fe;o: :2-; ; S s o K:O S O : :o::S:o: :2:2::o;;
=> o o o :s o o o s» o o 9 : 0 : s « : e t i « e : « i e : e « o=
SVTS1 C%: V? :O0: © : OO: ^ T * »: ?**:>-* v
" * : • » : OS,)«N : » : ; • » : ' » : f * : O e : TO! » * . j-^:r*;oy<ry:w ::<n::'»: **> ; « * «*:;»w «.;:<cs«<: •»•:** :cs :©;: p j :oe: ^ s * n ;; *<*:>*1 ' O i * " • : « S t * . 3 0 Y « : " < * it?*;**!?'!
**): « S : C * * * T * - d ' ^ * «::»-*: I P * : - ^ * •
«>: 2.: >N « \ f ) : S W O : S- &• -r*•
!; ;;:.;;::,:; ;.«;;::.;.. .;::; ;:.; -,;;.;
p j : ;oo; T-t" T T •** ;*•* : «:; w t •;»•><::<-•• ->•»:.
j r j Srsaes; y j ; >o ;in •jyyJWJ-iwi; Wr-in;' ;i
2 O 2 O O O O O C5 :0: : 0:
S : ©• J-J O l O : 0 > e O :«S 0 - - 0 ..
S: :*"!: S : T;::f< i«::>0 :T*::Tj" t^VOf:
O O : O O ' O ' © O O _ , - . _
^ : ; 0 ^ ^ 0 ^ 9 O- O- O 2 2 2
t - :rt :>« p» m , rt: <S t»5 «, V I I : t + i i t i |
o o 2 <= o s : o o :«s : o o O 55 g O O ' : O O © © © i ©
(Ti :^N J » O : f > : VJ- * H 0 \ -^4 t^i 8^,.
OP ^H » ^ - : m f O ^ V I C I M T»
f ^ f ^ «/> f^: Tf ^ * " ^ T t ^ -if T»
© © © © © © © © © © ©
© © © © © © © ©: O O ©
O- r - "ft T-<: O - ^ ON « : ^ » « © 00
: ; ; . ; . , : • : • , : : . :
-wmtm
m
:
ll;
E 1 1 * :
:
§k
Bm
^m
m
fii
152
22430
0
10560
0
12750
0
•-••-•••irtxr ;:-:-S»:;«
- © o • S O : © : ;:«-H: | M H O : ; 0 s s i o : . - » * S O :: O ' : « :;W)K10
::K*-; SO
J O O
.;. . y l . ; *
?:o;:o i O S O
: v . : l " : - - l
:: • « - o
: : 0 i : 0 \ •:-t^ i n
.-::,-0;«
o o
' in;;iin
: « ; l d
• • • « ' - 0 0
i « : :0M -.. .j : sin :ini .. j : O © ^ . © : O l
m:oo •• - o - - o
53380
0
55350
0
50330
0
52270
0
td £ 3 o V 2
^ - 1 c C/]
0>
.5 on CM cs a; ^J
I
1 C!o -:
ill!
^ i -1 * & s
IillIIl!
1
Table 6
Vacancies in British Regions: 1990-1996 Seasonally Adjusted __ __ _ ^= = =_
Rest of South East East Anglia London South West West Midlands East Midlands Yorks & Humb North West Northern Region Wales
Scotland
South of England Midlands & Wales North of England
Great Britain United Kingdom
Apr 90 Total 38900 6400 18000 16200 16800 11200 12900 22900 12300 13100 22500
79500 41100 48100
191100 195800
shr 20.4 3.3 9.4 8.5 8.8 5.9 6.8 12.0
6.4 6.9 11.8
41.6 21.5 25.2
100.0 102.5
Apr 93 Total 21200 4000 9800 8900 8500 8600 9600 15400
5800 9100 18300
43900 26200 30800
119200 123700
shr 17.8 3.4 8.2 7.5 7.1 7.2 8.1 12.9
4.9 7.6 15.4
36.8 22.0 25.8
100.0 103.8
Apr 95 Total 32000 6300 16400 13700 15400 12700 13400 206(H) 7900 13100 22800
68400 41200 41900
174300 181700
shr 18.4 3.6 9.4 7.9 8.8 7.3 7.7 11.8
4.5 7.5 13.1
39.2 23.6 24.0
100.0 104.2
Jan 96 Total 31600 6200 18400 15500 16000 12500 13800 21300 7900 13400 23500
71700 41900 43000
180100 187300
Tabl
e
7
Vacanc
y
Trend
: 1990-9
6
Seasonall
y
Adjuste
d
Qr
t Chang
e #
a
OS
s ea
1-9
Chang
e
95/9
6 &
Ul eg
o\ u
Q .
<
Chang
e 93/9
6
Chang
e 90/9
3
e£
<n
es
£
es
S
-a .
Chang
e
90/9
6 £
es
o o\
M
<
SO ON M a.
-<
:*sst;sxp^;; ^:;:d^«itt;;:c»5p-: imi *SsMi?*»ig
: ^ s * * 2 s 2 l o S : o;: 2 : : o s : o :;; 2 : 2 S : :
iiliiiiiiiii
S i ^ S a S ; & i S ; : & ! ^ e s i ^ S i S b i s
o g o o o o o o g o o
s o i S T : « o •! o ; :: m a w J W 2 : : * ; : « « : .;.;
T—; : « J O B ::«n: :\o?: i s : : « : » ~ i ; S - * « : • < * > J;
•*H::??:: —* .;*»i s ^ S ; * - * - * * ::* 5 » ; ~:? » • * > < * •:;
S o * s » ? £ & ^ i « e: ; ;* r ' ; | Si : ' : « * :<fis«6:: ® : : ;
i:i|::i;#:;i':i;|i;||il|;|;
;<s» :.«;S*eisieS id:*©: :»:; l i t i d : : 0 i::
:0': 2^::.0-.p:-O::P^©: 2:0: :0:;;:
:**J : o s ^;: o ^ : : ; * s ^ : : m : s^:::o5::::>^:;\6:;;
i-4. d " : 2 2 : o s * • * : *•* so «»l i f f i - M j ^ ••:::
:,|P:**>•'-'S:°° : o*:" > : • • • • * • : • » • • : « • : ' * *<«::::
2 : d : : 2 : d f : d ; d : d • : :d:-:d::o:: d>:: g o g o o o o o o o © S;: **: S : :0* ' :1^ : ::^,;::*n.: ;* K : « * * '?!* s::
:juii SM5?Si> •>** jsife ^i:*?-*::va0i*o:;(i^.;:;:
i n ^:::i»::^::<x'(rj.;:»(5::p>i: :i$:OBa6;
5-:•»;. Vp- *f *t Tf rf*f: W> :W)-;;«p: TJ<;.
2 : < i : : o ; o : o : o :;o^ O: ::o: o : :d::
Si»>:©i:»:« ! O O": fflKOiO O
:K.*:::«:>W::W-W;«!*»:»:«:'
2 ' • . » ' e>: O: -<2> » o; 2 d d- 2:
S - o - o : : o : : 0 • o : o 8 : o © 2 3 0 0 5 ©swv so so S:::ao::r^::JS: £ j s " * ON:• •«*::op:-oo: : o s:: g w : ©s -Jg:•
^
0lt?:f;fs;f
:f
:-s
;0 •,— :o:0: 0;0 0 0 : 0 i d <s>:
• 0 > " ' 2 • • O : - - 0 : O : . : 0 : 0 - O : O i © I O o \ : S : o < - . e * ' 0 0 : «S: o \ : : o s : ci.-.-<-< m : •
0 0 S co *0: '•o T-< N M : m m P «
0 — . < o 0 0 < o 0 d —, d 0
o 2 : o : o 0 : 0 0 o g e o
r * 2 • « • o s ^ 0 0 S S N O O
T T S * H ' : \ 0 SO r f l t f ) :CM S fi C<
Res
t o
f Sout
h
Eas
t
Eas
t Angli
a
Londo
n
Sout
h
Wes
t
Wes
t Midland
s
Eas
t Midland
s
York
s &
Hum
b
Nort
h
Wes
t
Norther
n
Regio
n
Wale
s
Scotlan
d
•l^iiiS:;:?
mmm
l i l l l l
III
:::::d:::d:d:::2 < = > 0
• * « S OS
::::^::::vo::Trj::;;
::::Ov:;«4^\et::;;
';:»^::>©::?*:;::
• : : © . - : 5 : ::0: :
0 f t s • r , s o • «
H:«>::Wi::!d:P
:;;:i*isoi:\o;::
. d > : d : i « :
: ; ' : o;d ; - : o v
: : o O H O :
: - o s «>* 0 0
• " •: :J » - » 0:i O ' -:
: HflO ::Sg>:::^*;:;
;:2'2;:;S;;
: SO »«> S * : :
: o : o d > o:o , ^ :
:W1 *-< :»H' :
.- :OS' "P^ :G©::
:•»-• T f : ^ : .
7890
0
4260
0
4500
0
Sout
h
o
f Englan
d
Midland
s &
Wale
s
Nort
h
o
f Englan
d
::;::-*K:-»
ills
: B W i : : * l
ss
;:s:SI52';:-*t:::ri
o c 0 0 • i . i o s d
:;'i:0::.:e>
;.i*-lS:0e> : * & • • &
i:;d>-d
mm
::::1r<:::»,!,^
::::;:o\:i;iK
;.::«C:::00
•V:V>"iW>
;.;:d:id
" « s O
. • - • • • * : - « o
:i::%:soo :;;:ic^::;;so
i«m
..O : d
: 0 <S>
: 0 \:r H
:':•"!*': «SI
::':*?::'??
: d i d
O S O
: o s : «
: •»-f^«4
. • • » H > * I
:i:2::b:
• 0;< 3 l
: © i © : " H s o s ::Os:.Os
, : : T H : : T H
18940
0
19650
0
Grea
t Britai
n
Unite
d
Kingdo
![Regional review [March 1998]](data:image/gif;base64,R0lGODlhAQABAIAAAP///wAAACH5BAEAAAAALAAAAAABAAEAAAICRAEAOw==)