This is a repository copy of
Dynamic ice stream retreat in the central sector of the last
British-Irish ice sheet
.
White Rose Research Online URL for this paper:
http://eprints.whiterose.ac.uk/151912/
Version: Published Version
Article:
Davies, B., Livingstone, S. orcid.org/0000-0002-7240-5037, Roberts, D. et al. (3 more
authors) (2019) Dynamic ice stream retreat in the central sector of the last British-Irish ice
sheet. Quaternary Science Reviews, 225. ISSN 0277-3791
https://doi.org/10.1016/j.quascirev.2019.105989
[email protected]
https://eprints.whiterose.ac.uk/
Reuse
This article is distributed under the terms of the Creative Commons Attribution-NonCommercial-NoDerivs
(CC BY-NC-ND) licence. This licence only allows you to download this work and share it with others as long
as you credit the authors, but you can’t change the article in any way or use it commercially. More
information and the full terms of the licence here: https://creativecommons.org/licenses/
Takedown
If you consider content in White Rose Research Online to be in breach of UK law, please notify us by
Dynamic ice stream retreat in the central sector of the last British-Irish
Ice Sheet
B.J. Davies
a,*, S.J. Livingstone
b, D.H. Roberts
c, D.J.A. Evans
c, D.M. Gheorghiu
d,
C.
O Cofaigh
caCentre for Quaternary Research, Department of Geography, Royal Holloway University of London, Egham, Surrey, TW20 0EX, UK bDepartment of Geography, University of Sheffield, Sheffield, S10 2TN, UK
cDepartment of Geography, Durham University, Science Laboratories, South Road, Durham, DH1 3LE, UK dNERC Cosmogenic Isotope Analysis Facility, SUERC, Rankine Avenue, East Kilbride, G75 0QF, UK
a r t i c l e
i n f o
Article history:
Received 4 June 2019 Received in revised form 1 September 2019 Accepted 3 October 2019 Available online xxx
Keywords:
Quaternary Glaciation Western Europe Geomorphology Glacial
Cosmogenic isotopes
a b s t r a c t
During the Last Glacial Maximum (LGM), ice streams of the last British-Irish Ice Sheet (BIIS) controlled ice discharge from various dispersal centres. Deglaciation was characterised by shifts in ice-divide location and changes in internal ice-sheet dynamics, resulting in substantialflow switches and significant ice-stream reconfiguration, and hence modification of their landform signatures. We present new geomorphological mapping and 1110Be cosmogenic nuclide ages from Northern England (Stainmore Gap, Eden Valley and Vale of York), that constrain regional dynamic ice-stream retreat following the LGM. We identify complex decoupling of competing ice lobes, characterised by early retreat of the North Sea Lobe and a minor re-advance of Stainmore ice prior to ~20 ka. This was followed by rapid recession of the central Stainmore Gap, which was ice-free by 19.8±0.7 to 18.0±0.5 ka, contemporaneous with the recession of the Tyne Gap Ice Stream. In the southern Vale of Eden, Crossby Ravensworth Fell became exposed between 19.2 and 20.3 ka. The northwards ice-flow reversal in the Vale of Eden was associated with the development of ice domes across the northern Pennines, Howgill Fells and the Lake District. This shift in dispersal centres and ice divide migration likely triggered the rapid collapse of eastward ice stream corridors. The central sector of the BIIS rapidly collapsed back up into upland dispersal centres between 20 and 17.5 ka. This work highlights the role internal factors, such as topography, in driving ice-divide migration andflow switches during externally and climatically forced ice-sheet thinning.
©2019 The Authors. Published by Elsevier Ltd. This is an open access article under the CC BY-NC-ND license (http://creativecommons.org/licenses/by-nc-nd/4.0/).
1. Introduction
Ice streams exert an important influence on ice-sheet geometry, mass balance and stability (Bamber et al., 2000;Stokes and Clark, 2001; Bennett, 2003; Rignot et al., 2011). Palaeo ice stream re-constructions provide an important context for assessing recent and future changes in contemporary ice streams, and for investi-gating controls underlying their behaviour (Stokes et al., 2015). The last British-Irish Ice Sheet (BIIS) was drained by ice streams that were dynamically variable through time and space (Hubbard et al., 2009; Evans et al., 2009). These ice streams were sensitive to changes in ice divide location driven by external climatic and oceanographic forcing (Clark et al., 2012;Livingstone et al., 2012).
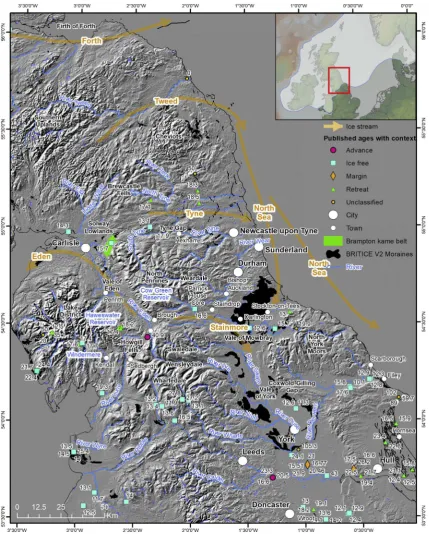
Upland ice dispersal centres such as the Cheviots, Southern Up-lands, Lake District and Pennines (seeFig. 1) played an important role in seeding and modulating iceflow and controlling the major ice stream locations. This is reflected in the geological record, which indicates complex, multi-phase ice flow behaviour and repeated marginal fluctuations of the Stainmore-Eden, Tyne Gap, Tweed, North Sea Lobe and Firth of Forth ice streams (Fig. 1).
Although there is a wealth of geomorphological and sedimen-tological evidence constraining former ice-sheetflow in the central sector of the BIIS during the LGM (Clapperton, 1970;Evans et al., 2009,2018;Livingstone et al., 2008,2010b,2010c,2010d,2010e,
2012,2015;Evans and Thomson, 2010;Stone et al., 2010;Davies et al., 2009, 2011, 2012, 2013; Clark et al., 2012, 2018; Hughes et al., 2014;Boston et al., 2010), the timing and rate of retreat is poorly constrained, particularly through the Eden valley and Stainmore Gap, which routed a major ice stream across the central UK. In the Stainmore valley region, there is only a single basal
*Corresponding author.
E-mail address:[email protected](B.J. Davies).
Contents lists available atScienceDirect
Quaternary Science Reviews
j o u r n a l h o m e p a g e :w w w . e l s e v i e r . c o m / l o c a t e / q u a s c i r e v
https://doi.org/10.1016/j.quascirev.2019.105989
radiocarbon age of 16.6 ka cal. BP from Parrick House in upper Teesdale (Fig. 1) (Innes and Evans, 2017), highlighting the dearth of chronological information in this area. Furthermore, the Vale of Eden purportedly preserves geomorphological evidence of a major reversal of iceflow by 180close to the centre of the ice sheet (Rose
and Letzer, 1977). However, the dating and palaeoglaciological controls on this reorganisation remain poorly understood, thereby
[image:3.595.79.509.63.598.2]limiting our knowledge of ice-ocean-atmosphere interactions and external climatic controls on BIIS behaviour. In addition, the interaction and switch in dominance between the east-coast North Sea Lobe, which penetrated into the Vale of York from the east, and the Eden-Stainmore Ice Stream, whichflowed into the Vale of York from the west, is also poorly understood, due to a lack of detailed geomorphological mapping of moraines and limited direct dating
Fig. 1.Key locations and ice streams (orange arrows) of the central sector of the last British-Irish Ice Sheet. Published ages and geomorphology are shown (Bateman et al., 2015;
of landforms (Fig. 1; cf.Blackburn, 1952;Plater et al., 2000;Clark et al., 2004, 2018; Evans et al., 2005). As a result, the complex interplay between ice stream operation, ice divide and related
ice-flow pathway changes, and the drivers of regionally variable rates of recession, are poorly known, despite this central region being key to our understanding of the dynamics of the BIIS as a whole. A critical question is whether deglaciation of the ice streams draining eastwards from the BIIS into the North Sea Basin (Eden-Stainmore, Tyne, Tweed, Forth) were controlled by external climatic factors, or whether deglaciation was asynchronous and controlled by internal factors such as topography, subglacial conditions such as lubrica-tion and meltwater, and ice-divide migralubrica-tion during thinning. To explore this challenging question, more detail on the timing and nature of ice-stream recession is needed.
This study aims to determine the nature and timing of degla-ciation in the Vale of York, Vale of Mowbray, Eden and Stainmore valleys (Fig. 1), and to relate thesefindings to the regional patterns of BIIS deglaciation. These data provide insights into broader con-trols on changes in palaeo ice-stream dynamics, changing ice di-vides, and shifts in centres of ice dispersal of the last BIIS. We present new geomorphological mapping (focusing on marginal meltwater channels and moraines) and 11 new10Be cosmogenic nuclide ages from the Stainmore Gap and Eden Valley. This facili-tates the dating offlow-sets and ice marginal positions and
pro-vides new temporal constraints on the ice-flow phasing
(synchronicity) of the Eden-Stainmore Ice Stream and the North Sea Lobe.
2. Study area
2.1. Physiography and geology
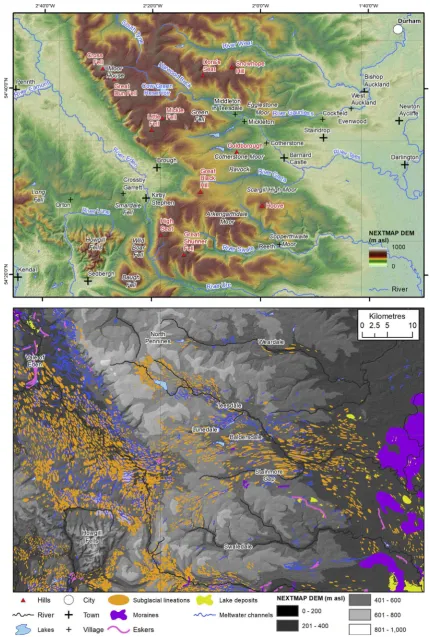
The area covered by the former central sector of the last BIIS has a complex physiography, with three geologically controlled upland regions: the Alston Block (comprising northern Pennines, the Yorkshire Dales and Howgill Fells), the Lake District, the Southern Uplands, the Tyne Gap and the Solway Lowlands (Fig. 1). The Alston Block forms the highest terrain in the north Pennine hills, but several table-like high elevation plateaux occur further south (e.g. Howgill Fells, Wild Boar Fell, Baugh Fell;Fig. 2), reaching heights of over 700 m asl (Evans et al., 2018). The Alston Block comprises Carboniferous rocks, including limestones, shales, sandstone and Millstone Grit and Westphalian Coal Measures, dipping gently eastwards (Johnson, 1995; Aitkenhead et al., 2002; Stone et al., 2010). Regional glacial landforms commonly display strong bedrock control, with streamlined bedforms, valley-side benches,
flat-topped mountain summits and buttes all reflecting thefl at-lying to shallow dipping Carboniferous strata (Evans, 2017). In the northern Pennines and Teesdale, the local bedrock structure has formed an eastward dipping dissected plateau (King, 1976; Mills and Hull, 1976;Evans et al., 2018). West of Middleton-in-Teesdale (Fig. 2), the Teesdale valley is aligned with the Teesdale Fault, and therefore forms a deep incision in the sub-horizontally bedded Carboniferous Limestones. Further south, the Yorkshire Dales also comprise Carboniferous rock, but to the west, the Howgill Fells are of Ordovician and Silurian age, and are predominantly composed of Coniston Grit.
The Tyne Gap and Stainmore Gap are large topographic lows that cut through the upland chain of the Pennine hills. The Tyne Gap constitutes a transection-type valley (cf.Linton, 1962), and was the route-way for an easterlyflowing ice stream during the last glaciation (Livingstone et al., 2015). The glacial signature of the Tyne Gap Ice Stream is strongly influenced by the geological structure, which consists of SSE dipping Carboniferous sedimentary rocks intruded in places by the resistant strata of the Whin Sill
dolerite.
The Stainmore Gap contains a high col at 533 m (Fig. 2) and is dissected by valleys only to the east of the Pennine watershed. It acted as a major conduit of iceflow through the Pennines (Catt, 1991), allowing the Eden-Stainmore Ice Stream toflow eastwards towards Yorkshire and the North Sea (Mitchell and Riley, 2006). Glacial landforms in the valleys include drumlins and subglacial lineations, eskers, meltwater channels and glaciofluvial deposits (Livingstone et al., 2010a;Evans et al., 2018).
Another important area is the Vale of Eden, which is a north-west/southeast trending valley that opens and broadens into the low-lying (<100 m) coastal plain of the Solway Lowlands. It is bounded at its southern, western and eastern margins by the up-land terrains of the Howgill Fells, Lake District and northern Pen-nines respectively. It isfloored by Permo-Triassic rocks, which are predominantly sandstone.
The Vale of York is a broad, low-lying area of gently undulating land in northeast England, constrained between the Jurassic and Cretaceous rocks of the Yorkshire Wolds to the east and the Permian and Carboniferous rocks of the Pennines to the west. It is underlain by Triassic sandstones and mudstones (Straw and Clayton, 1979;Hall et al., 2010). Superficial deposits here include till, glaciofluvial sands and gravels and glaciolacustrine clays, all covered to varying extents and depths by peat and alluvium (Cooper and Burgess, 1993). The Vale of Mowbray sits at the northern end of the Vale of York and is underlain by Triassic and Permian rocks with overlying till and glaciofluvial sediments.
2.2. Regional glacial history
The geomorphic footprint of ice streams in the central sector of the last BIIS has been well documented, with glacial bedforms (largely drumlins) used to generateflowsets to reconstruct iceflow changes through time (Livingstone et al., 2008,2012) (Figs. 2e4).
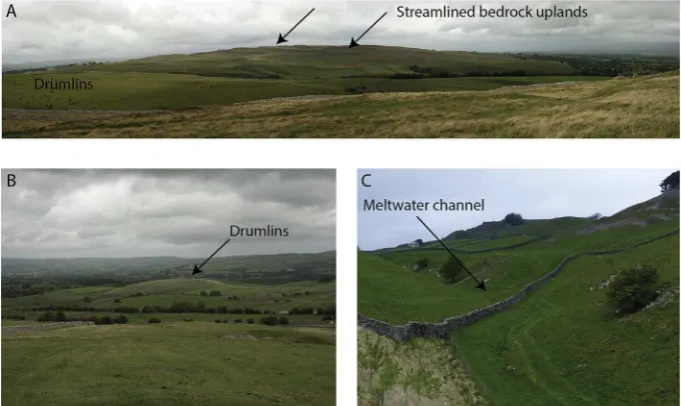
Meltwater channels (Fig. 3c) have been mapped by multiple au-thors (Mills and Hull, 1976; Arthurton and Wadge, 1981;
Greenwood et al., 2007;Hughes, 2008; Livingstone et al., 2008,
2010c;Evans et al., 2018). The meltwater channels of Teesdale re-cord the earliest stages of Stainmore ice downwasting and reces-sion as a partially topographically-confined lobe (Evans et al., 2018). However, few meltwater channels are mapped in the central Stainmore valley, Weardale, Swaledale, Wensleydale, the Vale of Mowbray or the Vale of York.
Iceflow through the Stainmore Gap created drumlins across the
floor of Stainmore (Fig. 3) and deposited the Stainmore Forest Till Formation, which contains local Carboniferous lithologies and Lake District erratics including Shap granite (Stone et al., 2010;McMillan et al., 2011). Flowsets ST1 and 2 and ES1 are associated with the
“Main Glaciation” (23e29 cal ka BP) (Table 1; Livingstone et al.,
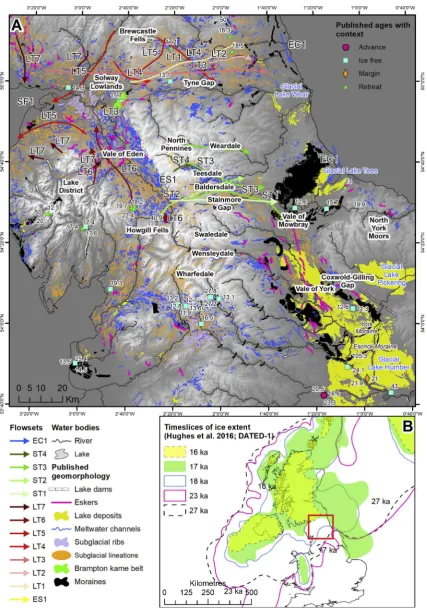
2012). During this time (“Local Last Glacial Maximum” (LLGM; 27 cal ka BP)), iceflowed eastwards across the Pennines, through the Tyne and Stainmore gaps (Fig. 4A), forming the Tyne Ice Stream and Eden-Stainmore Ice Stream (Davies et al., 2009; Livingstone et al., 2008;Evans et al., 2009;Hughes et al., 2016).
The Eden-Stainmore Ice Stream drained into the Vale of York (ST1; Gaunt, 1975; Boulton et al., 1985; Bateman et al., 2015). Together, the 125 km long Vale of York Lobe and the North Sea Lobe dammed Glacial Lake Humber in the Vale of York (Fig. 4) (Edwards, 1937;Dalton, 1941;Gaunt, 1974;Murton et al., 2009;Fairburn and Bateman, 2016;Bateman et al., 2015,2018). Glacial Lake Humber continued to exist until around 13.7±0.4 ka, likely dammed by moraines, with lake levels progressively dropping over the several thousand years prior to complete drainage (Bateman et al., 2015,
2018;Fairburn and Bateman, 2016).
Pickering in the North York Moors (Evans et al., 2017a), which was also dammed by the Vale of York Lobe at the Cotswold-Gilling Gap (Figs. 1 and 4). Glacial Lake Humber formed in the Vale of York (Edwards, 1937;Dalton, 1941;Gaunt, 1974;Fairburn and Bateman, 2016; Bateman et al., 2018), dammed by the North Sea Lobe in the Humber Gap. Glacial Lake Tees formed in the lowlands at the mouth of the River Tees (Plater et al., 2000), and Glacial Lake Wear formed in County Durham (Murton and Murton, 2012) (Fig. 4). Optically Stimulated Luminescence (OSL) ages from Holderness indicate that the western limit of the North Sea Lobe in this area was reached at c. 21.6 ka (Bateman et al., 2018) (Fig. 1). The North Sea Lobe advanced to north Norfolk as early as 30e25 ka, then
underwent a retreat to the north of Dogger Bank at ca. 23 ka, before re-advancing to the Norfolk coast 22e21 ka. Recession of the North
Sea Lobe northwards was accompanied by sporadic marginal os-cillations, but the ice was north of the Tees by 19 ka (Roberts et al., 2018a).
Migration of ice divides back towards upland massifs meant that drainage through the Tyne and Stainmore gaps diminished, resulting inflowsets LT4 down the North Tyne and ST3 to 4 out of Teesdale (Livingstone et al., 2012).10Be cosmogenic exposure ages from the Tyne Gap indicate deglaciation of the Tyne Gap Ice Stream by 18.7 to 17.1 ka (Livingstone et al., 2015). This may be related to the expansion of the Southern Uplands-Scottish Highlands ice divide (Finlayson et al., 2010; Livingstone et al., 2015), and increased topographic focusing of ice flow and thinning during deglaciation (Hughes et al., 2014).
There is prominent streamlining on thefloor of Teesdale, in the Stainmore Gap and in the Lunedale and Baldersdale valleys (Fig. 2) (Clark et al., 2018;Evans et al., 2018). Large glaciers in Teesdale (ST3 and ST4 inFig. 4) and Weardale contributed to easterly regional ice
flow during the last glaciation (Evans et al., 2018), but the ice in these valleys was more topographically confined than the larger ice streams in the Tyne Gap and Eden-Stainmore Gap. The suture zone between Teesdale and Eden-Stainmore ice is delineated by the maximum northern limit of Shap granites carried across from the Lake District by Stainmore ice (Harmer, 1928;Evans et al., 2017b). The “Cockfield Moraine” (near Cockfield; cf. Fig. 2) cross-cuts drumlins created by the Eden-Stainmore Ice Stream (Evans et al., 2018), and represents the southernmost extension of the Teesdale ice margin when it decoupled from Eden-Stainmore ice to the east
and northeast of Barnard Castle.
The geomorphic record of the Vale of Eden supports two sepa-rate flowsets (Fig. 4); an earlier stage with ice converging into Stainmore from the north, west and south, forming a significant ice stream that extended into eastern England and the Vale of York (ST1, ST2), and a later stage dominated by iceflowing northwards down the Vale of Eden into the Solway Lowlands (LT6) (Rose and Letzer, 1977;Mitchell and Riley, 2006). This ice-flow reversal may have occurred due to the development of an ice divide orientated west to east from the Lake District through the Howgill Fells and on to Arkengarthdale Moor (Mitchell, 1994;Mitchell and Riley, 2006;
Mitchell et al., 2010), and resulted in ice draining west towards the Irish Sea Basin (LT5) as a tributary of the Irish Sea Ice Stream (Stone et al., 2010).
The LT6flow phase in the Vale of Eden records thefinal re-advance of ice into the Solway Lowlands, and may have been coeval with the Scottish Re-advance into the northern Solway Lowlands (Livingstone et al., 2010b), although dating constraints are limited. The Scottish Re-advance (SF1;Fig. 4) is thought to have been thefinal incursion of Scottish ice into the Solway Lowlands and Irish Sea (Trotter and Hollingworth, 1932;Huddart et al., 1977;
Livingstone et al., 2010b;Chiverrell et al., 2018). Ages constrain the deglaciation of Cumbria following the Scottish Re-advance to 19.2e18.2 ka (Chiverrell et al., 2018). This phase of ice flow is
associate with the development of the Brampton Kame Belt (Lovell et al., 2019,Figs. 1 and 4), which comprises a substantial
glacio-fluvial depositional zone in the Solway Lowlands. The Brampton Kame Belt includes a series of fragmented SW-NE aligned esker ridges that document recession of the Vale of Eden ice lobe south-eastwards up the Vale of Eden. This was followed byfinal retreat into upland dispersal centres, with a small ice cap in the Lake District (flowset LT7;Fig. 4), and potentially a plateau icefield over the northern Pennines (Evans et al., 2018).
[image:6.595.132.473.67.270.2]Moraines relating to ice sheet recession across the North Pen-nines have not been widely mapped in previous studies (seeClark et al., 2004 andEvans et al., 2005 for reviews). Evidence of the interaction between the North Sea Lobe and Eden-Stainmore Ice Stream is in particular poorly documented, with few moraines recording recession of Stainmore ice from the Vale of Mowbray. The separation of ice in the Vale of York from ice in Swaledale and Wensleydale (Fig. 4) is also poorly constrained. Gaps in
Fig. 4.A. Published geomorphology and ages of the central sector of the British-Irish Ice Sheet. Note the absence of ages and limited mapping, except for glacial lineations, in the Stainmore Gap. Geomorphology taken from the BRITICE V2 database (Clark et al., 2018) and, in Teesdale, fromEvans et al. (2018). Brampton Kame Belt fromLovell et al. (2019). Published ages compiled byHughes et al. (2011,2016)with addition of newly published ages (Wilson et al., 2013a;Livingstone et al., 2015;Bateman et al., 2015,2018). Cosmogenic nuclide ages have been recalculated according to the protocols of this paper (Methods). Flowsets are fromLivingstone et al. (2008,2012). Flowsets are arranged oldest at the bottom (e.g. LT1) to youngest at the top (e.g. LT7). Eightflow phases are identified within the Lake District-Tyne Gap region (LT). Fourflow phases are recognised in the Stainmore (ST) region, and one in the East Coast (EC) region. Basemap is hillshaded NEXTMAP DEM. Only major rivers are shown. B. Regional ice-sheet view with timeslices (most credible) from
understanding include: (1) the timing and dynamics of the sepa-ration of the ice masses in the valleys of the Pennines from the North Sea Lobe in the Vale of York and Vale of Mowbray; and (2) the controls on ice divide location that are critical in initiating theflow switch from iceflowing across the Stainmore Gap to iceflowing northwards through the Vale of Eden and into the Solway Lowlands.
3. Methods
3.1. Geomorphological mapping
Geomorphological mapping utilised the 5 m resolution NEXT-Map dataset (https://www.intermap.com/nextmap) for England and Wales (cf.Hall et al., 2010) in a Geographic Information System (GIS), together withfield surveys for ground checking landform interpretations. Key valleys were studied using hillshaded 1 m spatial resolution LiDAR (Light Detection and Ranging) digital sur-face model (DSM) ( https://data.gov.uk/dataset/lidar-composite-dtm-1m1). Data were visualised using two orthogonal hillshades and slope raster images to assist with landform identification and to avoid azimuth bias (cf.Smith and Clark, 2005;Hughes et al., 2010;Hall et al., 2010).
Landforms were identified with reference to published criteria (Evans et al., 2005; Greenwood et al., 2007; Livingstone et al., 2008). As drumlins have already been comprehensively mapped in this region by other researchers (e.g.Mitchell and Riley, 2006;
Livingstone et al., 2008;Hughes et al., 2010;Mitchell et al., 2010;
Livingstone et al., 2010d; Clark et al., 2018; Evans et al., 2018),
mapping focused on meltwater channels and moraines, which have previously been mapped and classified in only localised detail (cf.
Fig. 4).
Initial geomorphic mapping was conducted ‘blind’, without reference to previously mapped geomorphology, to avoid inter-pretive bias. Mapping was then checked against previously pub-lished datasets. The British Geological Survey 1:620,000 Superficial Deposits map (ESRI Shapefile) was used to cross-check identifi ca-tions of sediment accumulaca-tions versus bedrock-controlled highs (DiGMapGB-625).
3.2. 10Be cosmogenic nuclide dating
Cosmogenic dating is widely used in glacial geology (Cockburn and Summerfield, 2004; Ivy-Ochs and Kober, 2007; Balco, 2011;
Darvill, 2013). It can be used to date glacially transported boulders and exposed, eroded bedrock surfaces (Roberts et al., 2009;Corbett et al., 2011). In this study, we targeted samples along the central axis of the Stainmore Gap and across confluences with tributary glaciers. We sampled seven glacially transported boulders and four glacially abraded bedrock surfaces.
Sampling procedures recommended byBalco (2011)were fol-lowed, with erratic boulders sampled from flat upper surfaces, where there was no possibility of the boulder rolling, toppling, or sliding downslope. Bedrock samples were taken from exposed surfaces at the top of cliffs and scarps, where there was abundant regional evidence of glacial erosion. Samples were collected using a rock saw, allowing the removal of intact surface blocks (10104 cm; ca. 3 kg) at least 30 cm from all edges, or hammer
Table 1
Description and location of cosmogenic nuclide samples. Ages were calculated in the CRONUS-Earth online calculators version 2.3 (Balco et al., 2008). Elevation/pressureflag is
[image:8.595.47.557.102.414.2]‘std’.10Be standardisation is NIST_27900.yRefers to stone shape, usingPowers (1953)system for describing edge rounding. Calculated boulder exposure ages are given in Table 2.
Sample Latitude Longitude Elevation (m asl)
Rock type Boulder dimensions (L-W-H) (m) Sample Density Shielding correction
Sample position Surface dip&
direction (mag)
Evidence of glacial erosiony
10Be at/g Qtz Processed
blank ratio
S02 54.48717 2.581499 369 Shap granite 10.7 x 0.8 2.7 0.9916 Upper surface of erratic
302/22 SA-SR, facetted, erratic
97051±2637 4.8510 15
S03 54.4892 2.587767 339 Shap granite 1.61.4 x 0.9
2.7 0.9975 Upperflat surface away from joints and cracks
185/06 SA-SR erratic 119359±3558 4.8510 15
S04 54.4851 2.588967 349 Shap granite 1.11.1 x 1.4
2.7 0.9973 Upper surface of erratic
350/02 SA-SR, facetted, erratic (SR-R on top)
130545±3752 4.8510 15
S05 54.54068 2.006968 313 Carboniferous Sandstone
Bedrock sample
2.6 0.9996 Upper surface of raised bedrock crag
330/08 Streamlined glacial landscape; glacially abraded
92726±2282 4.8510 15
S06 54.54073 2.007834 310 Carboniferous Sandstone
Bedrock sample
2.6 0.7219 Upper surface of raised bedrock crag
116/70 Streamlined glacial landscape; glacially abraded
94448±2330 4.8510 15
S07 54.55463 2.071783 391 Shap granite 1.61.5 x 1.8
2.7 0.9995 Upper surface of erratic
023/03 SA-SR erratic 100467±2334 3.6510 15
S08 54.55473 2.071083 388 Carboniferous Sandstone
Bedrock sample
2.7 0.9999 Flat top of outcrop on Monadnock
346/04 Streamlined glacial landscape
94795±2460 4.8510 15
S09 54.55675 2.075017 337 Shap granite 1.51.0 x 0.5
2.7 0.9995 Upperflat surface of erratic
0/0 SA-SR erratic 115453±2852 3.6510 15
S10 54.63082 1.978683 422 Sandstone, gritstone
1.01.0 x 0.5
2.6 0.9995 Upperflat surface of erratic
040/06 SA-SR erratic; adjacent to large meltwater channel
205999±4336 4.8510 15
S11 54.63012 1.986517 416 Carboniferous Sandstone
Bedrock sample
2.7 0.9999 Centre offl at-topped exposed bedrock crag
068/05 Onset zone of shallow meltwater channel
148065±3213 4.8510 15
S12 54.62812 1.996283 385 Sandstone 11.3 x 0.4 2.7 0.998 Upper surface of erratic
and chisel (max sample depth 2 cm). As previous work has demonstrated that inheritance is rarely an issue in this region (Wilson et al., 2013a,2013b;Livingstone et al., 2015), dual10Be and
26Al isotope analysis was not conducted on the samples. All
sam-ples had their site context, position, altitude, topographic shielding, surface dip and dip direction, dimension, and all surface charac-teristics (e.g. pitted or spalled) recorded. Sites that could harbour snow, vegetation or sediment cover were avoided.
Samples were analysed in the Cosmogenic Isotope Analysis Fa-cility (CIAF) at the Scottish Universities Environmental Research Centre (SUERC) according to standard protocols (Wilson et al., 2008).10Be concentrations are based on 2.7910 11 10Be/Be ratio for NIST S27900. The10Be/Be ratios ranged between 1.2310 13 and 2.7710 13. The processed blank ratio is detailed inTable 1, and was subtracted from the measured ratios. The uncertainty of this correction is included in the stated standard uncertainties.
Exposure ages and internal uncertainties (determined by the error in nuclide concentration) and external uncertainties (includes uncertainties in production rate) (Balco et al., 2008) were calcu-lated using the CRONUS-Earth online calculators version 2.3 (http://hess.ess.washington.edu/math/; Wrapper script: 2.3; Main calculator: 2.1; Constants: 2.3; Muons: 1.1) (Balco et al., 2008). Results using the time-dependent Lal/Stone (Lm) scaling scheme are shown, and we use a reference SLHL production rate of 4.00±0.17 atoms g 1quartz (cf.Fabel et al., 2012). This local pro-duction rate from Loch Lomond ensures compatibility with recently published BRITICE-CHRONO papers (Small and Fabel, 2015;
Livingstone et al., 2015;Small et al., 2017). Results were calculated with a 0 and 0.0001 cm/yr erosion rate. However, at this scale, the differences in ages are within the uncertainties of the age, and so
the 0.0001 cm/yr erosion rate ages are applied. Ages from nearby sites (i.e.Wilson et al., 2013a;Livingstone et al., 2015) were recal-culated according to these protocols to allow direct comparison.
We visualise cosmogenic nuclide ages on probability distribu-tions (e.g., Kelly et al., 2008; Putnam et al., 2010; Balco, 2011;
DeVecchio et al., 2012), where each age is represented with a Gaussian distribution, with mean and standard deviation corre-sponding to each individual measurement. This helps to describe the frequency distribution of the ages and identify outliers. Weighted mean ages of moraines (
m
i±s
i) are calculated by excluding outliers and using the external uncertainties, to facilitate comparison to other published data.4. Geomorphology of the Eden Valley and Stainmore Gap
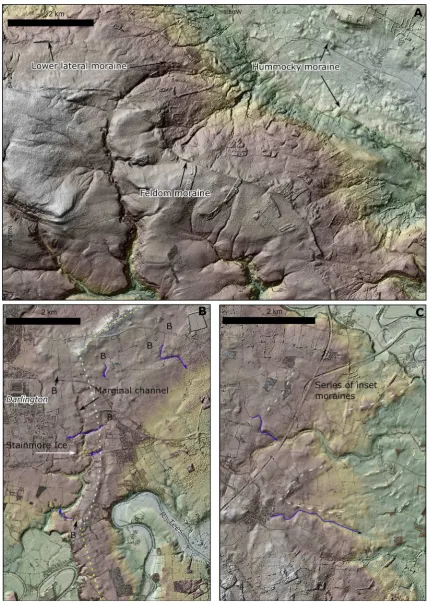
Geomorphological mapping revealed 1561 individual moraine mounds and ridges across the study area (Figs. 5 and 6). Also mapped are 677 new meltwater channels, 81 of which are related to ice-marginal positions. Together, these reveal a detailed and complex pattern of ice-marginal retreat in the Vale of Mowbray, across the Stainmore Gap and in the Vale of Eden (Fig. 5). Moraines and marginal meltwater channels clearly delineate multiple ice margins pertaining to a series of complex ice lobes. Analysis of these landforms, together with previously mapped bedforms (see
Evans et al., 2017b,2018;Clark et al., 2018) allows the identification of synchronous ice margins (Fig. 7).
[image:9.595.34.553.109.406.2]The Vale of Mowbray is characterised by a series of moraines documenting,firstly, the lateral limits of the Vale of York Lobe (VY onFig. 7), and the later separation of Wensleydale, Stainmore and North Sea Lobe ice (Figs. 5, 6b and 6c). This includes numerous
Table 2
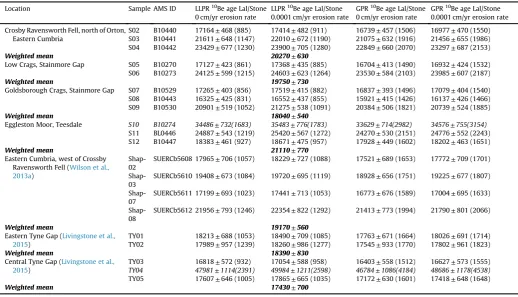
Calculated10Be ages for the 11 new Stainmore cosmogenic nuclide samples and published samples using two different erosion rates and using the Loch Lomond Production
Rate (LLPR). Ages calculated using a Global Production Rate (GPR) are included for comparison. Weighted mean (mi±si) for samples from the same site is calculated using
external uncertainties (in brackets) and the 0.0001 cm/yr erosion rate. Outliers, identified inFig. 9, are indicated in italics and are not included in the weighted mean cal-culations. Sample locations shown inFig. 5.
Location Sample AMS ID LLPR10Be age Lal/Stone
0 cm/yr erosion rate
LLPR10Be age Lal/Stone
0.0001 cm/yr erosion rate
GPR10Be age Lal/Stone
0 cm/yr erosion rate
GPR10Be age Lal/Stone
0.0001 cm/yr erosion rate
Crosby Ravensworth Fell, north of Orton, Eastern Cumbria
S02 B10440 17164±468 (885) 17414±482 (911) 16739±457 (1506) 16977±470 (1550) S03 B10441 21611±648 (1147) 22010±672 (1190) 21075±632 (1916) 21456±655 (1986) S04 B10442 23429±677 (1230) 23900±705 (1280) 22849±660 (2070) 23297±687 (2153)
Weighted mean 20270±630
Low Crags, Stainmore Gap S05 B10270 17127±423 (861) 17368±435 (885) 16704±413 (1490) 16932±424 (1532) S06 B10273 24125±599 (1215) 24603±623 (1264) 23530±584 (2103) 23985±607 (2187)
Weighted mean 19750±730
Goldsborough Crags, Stainmore Gap S07 B10529 17265±403 (856) 17519±415 (882) 16837±393 (1496) 17079±404 (1540) S08 B10443 16325±425 (831) 16552±437 (855) 15921±415 (1426) 16137±426 (1466) S09 B10530 20901±519 (1052) 21275±538 (1091) 20384±506 (1821) 20739±524 (1885)
Weighted mean 18040±540
Eggleston Moor, Teesdale S10 B10274 34486±732(1683) 35483±776(1783) 33629±714(2982) 34576±755(3154)
S11 BL0446 24887±543 (1219) 25420±567 (1272) 24270±530 (2151) 24776±552 (2243) S12 B10447 18383±461 (927) 18671±475 (957) 17928±449 (1602) 18202±463 (1651)
Weighted mean 21110±770
Eastern Cumbria, west of Crossby Ravensworth Fell (Wilson et al., 2013a)
Shap-02
SUERCb5608 17965±706 (1057) 18229±727 (1088) 17521±689 (1653) 17772±709 (1701)
Shap-03
SUERCb5610 19408±673 (1084) 19720±695 (1119) 18928±656 (1751) 19225±677 (1807)
Shap-07
SUERCb5611 17199±693 (1023) 17441±713 (1053) 16773±676 (1589) 17004±695 (1633)
Shap-08
SUERCb5612 21956±793 (1246) 22354±822 (1292) 21413±773 (1994) 21790±801 (2066)
Weighted mean 19170±560
Eastern Tyne Gap (Livingstone et al., 2015)
TY01 18213±688 (1053) 18490±709 (1085) 17763±671 (1664) 18026±691 (1714) TY02 17989±957 (1239) 18260±986 (1277) 17545±933 (1770) 17802±961 (1823)
Weighted mean 18390±830
Central Tyne Gap (Livingstone et al., 2015)
TY03 16818±572 (932) 17054±588 (958) 16403±558 (1512) 16627±573 (1555)
TY04 47981±1114(2391) 49984±1211(2598) 46784±1086(4184) 48686±1178(4538)
TY05 17607±646 (1005) 17865±665 (1035) 17172±630 (1601) 17418±648 (1648)
small moraine mounds and ridges around the middle River Tees, in the western part of the Vale of Mowbray. Although fragmentary and dissected, they show two distinct families of nested, coherent lobate forms, one indicating iceflow from the east coast (VM on
Fig. 7) and one out of the Stainmore Gap (ST). The VM family in-cludes 5 distinct ice-marginal positions in the Vale of Mowbray, the oldest of which extends ~40 km into the lowlands from the present-day coast. The youngest inset moraine position (VM5) cross-cuts older moraines and is orientated more NW-SE along the present-day coastline.
At their western extent, the VM moraines are overprinted and cross-cut by moraines produced by Stainmore ice (Fig. 5b; ST on
Fig. 7), indicating a>5 km re-advance of the Stainmore ice as a piedmont lobe into the Vale of Mowbray lowlands and over the older VM moraines. The Stainmore moraines indicate shifting ice
flow patterns during recession. The oldest moraines (ST1-2) record iceflow southwards into the Vale of York. Later moraines (ST3-5) indicate a more easterly iceflow directly across Stainmore into the Vale of Mowbray. A younger Stainmore moraine (ST6), near Barnard Castle, indicates the influence of Teesdale iceflowing SE into the Stainmore Gap, while the central region comprises a series of discontinuous moraines of glaciotectonically displaced bedrock blocks (Fig. 5d; ST7; seeLivingstone et al., 2017;Evans et al., 2018). In the northern sector of the Stainmore Gap, just south of Middleton in Teesdale, there is a series of inset hummocky moraine mounds (Te onFig. 7;Fig. 5e), which identify terminal positions of the ice margin. This documents the separation of Tees and Stain-more ice and recession of Tees ice back into upper Teesdale (see also
Evans et al., 2018) (Fig. 5).
Like Stainmore, both Swaledale and Wensleydale contain a se-ries of discontinuous moraine ridges and lateral meltwater
channels indicating lobate iceflow subsequent to the recession of the Vale of York Ice Lobe. Again, there is a shift from iceflowing out into the lowlands and turning to the south (W1), followed by more easterlyflow as it recedes (W2-3 and S1).
Parallel and sub-parallel ice-marginal meltwater channels trending SE-NW along theflank of the North Pennines in the Vale of Eden clearly delimit a downwasting lateral ice margin (E1;Fig. 5) (cf.Greenwood et al., 2007;Livingstone et al., 2010c). There is a clear vertical limit, with marginal meltwater channels being limited to below 400 m (Fig. 5). We also map a series of arcuate cross-valley moraines demarcating three ice limits (E2-E3) in the Vale of Eden, and recording thefinal recession of Eden ice. The Penrith Sandstone outcrop, in the centre of the Vale of Eden, appears to have acted as a confining pinning point for the E3 and E4 ice margins (Fig. 5). At the northern end of the Vale of Eden, a receding ice margin is demar-cated by the Brampton Kame Belt, which comprises a series of ridges, mounds, flat-topped hills and depressions (Trotter and Hollingworth, 1932; Huddart, 1981; Livingstone et al., 2010c;
Lovell et al., 2019), and which forms the downstream expression of the subglacial and lateral meltwater channels along the lower slopes of the Pennine escarpment.
Eleven new cosmogenic nuclide samples were collected along a 60 km transect running west to east along the central trunk corridor of Stainmore Gap (Goldsborough and Low Crags), the main tributary glacier of Teesdale (Egglestone Moor) and the Vale of Eden at the onset of the Stainmore Ice Stream (Crosby Ravensworth Fell) (Table 1; Figs. 5e8). Sample ages are presented in Table 3 and
[image:10.595.74.531.63.354.2]graphically inFigs. 7and9. Although there is some scatter, there are sufficient samples to identify outliers (e.g. sample S10) by taking into account the spatial relationships between sample sites. Once outliers are excluded, uncertainty-weighted mean ages are
calculated for each sample site. In this section, we include recal-culated ages fromWilson et al. (2013b)andLivingstone et al. (2015)
for comparison.
Samples S02, S03 and S04 were taken from Shap granite erratics perched on the limestone plateau on Crosby Ravensworth Fell
(350e370 m asl), north of Orton, in eastern Cumbria (Fig. 5;Fig. 8),
[image:12.595.90.515.64.671.2]near to the samples analysed inWilson et al. (2013b)and 7 km from the Shap Granite outcrop. These samples are at the southern edge offlowset LT6 (Fig. 4) and therefore constrain thefinal southwards recession of ice from the Vale of Eden, and the separation of ice
masses into the Lake District to the west and the Yorkshire Dales (cf.
Wilson et al., 2013b). Although the samples show some scatter (between 17.4 and 23.9 ka), they yield a weighted mean age of 20.3±0.6 ka (Table 2). The nearby samples analysed inWilson et al. (2013a)from Eastern Cumbria have a similar weighted mean age of 19.2±0.6 ka (Fig. 9).
Samples S05 and S06 were bedrock samples taken in the centre of the Stainmore Gap from Low Crags (310 m asl), a Carboniferous sandstone crag trending west-east. Low Crags is located in a region of rolling, glacially streamlined terrain within the main W-E orientatedflowset (ST1-2,Fig. 4) of the Stainmore Gap Ice Stream (Fig. 5; Fig. 8). Both samples were taken from a slightly raised (~30 cm above grass) flat, partially abraded and jointed upper bedrock surface and have a weighted mean age of 19.8±0.7 (Table 2).
Goldsborough Crags (samples S07, S08 and S09) is a Carbonif-erous sandstone monadnock within the W-E glacially streamlined Stainmore Gap (Fig. 5;Fig. 8). Samples S07 and S08 were taken as a bedrock-erratic pair from the northern end of the monadnock (390 m asl), with S07 from a large Shap granite erratic boulder standing 1.8 m above ground level and Sample S08 from Carbon-iferous sandstone bedrock. Sample S09 was taken from a well-embedded Shap granite erratic boulder on a gentle slope (10) just to the north of the crags. These samples lie some 41 km east of the Shap Granite outcrop, and delimit recession of iceflowing west to east across the Stainmore Gap. The three samples from Golds-borough Crags have a weighted mean age of 18.0±0.5 (Table 2).
Egglestone Moor is an undulating, rolling, upland surface in upper Teesdale. Three samples were taken (S10eS12) to constrain
the recession of Teesdale ice to the upland Northern Pennines, and are the highest of all the new samples reported here (422 m, 416 m and 385 m asl respectively). Egglestone Moor comprises a thin drift cover over Carboniferous Sandstone and grit. S10 is a well embedded sandstone boulder (Table 1) adjacent to a large shallow meltwater channel. Sample S11 is a bedrock sample of Carbonif-erous Sandstone that stands 1 m above local ground level at the onset of the meltwater channel. Finally, sample S12 is a well-embedded sandstone erratic boulder standing 0.4 m above local ground level. At Eggleston Moor, the highest sample, S10 is sub-stantially older (35.4 ka) than all the other boulders sampled. Given the marginal, upland location of this sample we suggest it was incompletely reset, and is therefore excluded as an outlier. The weighted average age for this site, excluding S10, is 21.1±0.8 ka (Table 2).
The weighted mean of the central Tyne Gap samples from
[image:13.595.38.552.61.391.2]Livingstone et al. (2015; Fig. 1) is 18.4±0.8 ka, similar to Golds-borough and Low Crags from the central Stainmore Gap.Fig. 9H and I shows the variation of10Be cosmogenic nuclide age with elevation and longitude (i.e. the transect along the Stainmore Gap). Ages from this study are compared with nearby published ages (Wilson et al., 2013a; Livingstone et al., 2015), which show consistency with altitude. There is an increase in sample age with altitude, which may be indicative of early thinning and the emergence of nunataks in the area, although it is also possible that the two highest samples
inLivingstone et al. (2015)and in this study have nuclide inheri-tance (potentially because thinner ice is less erosive). We have sampled carefully in this study to avoid issues with likely inheri-tance, and the closer clustering of our samples suggests that this is less of an issue in these samples.
5. Discussion
5.1. The nature and timing of the deglaciation of the Eden-Stainmore Ice Stream
Previous mapping of subglacial bedforms in the Eden-Stainmore region of the BIIS indicates two major flow periods: (1) initial
[image:14.595.132.474.65.570.2]unconstrained west to eastflow of the Eden-Stainmore Ice Stream from the Lake District and Scotland through the Stainmore Gap and into the Vale of York where it coalesced with the Vale of York Ice Lobe (LT1-2); and (2) shut down of the regionally driven Eden-Stainmore Ice Stream, due to aflow reversal in the Vale of Eden northwards into the Solway Lowlands, and subsequent SEflow of the topographically constrained Teesdale Glacier nourished by the North Pennines (Livingstone et al., 2008,2012;Evans et al., 2018). Our new mapping and geochronological data help constrain the decoupling of the Stainmore and North Sea lobes in the Vale of Mowbray, the retreat of the Eden-Stainmore Ice Stream and the northwards switch in iceflow in the Vale of Eden.
5.1.1. Separation of the Stainmore and North Sea lobes in the Vale of Mowbray before 19 ka
Geomorphological data indicate that, at its maximum extent, the Vale of York Lobe may have reached the Lindholme Moraine at
[image:15.595.81.506.64.638.2]Wroot, but it certainly occupied the York and Escrick moraines in the southern Vale of York (Figs. 1 and 4;Bateman et al., 2015;Friend et al., 2016). Drumlins and clast lithological data indicate that the Vale of York Lobe was composed largely of ice from the Tees,
Wensleydale, Swaledale and Stainmore (Friend et al., 2016;
Bateman et al., 2015,2018;Evans et al., 2018;Clark et al., 2018). An initial advance of ice down the Vale of York may have occurred as early as 24.1e23.3 ka with sites at Kelsey and Hemingborough
relating to lake impoundment and pre-dating till emplacement (Bateman et al., 2000). However, the main ice advance to the Yorke
Escrick moraine complex (Fig. 4) (and possibly further south of this, to the Wroot limit) occurred at ~22 ka and is constrained by mul-tiple OSL ages from lake and outwash sediments (Murton et al., 2009;Bateman et al., 2015;Friend et al., 2016). Based on these new geomorphological mapping and deglacial ages (Fig. 7, Table 3), ice then retreated over 60 km back up the Vale of York and west-wards across Stainmore by 19.8 kae18.0 ka (i.e. within the error of
the ages). This is compatible with a suite of deglacial ages from the Wroot limit (19.9e18.9 ka;Bateman et al., 2015) and further north
at Ferrybridge (20.5 ka;Bateman et al., 2008).
In the Vale of Mowbray, extensive inset moraines document oscillatory retreat and competition between ice from both Eden-Stainmore and the North Sea as it separated into constituentflow lobes. Across thefloor of the Tees basin, an upper till with Cheviot erratics (e.g. at Catterick and Scorton) indicates westward incursion of the North Sea Lobe almost to the easternflanks of the northern Pennines (Mitchell et al., 2010), although there is also clear evi-dence that Eden-Stainmore ice later overprinted some of the more westerly North Sea Lobe moraines (VM1 onFig. 7), thereby indi-cating ice margin oscillation during retreat. This early deglaciation of the lateral margin of the North Sea Lobe in the Vale of Mowbray may have coincided with ice retreat from North Norfolk and the Humber region in the North Sea from 21e19 ka (Roberts et al.,
2018a,b) and preceded the damming of Glacial Lake Tees (Agar, 1954). Glaciers in major valleys emanating from the Pennine hills, such as Wensleydale and Swaledale, formed piedmont lobes in the Vale of York lowland as they ceased to be constrained by the southerlyflowing Vale of York Lobe. Ice from Wensleydale spread laterally as it exited the confines of this narrow Pennine valley; the older W1 moraines show a more southerly orientation compared with the younger W2 recessional moraines (Leeming moraine;
Bridgland et al., 2011) suggesting that they were initially deflected southwards by ice to the north (Fig. 7).
5.1.2. Ice recession through Stainmore Gap and uncoupling from upper Teesdale ice ~19 ka
The new cosmogenic nuclide ages in this study indicate that the Eden-Stainmore Ice Stream had receded to the central part of the Stainmore Gap by ca. 19 ka and that complete deglaciation of the Stainmore Gap occurred within the error range of these new ages, between ~20e18 ka (Fig. 9). This is supported by a radiocarbon age
of 16.6±0.5 cal ka BP from Parrick House (Fig. 1;Innes and Evans, 2017), which provides a minimum age for ice retreat from the central Stainmore Gap. Samples from the Stainmore region are also within errors of those taken from the Tyne Gap, which became ice free in the eastern sector by 18.4±0.8 ka and in the central sector by 17.4±0.7 ka (Livingstone et al., 2015) (Table 3, Fig. 9). The pattern and rate of retreat for the Tyne and Eden-Stainmore palaeo-ice stream corridors was therefore broadly synchronous.
Moraines trending W-E along the southernflank of the Stain-more Gap, including the Feldom moraine (Figs. 5 and 6a;Kendall and Wroot, 1924), document progressive thinning of the lateral margin of the Eden-Stainmore Ice Stream from 380 to 330 m as it receded from the Vale of Mowbray (Bridgland et al., 2011). On the northernflank of the Tees Valley, deglaciation of Eggleston Moor suggests thinning and exposure of high terrain (>420 m) as early as 21.1±0.8 ka (Fig. 7), prior to or during ice-marginal recession from the Vale of Mowbray. As ice retreated back into the Stainmore area, inset moraines spanning the corridor record a change from
westwards (ST3-5) to north-westwards retreat (ST6) as northern Pennine ice became increasingly dominant and eastwardsflowing Stainmore ice began to shut down. This was followed by localised and topographically constrained moraines and lateral meltwater channels documenting the uncoupling of Teesdale and Eden-Stainmore ice (ST7, Te 1e3).
Detailed geomorphological and sedimentological investigations in Teesdale revealfive inset assemblages of moraines and associ-ated meltwater channels that record oscillations of the Teesdale and Stainmore ice during deglaciation (Evans et al., 2018). During thefinal Lonton stage, lateral meltwater channels demarcate the temporary development of cold-based or polythermal ice condi-tions around the margins of a plateau-based icefield (Fig. 6e), and have been correlated with locally derived glaciotectonised bedrock moraines in the middle and southern part of the Stainmore Gap (ST7;Fig. 6d), likely derived from quarrying under a frozen snout (Livingstone et al., 2017; Evans et al., 2018). Evans et al. (2018)
assign this Lonton stage approximately to the Scottish Re-advance. This agrees with the bounding ages, which suggest that retreat across Stainmore ~19 ka coincided with the Scottish Re-advance into northern Cumbria at a similar time (Chiverrell et al., 2018), and that ice persisted in the Vale of Eden and Stainmore during this period (see below).
5.1.3. Iceflow reversal and recession through the Vale of Eden
The Vale of Eden deglaciated early, with the relatively high elevation Crossby-Ravensworth Fell samples (340e370 m asl)
becoming exposed at 19.1±0.6 (Wilson et al., 2013a) to 20.3±0.6 ka (this study). That these ages are within error of the deglacial ages in the Stainmore Gap implies that both areas thinned near-synchronously. Thus a majorflow reversal mapped in the Vale of Eden,flowing northwards into the Solway Lowlands and Irish Sea Basin (Rose and Letzer, 1977;Mitchell and Riley, 2006;Livingstone et al., 2008), must have occurred prior to ~20 ka. To explain this large-scaleflow reversal, ice centres further north across southern Scotland must have thinned or shiftedflow direction to allow ice dispersal centres across the Lake District, Howgill Fells, Yorkshire Dales and Alston Block to drive ice north-westwards down the Eden Valley. During thisflow reversal, topography became more influential and important, suggesting thinner ice in general. At the northern end of the Vale of Eden, the Brampton Kame Belt formed during this phase of iceflow, forming a large area of glaciofluvial sediment (cf. Trotter and Hollingworth, 1932; Huddart, 1981;
Livingstone et al., 2010c;Lovell et al., 2019).
This late stage and transient build-up of ice domes across high plateaus fringing the southern edge of the BIIS towards the end of the LGM would have triggered the rapid regional shutdown of easterlyflowing ice stream corridors as source areas and dispersal patterns shifted. Subsequent thinning and recession of the Vale of Eden ice is difficult to pin-point due to the lack of moraines or other ice-marginal evidence in this region. However, ice-marginal melt-water channels (Arthurton and Wadge, 1981; Greenwood et al., 2007; Livingstone et al., 2010) and a series of moraines (Fig. 5) indicate temporary stabilization against the Penrith sandstone outcrop document recession of ice in the Vale of Eden. Thefinal phase of ice-flow northwards through the Vale of Eden must have been sourced from the Howgills and the Lake District, given the elevation of the meltwater channels. The Pennines were likely a small plateau icefield by this time.
Chiverrell et al. (2018)constrain the timing of the Scottish Re-advance, which was thought to be a regional event across the Isle of Man and Cumbrian Lowlands, to 19.2e18.2 ka. This corresponds
period. This hypothesis requires further testing, and a more robust chronology for the central sector of the BIIS is needed to fully disentangle regional ice dynamics. By 17 ka ice had retreated back into upland ice dispersal centres, such as the Lake District, and these were undergoing widespread thinning (e.g.McCarroll et al., 2010;Wilson et al., 2013b;Wilson and Lord, 2014).
5.2. Reconstruction of the central sector of the last British-Irish Ice Sheet
The new geomorphological mapping and age constraints re-ported here allow the reconstruction of a 4-stage model for ice retreat in the central sector of the BIIS (Fig. 10), which builds on recent models put forward byLivingstone et al. (2012,2015)and
Roberts et al. (2018a;b).
5.2.1. Stage I (LGM)
The Eden-Stainmore Ice Stream, with multiple source regions in the Southern Uplands, Lake District and Pennines,flowed through the Eden Valley and across the broad Stainmore Gap where it became confluent with the North Sea Lobe (Fig. 10). During the
early stages of the LLGM the Eden-Stainmore Ice Stream may have reached the east coast via the Tees basin as indicated by the Shap erratics train.
During the latter stages of the LGM (~22e20 ka) the rapid
build-up of local ice masses across the Lake District, Northern Pennines and Yorkshire Dales triggered ice divide migration and flow reversal to the northwest along the Eden-Stainmore Ice Stream corridor.
The subsequent reduction in easterly iceflux may have facili-tated the incursion of North Sea Lobe ice westwards through the Tees basin and into the Vale of Mowbray/York where a composite ice lobe formed. Coincident with, or shortly after this, a regional re-advance of the North Sea Lobe at ~22e21 ka in the North Sea
[image:17.595.78.510.313.722.2](Roberts et al., 2018a) may have been responsible for the formation of the Escrick-York moraine complex, or for the moraine complex in the Vale of Mowbray. Clast lithological data from the Escrick-York moraine complex includes Carboniferous Limestone and sand-stone, with sporadic volcanic material (Murton, 2018), suggesting that the Eden-Stainmore Ice Stream dominated iceflow into the Vale of York. However, clast lithological data from Lindholme, just south of the Escrick-York moraine complex (Fig. 4), includes
Permian Lower Magnesian Limestone from the east coast of northern England (Bateman et al., 2015), suggesting some input from the North Sea Lobe and supporting a composite ice lobe.
5.2.2. Stage II (20 ka)
The North Sea Lobe and Eden-Stainmore Ice Stream deglaciated at approximately the same time, although in the Vale of Mowbray recessional moraines from the Eden-Stainmore Ice Stream over-print North Sea Lobe moraines, suggesting minor asynchroneity between the two ice masses in the window 21e19 ka (Figs. 6 and 7).
The growing dominance of local ice domes over the Lake Dis-trict, central Pennines and Yorkshire Dales towards the end of the LGM caused major regional-scale changes to iceflow configuration. Our new ages from Egglestone Moor at 385e416 m asl support
thinning and increasing topographic focusing in the Stainmore Valley at 21.1±0.8. The Feldom moraine along the southernflank of the Stainmore Gap (Fig. 5a;Fig. 5;Kendall and Wroot, 1924) also documents progressive thinning of the lateral margin of the Eden-Stainmore Ice Stream from 380 to 330 m as it receded from the Vale of Mowbray.
5.2.3. Stage III (19 ka)
Following theflow reversal in the Eden Valley, the Stainmore-Eden corridor deglaciated between 19.8 and 18.0 ka (Fig. 10) with the central Tyne Gap also deglaciating around this time (18.5e17.1
ka). The Brampton Kame Belt formed in the Solway Lowlands as the Vale of Eden ice lobe and Tyne Gap ice lobe receded. Ice in the Vale of Eden receded rapidly, forming cross-valley moraines, in line with the broader regional deglaciation, and ice in the Lake District was confined to valley glaciers. Hence, while the Tyne Gap and Eden-Stainmore ice stream corridors were downwasting, the Scottish Re-advance was underway, suggesting that the Southern Upland ice dispersal centres were once again being nourished (Stage III;
Chiverrell et al., 2018).McCabe et al. (1998)relate this to Heinrich I and North Atlantic cooling, althoughChiverrell et al. (2018)have recently highlighted the challenges of cross-correlating multiple regional re-advances with discrete climate events.
The North Sea Lobe remained along the coast of County Durham until ~19 ka, (damming Glacial Lake Wear;Roberts et al., 2018b), but ice had left the Yorkshire coast by this time. Hence glacial lakes Humber, Pickering and Tees may have only been partially dammed by moraines by this time.
5.2.4. Stage IV (17 ka)
By 17 to 16.5 ka, the North Sea Lobe had receded completely from the east coast of England and reached the Firth of Forth (Roberts et al., 2018b). Thefinal stages of glaciation inland saw the establishment of a plateau icefield over the Pennines and a local ice cap over the Lake District (Fig. 10; Stage IV). This plateau icefield was likely deglaciated before 17 ka, but the Lake District ice cap endured for longer, due to the higher elevation of the terrain. The central Stainmore corridor was ice-free. The radiocarbon age (16.6±0.5 cal ka BP) from Parrick House (Fig. 1;Innes and Evans, 2017) is consistent with the cosmogenic nuclide ages from the nearby Goldsborough Crags and Low Crags in the central Stainmore Gap.
5.3. Implications for ice dynamics
This study highlights the presence of dynamic and land-terminating ice streams in the central sector of the last BIIS from the LLGM through to deglaciation; most work to date has focused on ice streams that terminated offshore, on the continental shelf, at the margins of the BIIS (e.g.Stoker and Bradwell, 2005;Livingstone et al., 2012;Krabbendam et al., 2016;Chiverrell et al., 2018;Roberts
et al., 2018a). The land-terminating Vale of York ice stream termi-nated in a shallow lake, a rare example within the last BIIS. Glacial Lake Humber was rather shallow, with the presence of moraines suggesting an ice margin with limited calving. As a land-terminating ice stream is more isolated from marine controls on ice dynamics (i.e. sea surface temperatures, bathymetry and water depth, ocean currents), the Vale of York Lobe may have been responding to different external controls to those driving ice stream dynamics around the rest of the BIIS, although we note that the North Sea Lobe was also terrestrial during its early recession.
The Eden-Stainmore and North Sea Lobe ice streams were highly dynamic, with majorflow shifts andflow reversals over the short timeframe of 1000 years. Our new data provide insights into the timing of major reorganisations close to the centre of the last BIIS, with a highly unusual major change in palaeo ice-flow direc-tion of close to 180driven by changing regional ice divides, and with iceflow being increasingly controlled topographically as the ice sheet thinned during early deglaciation. This thinning was likely driven by external factors related to changes in the oceanic and climatic system. Deglacial changes in ice streamflow are not un-usual in palaeo-ice sheets, butflow reversals similar to those of the Eden-Solway system are less common. For example, less substan-tial changes in palaeo ice-flow direction have been observed in the Antarctic Peninsula, with palaeo iceflow being increasingly driven by thinning during deglaciation (e.g.,Glasser et al., 2014). In Ireland,
flowset cross-cutting is prevalent, indicating major ice-divide mi-grations and changes in the flow configuration of the ice sheet (Greenwood and Clark, 2009). Here, late-stage flowsets again reflect increasing control by local topographic factors. In North America, palaeo ice-streams showed dynamic behaviour over low-relief areas, with a‘switching’behaviour driven by changes in ge-ology and topography during recession, competition between neighbouring catchments (in terms of ice and subglacial melt-water), and surging behaviour, as well as potential external climate triggers (Dyke and Prest, 1987;O Cofaigh et al., 2010 ;Evans et al., 2008,2014;Margold et al., 2015).
These topographically driven ice streams contrast with the rapid change in marine-terminating ice-stream organisation currently seen in Antarctica, for example, with Kamb and Institute ice streams on the Siple Coast (e.g.Catania et al., 2006;Conway et al., 2002;Joughin et al., 2005;Siegert et al., 2013). Iceflow direction change of ~45is also recorded in fold structures in ice layers in the interior of West Antarctica (Siegert et al., 2004). This fold axis is more than 50 km long, aligned at up to 45to present-day iceflow direction. This modern analogue provides a mechanism by which iceflow direction can evolve over time. These rapid changes in the Antarctic Siple Coast are highlighted by relict longitudinal surface structures such asflow stripes, which are no longer aligned with the direction of iceflow (Ely and Clark, 2016;Ely et al., 2017). These marine-terminating ice streams all drain in predominantly the same direction, and compete for ice among their own catchments. In these cases, ice stream shutdown may be driven by internal controls (e.g. water piracy, bed stiffening; cf.Anandakrishnan and Alley, 1997; Alley et al., 1994; Carter et al., 2013), in contrast to our study region.
In contrast, palaeo ice sheets and icefields that are nourished by Alpine topography (e.g. European Alps, New Zealand, Patagonia, North American Cordillera), tend to remain topographically controlled throughout full glaciation, and so do not record similar evidence of changes in palaeo ice-flow direction during deglacia-tion (e.g.Barrell, 2011;Coronato and Rabassa, 2011;Glasser et al., 2008).
could be expected to occur as a result of changing ice divides and shifting centres of accumulation in a rapidly changing ice mass in a variety of different circumstances and environments (Clark, 1997;
Kleman et al., 2006), but topographic forcing of ice flow must become increasingly important in the later stages of glaciation where thinning exposes closely spaced upland massifs, as in the central sector of the last BIIS. It is likely that the very significant changes in palaeo-iceflow direction observed in the Vale of Eden was a rare consequence of the local and regional topography and geology, with a multitude of regional ice dispersal centres, upon which complex ice-divide migration took place during ice-sheet thinning. This work highlights the potential for major ice-flow reorganisations close to the centre of a large ice sheet, and the importance of variation in local upland centres of ice dispersion for driving iceflow.
5.4. Key unknowns in the post-LGM evolution of the central sector of the BIIS
This work, and on-going research in the area, highlights a number of remaining key research questions. Firstly, chronological control for ice recession from the Lake District, Howgill Fells and key valleys in the Yorkshire Dales remains elusive. The recession of the southern margin of the ice sheet throughout the Late Glacial remains poorly constrained. In our new model, ice extent in this region after 19 ka remains highly speculative. The presence of plateau icefields in the North Pennines during the Late Glacial has been established from geomorphological mapping in Teesdale (Evans et al., 2018), but is not yet established south of the Stainmore Gap; detailed geomorphological mapping and landsystems analysis is required in these valleys. The presence of ice in these Pennine uplands during the Younger Dryas glaciation is also unresolved (cf.
Manley, 1961;Wilson and Clark, 1995;Mitchell, 1996;Evans and Jamieson, 2017). Further chronological control would help to un-derstand links to wider atmospheric circulation and broader cli-matic controls, and would enable a higher degree of confidence in assessing the (a) synchronicity of recession in different parts of the ice margin. These kinds of data are required in order to fully assess ice-sheet response to rapid external climatic forcing, which is critical if we are to combine geomorphological, geochronological and palaeoclimatic data in numerical ice-sheet models (cf.Evans et al., 2009;Hubbard et al., 2009;Ely et al., 2019), and use these data to improve our understanding of present-day ice-sheet change.
6. Conclusions
This study aimed to determine the nature and timing of degla-ciation in the central sector of the last BIIS, specifically in the Vale of York, Vale of Mowbray, Eden Valley and Stainmore valley. The new geomorphological mapping of moraines and meltwater channels, together with 11 new 10Be surface exposure ages on glacially transported boulders and glacially eroded bedrock, allow us to constrain ice-stream retreat following the LGM in northern En-gland. These new data reveal 1561 individual moraines and 677 new meltwater channels that can be related to 108 ice-marginal positions.
The new data reveal a complex pattern of ice-stream recession and separation in the Vale of Mowbray, across the Stainmore Gap and in the Vale of Eden. Extensive inset moraines here document oscillatory retreat and competition between the Eden-Stainmore Ice Stream, which sourced the Vale of York Ice Lobe, and North Sea Lobe, as the ice separated into constituent flow units. These new data are used to produce a 4-stage model for ice retreat in the central sector of the BIIS (Fig. 10).
During the early stages of the LGM, the Eden-Stainmore Ice Stream reached the east coast via the Tees Basin. By ~20 ka, this easterly iceflow was reduced and the ice stream began to wane. This facilitated westwards incursion of the North Sea Lobe into the Tees basin and possibly down the Vale of York, and may have coincided with a regional re-advance of the North Sea Lobe at ~22e21 ka in the North Sea. Dynamic interactions between the two
ice lobes are recorded in the multitude of ice margins recorded in the Vale of Mowbray. At ~21e19 ka, valley glaciers emanating from
the Pennine Hills (such as Wensleydale and Swaledale) formed piedmont lobes in the Vale of York lowlands, as they ceased to be constrained by ice in the central valley.
The Stainmore corridor became ice free by 19.8 kae18.0 ka,
coincident with the recession of the Tyne Gap Ice Stream further to the north. As the Stainmore Ice Stream waned, northern Pennine ice became increasingly dominant. Localised and topographically constrained moraines and lateral meltwater channels document the separation of Teesdale and Eden-Stainmore ice. By 17 ka, ice had retreated back into upland ice-dispersal centres. These data high-light the importance of complex topography and regional competing ice dispersal centres in driving ice sheet dynamics, ice divide migration and iceflow during regional thinning, and how these internal controls can modulate and influence a broader response to external climate and oceanographic controls on ice sheet dynamics.
Acknowledgements
Cosmogenic nuclide ages were funded by NERC CIAF grant 9149.1014. The authors acknowledge the Quaternary Research As-sociation (QRA) for a QRA Research Award which helpedfinance
fieldwork. The authors acknowledge the landowners for generous access to their land. The authors thank Jenny Thornton for carto-graphic and GIS assistance. The authors thank Mark Bateman for a number of constructive comments on the new reconstruction. We thank two anonymous reviewers for comments that improved the manuscript. Supporting data is included in the manuscript and can also be obtained by emailing the authors [email protected]. uk.
Appendix A. Supplementary data
Supplementary data to this article can be found online at
https://doi.org/10.1016/j.quascirev.2019.105989.
References
Agar, R., 1954. Glacial and post-glacial geology of Middlesbrough and the Tees es-tuary. Proc. Yorksh. Geol. Soc. 29, 237e253.
Aitkenhead, N., Barclay, W.J., Brandon, A., Chadwick, R.A., Chisholm, J.I., Cooper, A.H., Johnson, E.W., 2002. British Regional Geology: the Pennines and Adjacent Areas, fourth ed. British Geological Survey, Nottingham.
Alley, R.B., Anandakrishnan, S., Bentley, C.R., Lord, N., 1994. A water-piracy hy-pothesis for the stagnation of Ice Stream C, Antarctica. Ann. Glaciol. 20, 187e194.
Anandakrishnan, S., Alley, R.B., 1997. Stagnation of ice stream C, West Antarctica by water piracy. Geophys. Res. Lett. 24, 265e268.
Arthurton, R.S., Wadge, A.J., 1981. Geology of the Country Around Penrith. HMSO, London.
Balco, G., 2009. MATLAB Code for Camel Diagrams.https://cosmognosis.wordpress. com/2009/07/13/matlab-code-for-camel-diagrams/.
Balco, G., 2011. Contributions and unrealized potential contributions of cosmogenic-nuclide exposure dating to glacier chronology, 1990 - 2010. Quat. Sci. Rev. 30, 3e27.
Balco, G., Stone, J.O., Lifton, N.A., Dunai, T.J., 2008. A complete and easily accessible means of calculating surface exposure ages or erosion rates from10Be and26Al measurements. Quat. Geochronol. 3, 174e195.
Bamber, J.L., Vaughan, D.G., Joughin, I., 2000. Widespread complexflow in the interior of the Antarctic ice sheet. Science 287, 1248e1250.