EUROPEAN COMMISSION
Brussels, 9.7.2012 SWD(2012) 199 final
VOL 3
COMMISSION STAFF WORKING DOCUMENT
EU Accountability Report 2012 on Financing for Development Review of progress of the EU and its Member States
Accompanying the document
COMMUNICATION FROM THE COMMISSION TO THE EUROPEAN PARLIAMENT, THE COUNCIL, THE EUROPEAN ECONOMIC AND SOCIAL
COMMITTEE AND THE COMMITTEE OF THE REGIONS
Improving EU support to developing countries in mobilising Financing for Development.
Recommendations based on the 2012 EU Accountability Report on Financing for Development.
COMMISSION STAFF WORKING DOCUMENT
EU Accountability Report 2012 on Financing for Development Review of progress of the EU and its Member States
Accompanying the document
COMMUNICATION FROM THE COMMISSION TO THE EUROPEAN PARLIAMENT, THE COUNCIL, THE EUROPEAN ECONOMIC AND SOCIAL
COMMITTEE AND THE COMMITTEE OF THE REGIONS Improving EU support to developing countries in mobilising Financing for
Development.
Annex 4 - Aid for Trade Report for 2011
TABLE OF CONTENTS
1. Main messages ... 4
2. Preliminary remarks ... 5
3. Progress in EU Aid for Trade Flows... 7
3.1 Wider Aid for Trade... 7
3.2 Trade Related Assistance ... 13
4. Complementarities between EU and its Member States ... 16
4.1 Analysis by category and sector... 16
4.2 Size and number of projects... 19
4.3 Instruments used ... 22
4.4 Geographical coverage... 23
5. AfT flows to LDCs and ACPs ... 26
5.1 Evolution of the AfT flows to LDCs ... 26
5.2 AfT to LDCs by donor and sector... 30
5.3 LDCs and other income groups... 31
5.4 AfT flows to ACP countries... 31
6. Qualitative Assessment of EU Aid for Trade ... 33
6.1 Ownership ... 34
6.2 Joint operations and harmonisation... 35
6.3 Regional dimension of AfT... 35
6.4 AfT Monitoring and Evaluation... 36
6.5 LDCs and EU AfT ... 36
6.6 Conclusions ... 38
1. MAIN MESSAGES
The European Union (EU) and its Member States are longstanding providers of development assistance in support of increased international and regional trade.
Since 2007, the EU and its Member States have been driving the global Aid for Trade (AfT) efforts, confirming again in 2010 the EU’s position as collectively the largest provider of AfT in the world. Indeed, the EU and Member States accounted for around 32% of total AfT flows in 2010, reaching more than EUR 10.7 billion (EUR 8.2 billion from EU Member States and EUR 2.5 billion from the EU), an increase of 4.2% in comparison with last year.
As highlighted in last year’s AfT monitoring report, the EU and its Member States had already met their 2010 EUR 2 billion target for Trade Related Assistance (TRA) in 2008 and in 2009. TRA remained over the target in 2010, at EUR 2.6 billion, but for the first time since 2005 there was a decrease if compared to the previous year (- 0.2 billion or -8% on 2009) Nevertheless EU and its Member States remain the major providers of TRA, with 60% of total TRA commitments.
Beyond increasing AfT volumes, the EU AfT Strategy is focused on enhancing the impact of the support. This year’s AfT monitoring exercise demonstrates that EU and Member States continue to advance in the implementation of EU AfT Strategy through a continued effort to increase the impact of AfT delivery. It also shows important complementarities between the EU and its Members States in terms of categories and sectors, size of projects, instruments used and geographical coverage.
The responses to the AfT questionnaire from EU Delegations elaborated together with EU MS field offices indicate a progressive improvement in terms of partner-donor policy dialogue, joint operations and harmonisation, the inclusion of strategic regional economic integration priorities into the national development plan or trade strategy. Despite the progress, there is the need for a better targeted, result-oriented and coordinated AfT as part of the aid and development effectiveness agenda, by encouraging developing countries to integrate trade as a strong component in their development instruments.
To further bolster the effectiveness of AfT, and as a result of this year's reporting, additional efforts by EU and Member States will be made in the following key areas:
• More attention should be paid to LDCs and developing countries most in need through mainstreaming of trade in their national and regional development strategies and a better use of existing multi-country instruments like the Enhanced Integrated Framework (EIF) to identify their needs and priorities.
• Better coordination and dialogue between Commission and MSs to align to development strategies of partner countries as much as possible, supporting efforts to integrate inclusive and sustainable growth dimension in these strategies.
• Need for more transparency and efficiency in trade policy making. EU Questionnaires show that while in three quarters of AfT beneficiary countries trade is a regular topic of discussion, it seems that civil society is little involved in the AfT dialogue. The role of civil society, including private sector, is very important to legitimate trade policy at the domestic level.
• Continue the support to partner countries' own monitoring of results and impact of Aid for Trade and the progress of their trade development strategies. According to the findings of the field questionnaire, obtaining in-country data and defining suitable indicators remain the main challenges in assessing AfT programmes and projects.
2. PRELIMINARY REMARKS
Aid for Trade entered the WTO agenda with the Doha Development Round. In 2005, several donors, including the EU and its Member States, made commitments to increase their trade-related support. In December 2005, the WTO Ministerial Conference in Hong Kong set up a Task Force to ‘operationalize Aid for Trade’.
In its 2006 recommendations, this Task Force stated that ‘Projects and programmes should be considered as Aid for Trade if these activities have been identified as trade-related development priorities in the recipient country’s national development strategies’. It specified six groups of activities that it considered to constitute Aid for Trade: Trade Policy and Regulation (category 1), Trade Related Infrastructure (category 3), Building Productive Capacity (category 4, including trade development), Trade Related Adjustment (category 5) and Other Trade Related needs (category 6). Categories 1, 2 and 6 (category 2 is a subset of category 4) correspond to standard Trade Related Assistance (TRA) and categories 1, 3, 4, 5 and 6 are usually referred as ‘the wider Aid for Trade agenda’ or AfT1 .
Different sources of information on AfT flows are available. The 2012 AfT monitoring report is based on four main sources of information:
• The OECD Creditor Reporting System (CRS) database is the most comprehensive and accurate database available on AfT flows for the period 2000-2010. It does not report on AfT flows from new EU Member States (only the EU and 15 Member States report to the OECD CRS as DAC members), on trade development markers before 2007 (important to identify category 2) and on category 6 data.
• The Doha Development database is a publicly available database on Trade Related Assistance (TRA) flows over the period 2001-2007. It is provided by the World Trade Organization (WTO) through the Doha Development Agenda website (tcbdb.wto.org). This database is particularly useful for historical evaluations of TRA for the period 2001-2006/2007, and particularly for category 2 (Trade Development).
AfT figures are not available in the primary sources of data (OECD CRS and Doha Development Agenda Database) and data regarding category 6.
3. PROGRESS IN EUAID FOR TRADE FLOWS
EU and Member States adopted a joint AfT Strategy on 15 October 2007 which aims at supporting all developing countries, particularly the Least Developed Countries (LDCs), to better integrate into the world trading system and to use trade more effectively in promoting the overarching objective of eradicating poverty in the context of sustainable development.
EU commitments
In 2007, the EU Aid for Trade Strategy2 aimed at increasing financial resources for Aid for Trade and improving its impact on poverty reduction. In particular, the EU committed to: - Increasing EU Aid for Trade in coherence with the gradual increase of overall EU aid; - Enhancing the Pro-poor Focus and Quality of EU AfT;
- Increasing EU-wide and Member State donors’ capacity in line with globally agreed aid effectiveness principles;
- Building upon, fostering and supporting ACP regional integration processes with an ACP specific angle of EU AfT.
The EU AfT Strategy confirmed the 2005 EU committement, pledging to strive to increase its collective Trade Related Assistance expenditure to EUR 2 billion per year by 2010, with EUR 1 billion coming from the EU and EUR 1 billion from the Member States.
3.1 Wider Aid for Trade Main trends
Following a strong increase observed in 2008 (+44%), last year's report (with data for 2009) indicated an all-time high of collective EU and Member States Aid for Trade commitments. In 2010 AfT commitments continued to increase but at a slower pace of +4.2%, reaching a total of almost EUR 10.7 billion.
Figure 1 - Aid for Trade (EU and Member states, in EUR million)
Sources: OECD CRS, Monterrey Questionnaires, EU
In 2010, Germany was the major AfT contributor among EU and EU Member States, with EUR 3.3 billion committed. It was followed by the EU, with EUR 2.5 billion committed, France (EUR 1.3 billion, +17% compared to 2009) and Spain (EUR 1.0 billion, +52% compared to 2009).
Table 1 - Amounts of AfT by Country: 2001-2010
In EUR million 2001 2002 2003 2004 2005 2006 2007 2008 2009 2010
Austria 15 63 21 17 27 26 44 51 58 68
Belgium 114 186 135 178 155 156 209 221 389 315
Bulgaria 0 0 0 0 0
Cyprus - - - - -
Czech Rep. 3 3 0 0 0
Denmark 81 206 188 367 410 189 255 173 251 314
Estonia 0 0 0 0 0
Finland 31 41 38 43 100 64 84 135 256 195
France 635 329 466 527 722 744 1 017 1 738 1 090 1 277 Germany 962 816 776 889 1 138 1 495 1 213 2 036 1 889 3 345
Greece 6 4 12 14 22 11 10 13 15
Hungary - - - -
-Ireland 19 19 22 26 20 29 30 52 44 49
Italy 105 164 187 70 310 239 111 186 197 131
Latvia 0 0 0 0
-Lithuania 0 0 1 0 0
Luxembourg 3 2 15 14 11 12 27 28 22 26
-Poland - - 0 -
-Portugal 30 17 8 41 61 7 47 13 66 41
Romania - 0 0 - 1
Slovakia - - - -
-Slovenia 1 1 2 0 2
Spain 253 306 366 247 135 561 474 622 660 1 002 Sweden 192 135 170 150 200 259 267 225 247 283 United Kingdom 631 422 670 286 665 480 380 1 240 1 329 716 Member States 3 413 3 175 3 369 3 327 4 352 4 975 4 685 7 200 6 995 8 203 EU 1 741 2 036 1 903 1 444 2 117 2 563 2 436 3 056 3 298 2 520 Grand Total 5 154 5 210 5 272 4 770 6 468 7 538 7 120 10 256 10 293 10 723
Sources: OECD CRS, Monterrey Questionnaires, EU MS revisions
Other donors
EU and Members States still represent a large share of both total AfT flows (32%) and of total ODA (38% in 2010). However, after a peak at 40% in 2006, the share of EU and Member States in total AfT has been decreasing. A similar trend of a decreasing share can also be observed as regards total ODA flows from EU and Member States.
Figure 2 - Share of EU and its Member States in Total AfT and Total ODA
Sources: OECD CRS, Monterrey Questionnaires, EU
Figure 3 - Share of Aft in Total ODA for EU and its Member States and other donors
Sources: OECD CRS, Monterrey Questionnaires, EU
AfT has become increasingly important for all DAC members. Total AfT was equal to EUR 34 billion in 2010 and increases were reported for all major donors.
Figure 4 - Aid for Trade by major donor
[image:10.595.116.479.416.657.2]Categories
[image:11.595.116.481.179.437.2]Building Productive Capacity (BPC) and Trade-related Infrastructure (TRI) represent the most important components of AfT, respectively EUR 5.1 billion and EUR 4.8 billion in 2010. The three other categories (Trade Policy and Regulation, Trade Related Adjustments and Other Trade Related Needs) represent less than 8% of the total (a share that has been almost stable since 2007).
Figure 5 - Aid for Trade by Category (EU and Member states, in EUR million)
Source: OECD CRS
Geographical coverage
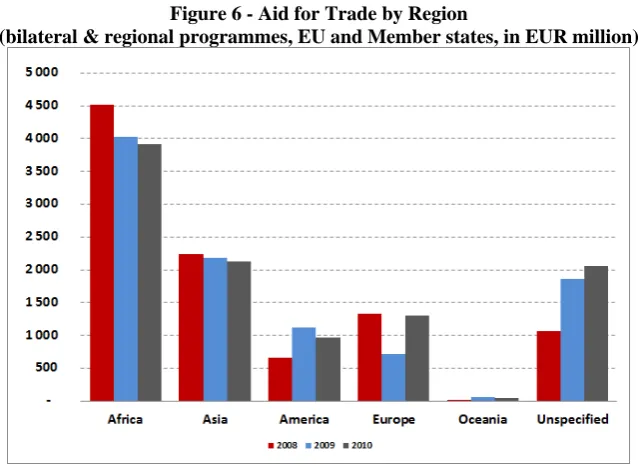
Figure 6 - Aid for Trade by Region
(bilateral & regional programmes, EU and Member states, in EUR million)
Source: OECD CRS
In terms of growth rates, there is a slight decrease in the amount committed to all regions except for Europe, which has seen an increase of 82% since 2009. “Unspecified” programmes now represent 20% of total AfT.
Disbursements
[image:12.595.138.458.56.289.2]The EU and its Member States maintain a high level of disbursements. In 2010, disbursement represented 82% of commitments for EU and Member States, in comparison with 68% of committed amounts disbursed for other donors. Moreover, since 2008 a positive trend for EU and Member States has been observed in this regard.
Figure 7 - Aid for Trade: Disbursement versus Commitments EU and its Member States
(disbursements in dark red, in EUR million and percentages)
Other Donors
(disbursements in dark blue, in EUR million and percentages)
3.2 Trade Related Assistance
Main trends
In the joint 2007 AfT Strategy, EU made specific financial commitments in relation to TRA, pledging to increase its collective spending to EUR 2 billion per year by 2010. The EU and its Member States met the EUR 2 billion target for TRA already in 2008 and 2009 and for 2010 this continues. However, for the first time since 2005, commitments were slightly down, at EUR 2.6 billion compared to EUR 2.8 billion in 2009 (-8% in 2010, to be compared to +24% in 2009).
[image:13.595.116.481.312.557.2]The substantial increase of TRA over the 2006-2009 period and the decrease in 2010 were attributable to Member States (+52% between 2008 and 2009 and -12% in 2010) while EU has maintained almost the same level of commitment since 2006.
Figure 8 - Trade Related Assistance (EU and its Member States, in EUR million)
Sources: OECD CRS, Doha Development Database, Monterrey Questionnaires, EU
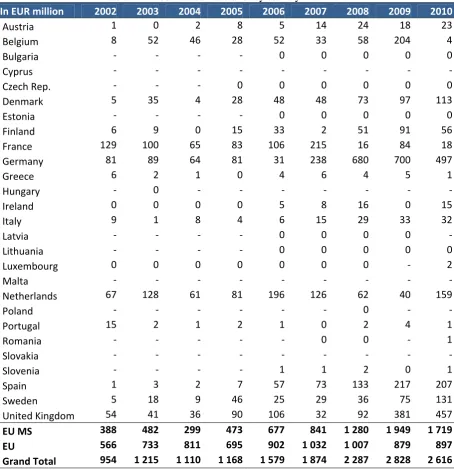
Table 2 - Trade Related Assistance by country: 2002-2010
In EUR million 2002 2003 2004 2005 2006 2007 2008 2009 2010
Austria 1 0 2 8 5 14 24 18 23
Belgium 8 52 46 28 52 33 58 204 4
Bulgaria - - - - 0 0 0 0 0
Cyprus - - - - - - -
Czech Rep. - - - 0 0 0 0 0 0
Denmark 5 35 4 28 48 48 73 97 113
Estonia - - - - 0 0 0 0 0
Finland 6 9 0 15 33 2 51 91 56
France 129 100 65 83 106 215 16 84 18
Germany 81 89 64 81 31 238 680 700 497
Greece 6 2 1 0 4 6 4 5 1
Hungary - 0 - - - - -
Ireland 0 0 0 0 5 8 16 0 15
Italy 9 1 8 4 6 15 29 33 32
Latvia - - - - 0 0 0 0 -
Lithuania - - - - 0 0 0 0 0
Luxembourg 0 0 0 0 0 0 0 - 2
Malta - - - - - - -
Netherlands 67 128 61 81 196 126 62 40 159
Poland - - - - - - 0 - -
Portugal 15 2 1 2 1 0 2 4 1
Romania - - - - - 0 0 - 1
Slovakia - - - - - - -
Slovenia - - - - 1 1 2 0 1
Spain 1 3 2 7 57 73 133 217 207
Sweden 5 18 9 46 25 29 36 75 131
United Kingdom 54 41 36 90 106 32 92 381 457 EU MS 388 482 299 473 677 841 1 280 1 949 1 719 EU 566 733 811 695 902 1 032 1 007 879 897 Grand Total 954 1 215 1 110 1 168 1 579 1 874 2 287 2 828 2 616
Sources: OECD CRS, Doha Development Database, Monterrey Surveys, EU MS revisions
Other donors
Figure 9 - Trade Related Assistance by major donor (in EUR million)
Sources: OECD CRS, Monterrey Questionnaires, EU
Categories
Trade Development (TD) (Category 2, which is a sub-set of Category 4) has continued to make up the bulk of total TRA since 2001 (75% on average). In 2010, the relative shares of the TRA categories were as follows: Trade Policy and Regulation representing 20%, Trade Development almost 70% and Other Trade Related Needs approximately 10%.
Figure 10 - Trade Related Assistance by Category (EU and Member states, in EUR million)
[image:15.595.114.482.458.710.2]Geographical coverage
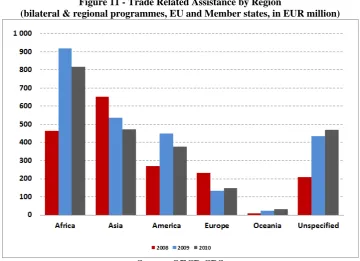
[image:16.595.117.478.221.482.2]Africa has continued to receive the largest share of EU and Member States TRA in 2010 with EUR 817 million (35% of the total). Almost 70% of these amounts were dedicated to the South of Sahara (see section 4.4). Asia remains the second destination of TRA commitments (EUR 472 million, 20% of total TRA) followed by America (16% of total TRA). All three were affected by the decrease in AfT commitments. A tendency to commit TRA through global programs and projects not specifically connected to a geographic region (“Unspecified”) is also observed.
Figure 11 - Trade Related Assistance by Region
(bilateral & regional programmes, EU and Member states, in EUR million)
Source: OECD CRS
4. COMPLEMENTARITIES BETWEEN EU AND ITS MEMBER STATES
The EU AfT strategy is not only based on quantitative pledges but also on efforts aiming at enhancing the quality of EU AfT in line with globally agreed aid effectiveness principles. An effort to achieve a greater complementarity, harmonisation and cooperation among donors is one of the pillars of the Strategy. The analysis below shows strong complementarities between the EU and Members States in terms of categories and sectors, size of projects, instruments used and geographical coverage.
4.1 Analysis by category and sector
Trade Related Infrastructure and Building Productive Capacities which represent more than 90% of total AfT. A decomposition of growth rates by category points out important differences between EU and Member States. The 19% increase of EU commitments is mainly explained by a 56% increase in commitments towards Building Capacities, which has been partly compensated by a 26% decrease towards Infrastructures. Conversely, the 88% increase in commitments by Member States is the result of a more homogeneous increase in both TRI and BPC (82% in TRI and 86% in BPC).
Figure 12 - Trade Related Infrastructure (in EUR million)
Source: OECD CRS
Figure 13 - Building Productive Capacity (in EUR million)
Source: OECD CRS
Figure 14 - Aid for Trade by Sector (EU 2005-2009, in percentages)
[image:18.595.72.523.83.440.2]Source: OECD CRS
Figure 15 - Aid for Trade by Sector (Member States 2005-2009, in percentages)
Source: OECD CRS
Figure 16 - Aid for Trade by Sector (EU in 2010, in percentages)
Source: OECD CRS
Figure 17 - Aid for Trade by Sector (Member States in 2010, in percentages)
Source: OECD CRS
The analysis of these major sectors (table below) stresses a strong degree of concentration among donors. Energy (with 67% of the programmes financed by Germany and 24% by France), and banking and financial services (with 55% of the programmes financed by Germany, 15% by UK, and 12% by Belgium) are the sectors that show the highest degree of concentration.
Table 3 - Aid for Trade by sector: breakdown by donor (in 2010)
Sectors Relative Shares of Member States
Energy Germany (67%), France (13%)
Agriculture Spain (31%), Germany (20%), France (17%) Transport & Storage Germany (37%), France (24%), Spain (16%)
Banking & Financial Services Germany (55%), United Kingdom (15%), Belgium (12%) Business & Other Services Germany (34%), Netherlands (16%), Denmark (15%), Spain (14%)
Industry Germany (34%), Netherlands (16%), Denmark (15%), Spain (14%)
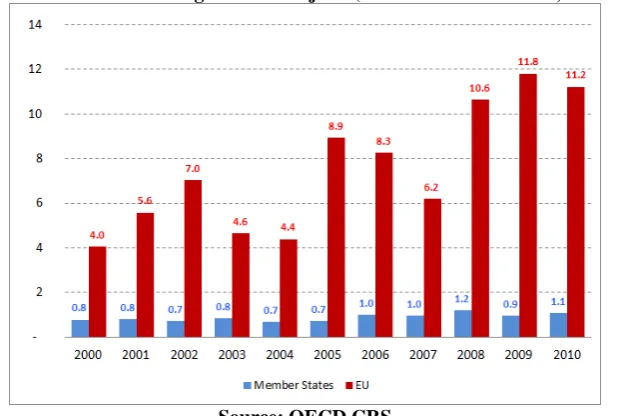
4.2 Size and number of projects
[image:19.595.145.455.213.421.2]The graph below shows the historical mean averages of project size for EU and Member States since 2000, calculated on the basis of total new commitments divided by the number of new committed projects. Complementarities between EU and Member States emerge from the analysis. The average size of EU projects is ten times the average size of projects financed by Member States (EUR 11.2 million in the case of EU compared to EUR 1.1 million for Member States) and the types of projects that have been financed are different.
Figure 18 - Aid for Trade - Average Size of Projects (EU and Member states, in EUR million)
Source: OECD CRS
Both in the case of EU and Member states there has been an upward trend in the average size of projects since 2000, with an average compound annual growth rate (CAGR) of 11% for the EU and of 3% for Member States. The detailed analysis of Member States projects shows that only six of them (The Netherlands, Germany, France, Sweden, United Kingdom and Denmark) manage AfT programmes with an average size of EUR 1 million or more.
Table 4 - Number of AfT projects by Country
2010
Austria 172
Belgium 809
Denmark 301
Finland 293
France 644
Germany 1677
Greece 22
Ireland 203
Italy 440
Luxembourg 168
Netherlands 155
Portugal 91
Spain 1 968 Sweden 212
United Kingdom 572
EU 198
[image:20.595.111.485.468.723.2]Source: OECD CRS
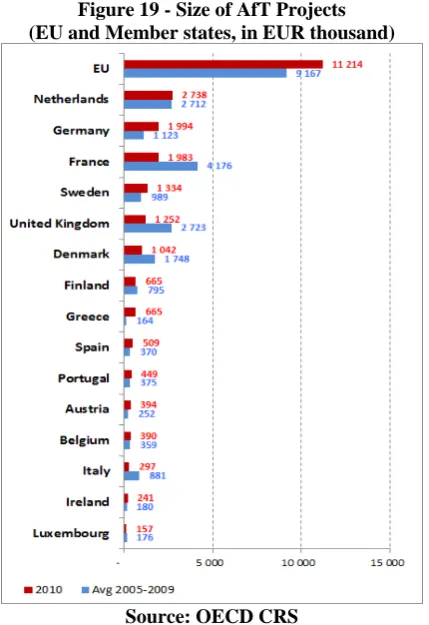
Figure 19 - Size of AfT Projects (EU and Member states, in EUR thousand)
Source: OECD CRS
The distribution of the size of projects (graph below) stresses the asymmetry between EU and Member States. In the case of EU the average size is close to EUR 10 million and the clear majority of projects in the range EUR 1 - 100 million. Member States show an opposite pattern, with the majority of the projects in the range EUR 0 - 1 million.
Figure 20 - Distribution of the Size of Projects in 2010 (EU and its Member states)
EU transport projects have the biggest average size (EUR 18.28 million) followed by agricultural projects (EUR 16.22 million). In Member States, mining projects are characterised by the biggest average size (EUR 4.08 million).
Table 5 - Size of EU AfT Projects by Sector in 2010 (% of total and ranges in EUR million)
Ranges (mn €) <0.1 [0.1-1[ [1-10[
[10-100[ >100 Total
Average Size
Transport & Storage 3% 3% 43% 51% 0% 100% 18.28
Communications 11% 22% 67% 0% 0% 100% 2.54
Energy 3% 5% 70% 22% 0% 100% 7.77
Banking & Financial
Services 0% 0% 100% 0% 0% 100% 1.17
Business & Other Services 10% 0% 60% 30% 0% 100% 8.67
Agriculture 2% 6% 44% 46% 2% 100% 16.22
Forestry 0% 13% 75% 13% 0% 100% 5.11
Fishing 0% 0% 67% 33% 0% 100% 7.25
Industry 0% 0% 65% 35% 0% 100% 9.90
Mineral Resources &
Mining 0% 0% 0% 0% 0% 100% 0.00
TPR 24% 21% 31% 24% 0% 100% 5.58
Tourism 0% 0% 0% 100% 0% 100% 11.00
Source: OECD CRS
Table 6 - Size of Member States AfT Projects by Sector in 2010 (% of total and ranges in EUR million)
Ranges (mn €) <0.1 [0.1-1[ [1-10[ [10-100[ >100 Total Average
Size
Transport & Storage 51% 26% 15% 7% 1% 100% 3.25
Communications 80% 15% 4% 1% 0% 100% 0.32
Energy 62% 18% 12% 7% 1% 100% 3.81
Banking & Financial
Services 60% 23% 15% 2% 0% 100% 1.15
Business & Other Services 65% 23% 10% 2% 0% 100% 0.80
Agriculture 60% 34% 6% 1% 0% 100% 0.52
Forestry 65% 24% 9% 2% 0% 100% 0.68
Fishing 58% 35% 7% 0% 0% 100% 0.40
Industry 66% 27% 6% 1% 0% 100% 0.50
Mineral Resources &
Mining 61% 34% 3% 0% 2% 100% 4.08
TPR 55% 30% 13% 1% 0% 100% 1.52
Tourism 67% 31% 2% 0% 0% 100% 0.15
[image:21.595.71.522.400.619.2]4.3 Instruments used
Since 2000, most EU and Member States AfT flows have been channelled through grants (almost 60% in 2010 in the collective AfT), even if the share of loans and equity investments has been increasing over the past few years. Also in this respect, EU and Member States show remarkable complementarities. In the case of EU, grants have been representing 100% of AfT programmes since 2007, while in the case of Member States 43% of programmes have been financed through loans and 13% through equity investments.
Figure 21 - Aid for Trade by Type of Flow (EU and Member States, in EUR million)
Source: OECD CRS
Figure 22 - Aid for Trade - ODA Loans (in EUR million)
Source: OECD CRS
[image:22.595.133.465.490.723.2]A comparison with other DAC donors shows that the share of grants in EU projects remains very high particularly since 2007, while it is much lower in the case of projects financed by Member States which tend to converge towards the average share of grants for all DAC donors (a 43% of total AfT flows in 2010).
Figure 23 - Share of grants in AfT (EU and Member States and other donors in 2010)
(27%), while equity investments are mainly used by UK (38%), Spain (37%), and Germany (22%).
Figure 24 - Aid for Trade – ODA Grants (EU and Member States in 2010)
Source: OECD CRS
Figure 25 - Aid for Trade – ODA Loans (EU and Member States in 2010)
Source: OECD CRS
Figure 26 - Aid for Trade - Equity Investment (EU and Member States in 2010)
Source: OECD CRS
4.4 Geographical coverage
Figure 27 - Aid for Trade by Region EU / Member states (bilateral & regional programmes, in EUR million, 2010)
Source: OECD CRS
A breakdown of the total amounts of AfT towards Africa in 2010 (charts below) shows that the majority of programmes was directed towards South of Sahara (80% of EU programmes and 60% of programmes financed by Member States). For Member States the shares of flows directed towards North of Sahara and Pan African programmes (respectively 32% and 8%) are more important than in the case of EU.
Figure 28 - Aid for Trade by Region – Africa (break down) (EU in 2010, in percentages)
Source: OECD CRS
Figure 29 - Aid for Trade by Region - Africa (break down) (Member States in 2010, in percentages)
Source: OECD CRS
Figure 30 - Aid for Trade on South of Sahara (EU, in EUR million)
Source: OECD CRS
Figure 31 - Aid for Trade on South of Sahara (Member States, in EUR million)
Source: OECD CRS
Box 1 - What are the projects under the category “unspecified region”?
[image:25.595.69.528.343.556.2]The volume of AfT projects in the category “Unspecified” is large and has been regularly increasing over the past years, particularly in the case of Member States (more than 20% of programmes in 2010).
Figure 32 - Aid for Trade: the category "unspecified" (EU and Member States, in EUR million)
Source: OECD CRS
Table 7 - The Category “unspecified”, list of 10 most important projects in 2010 (in EUR million, 72% of the category is covered)
Volume AfT Sector Title (EUR mln) Category
Germany 500.0 3 Power generation/renewable sources Clean Technology Fund (CTF) Spain 285.5 4 Agricultural policy & admin. mgmt FIDA's financial facilty Netherlands 157.1 1 Regional trade agreements (rtas) DGI CBI budget 2005
France 110.9 4 Agricultural research Recherches scientifiques et technolgiques autour du développement des pays du sud Germany 110.1 4 Formal sector financ. intermediaries Infrastructure Crisis Facility - Debt trust EU 80.8 3 Power generation/renewable sources Premier engagement financier global (GFC)
de la Facilité Energie 10è FED Belgium 72.0 4 Formal sector financ. intermediaries BIO - Fonds de Dévelopment – Globale Netherlands 69.5 4 Business support services & institutions DDE PSOM 2007-2013
Netherlands 60.3 3 Energy policy and admin. management DME Scalingup Renewable Energy EU 31.8 4 Agricultural development LRRD Component 4 FSTP AAP 2010
Source: OECD CRS
[image:26.595.67.524.288.524.2]In 2010, the bulk of the flows come from Germany (37%), The Netherlands (17%), and Spain (15%).
Table 8 - The Category “unspecified”, by donor (in EUR million, 2010)
Volume % of total (in EUR million)
Austria 12.6 1% Belgium 90.2 4% Denmark 2.4 0% Finland 46.6 2% France 145.0 7% Germany 766.9 37% Ireland 6.7 0% Italy 0.1 0% Luxembourg 7.6 0%
The Netherlands 344.2 17%
Portugal 0.5 0%
Spain 304.4 15%
Sweden 59.3 3%
United Kingdom 60.2 3% EU 205.7 10%
Total 2052.3 100%
Source: OECD CRS
5. AFT FLOWS TO LDCS AND ACPS
The EU AfT Strategy explicitly refers to supporting LDCs to better integrate into the rules-based world trading system and to more effectively use trade in promoting the overarching objective of eradicating of poverty in the context of sustainable development.
Moreover, one of the aims of the EU AfT Strategy is building up, fostering and supporting ACP regional integration processes through a support to ACP regions and countries to take full advantage of the increased trading opportunities and maximise the benefits of trade reforms, including those of the Economic Partnership Agreements (EPAs), while the collective EU delivery of AfT does not depend on the outcome of such negotiations.
5.1 Evolution of the AfT flows to LDCs
EUR 1.7 billion compared with EUR 8.7 billion to non-LDCs). This decrease can be probably explained by cyclical and EU programming factors. Furthermore, the share of LDCs in the total AfT remains underestimated because of the increasing tendency to provide support through programmes under the category "Unallocated by income" (see box 2).
Figure 33 - Aid for Trade to LDCs (EU and its Member states, in EUR million)
Source: OECD CRS
Figure 34 - Aid for Trade to LDCs (EU and its Member states, in EUR million)
Source: OECD CRS
The share of AfT provided to LDCs by other DAC donors is much higher than that of the EU and its Member States.
Figure 35 – Share of Aid for Trade to LDCs in comparison with other donors (in percentages)
[image:28.595.113.486.406.674.2]Box 2 – Underestimation of AfT share to LDCs
[image:29.595.72.526.142.376.2]In the OECD CRS database, regional programmes are classified in the category "Unallocated by income", but some of them are clearly LDCs-oriented, in particular regional programmes in Africa (EUR 615 million in 2010). Recalculating the share of LDCs taking these regional programmes in Africa into account, the share of AfT flows to LDCs increases.
Figure 36 - AfT for EU and its Member States: Adjusted share of LDCs (in % of total AfT)
2000 2005 2009 2010
Share of LDCs 34% 31% 23% 16% Adjusted share of LDCs 39% 35% 31% 22%
Source: OECD CRS, Authors calculations
Source: OECD CRS
The following list summarises the top receivers of AfT flows (regional or bilateral). The whole list of countries represented account for 65% of total AfT, and the same list explains 66% of programmes dedicated to LDCs. However, countries or regions are not always provided and the category “Unspecified” is the primary recipient of AfT flows (see Box 1 for details about this category). Therefore, for some of them, a share could be allocated to LDC (for example the “FIDA's financial facility” with EUR 286 million, the “DGI CBI budget 2005” with EUR 157 million, or the “Recherches scientifiques et technolgiques autour du développement des pays du sud” with EUR 111 million). To evaluate the potential sensibility of this evaluation, these three programmes have been added to the category. With such an adjustment, the share of LDCs would be 21% instead of 16% in 2010, and with the assumption of 25% of the rest being allocated to LDC this share would rise to 25% (a 10% increase compared to the initial evaluation).
Table 9 - AfT for EU and its Member States by Recipient Country: how many LDCs? (in EUR million, these countries account for 65% of total AfT)
2000 2005 2008 2009 2010 LDC
Unspecified 384 551 1 065 1 866 2 052 ?
Morocco 108 118 789 438 441
China 205 228 461 359 404
Egypt 42 137 308 87 402
Kenya 61 190 39 255 354
Turkey 64 102 554 199 347
South of Sahara 158 190 126 423 336 regional
India 149 234 391 425 308
Vietnam 104 168 52 162 248
Tunisia 141 32 332 172 245
Africa 42 30 243 391 237 regional
Serbia 87 190 174 57 203
Mozambique 113 138 154 84 198 Yes
Afghanistan 2 63 161 273 194 Yes
Europe 18 29 101 48 192
Bosnia-Herzegovina 13 36 84 57 163
Asia 53 30 162 111 149 regional
Brazil 26 35 33 144 149
[image:29.595.71.526.503.736.2]5.2 AfT to LDCs by donor and sector
In 2010, almost 30% of collective EU and Member States AfT towards LDCs have been granted by the EU followed by Germany (13% of collective AfT) even if the support to this group of countries equals only 7% of the total German AfT. AfT activities of Ireland (68% of the total Irish AfT), Sweden (45%), Belgium (40%) and Denmark (38%) are highly focused on LDCs.
Figure 37 - Aid for Trade to LDCs, by donor Table 10 - Share of LDC in AfT, by donor (in 2010) (EU and its Member states, in 2010
Austria 11% Luxembourg 23%
Belgium 40% Netherlands 4%
Denmark 38% Portugal 5%
Finland 25% Spain 14%
France 16% Sweden 45%
Germany 7% UK 14%
Ireland 68% EU 19%
Italy 32%
Source: OECD CRS
Source: OECD CRS
[image:30.595.189.406.460.625.2]More than 70% of AfT towards LDCs were directed towards three sectors (transport and storage, agriculture, and energy) in 2010
Figure 38 - Aid for Trade to LDCs, by Sector (EU and its Member states, 2010)
5.3 LDCS AND OTHER INCOME GROUPS
[image:31.595.114.478.221.480.2]Among the categories of countries monitored (LMIC: lower middle income countries, MADCT: more advanced developing countries, LIC: low income countries and UMIC: upper middle income countries), LDCs are the only category showing a decline in absolute amount compared to the 2005-2009 average. This decrease is probably due to cyclical factors. Moreover, in 2010 a considerable part of programs is unallocated by income (see § 5.1 and box 2).
Figure 39 - Aid for Trade by Income Group
(bilateral & regional programmes, EU and Member states, in EUR million)
Source: OECD CRS
5.4 AfT flows to ACP countries
In 2010, collective EU AfT flows provided to ACP countries decreased to EUR 3.1 billion (29% of the total collective EU AfT) in comparison with EUR 3.7 billion (36% of the total collective EU AfT) in 2009 (chart below). This decrease was due to the fall in EU commitments both on bilateral and regional levels. However, ACP countries remain a strong priority for the EU, with 39% of total EU commitments compared to 27% of total in the case
Figure 40 – Aid for Trade to ACP countries (EU and Member states, in EUR million)
[image:32.595.79.519.353.518.2]Source: OECD CRS
Figure 41 – Aid for Trade to ACP countries Bilateral (in EUR million)
Source: OECD CRS
Regional (in EUR million)
Source: OECD CRS
Figure 42 - Trade Related Assistance to ACP Countries (EU and EU MS, in EUR million)
Source: OECD CRS
6. QUALITATIVE ASSESSMENT OF EUAID FOR TRADE
The important part of the EU AfT Strategy is focussed on enhancing the effectiveness of AfT delivery.
As in previous years' monitoring exercises the European Commission submitted a questionnaire to EU Delegations in developing countries and invited them to provide a joint reply to be elaborated with the Member States present in the country and active in sectors covered by AfT. In addition to collecting important feedback from the field on how the AfT agenda is progressing at country and regional level, this exercise also helped catalyse and facilitate a discussion on AfT matters in the partner country in question.
This year's analysis contributed in particular to reinforce the understanding of a series of key issues including: the possibility of more coordinated EU and EU Member States work on AfT in partner countries, the use of trade needs assessments in AfT strategies, constraints to donor's support to LDCs, opportunities for greater regional integration support and difficulties in the area of AfT monitoring and evaluation.
6.1 Ownership
Trade issues in the EU donor – partner policy dialogue
EU Delegations and Member States representatives report that for nearly three-quarters of AfT beneficiary countries trade was a regular topic of discussion. This reflects the situation in thirty-seven partner countries out of 64, with only six responding negatively. 61% of respondents affirmed that no particular changes had occurred compared to 20094 while a still sizeable 39% observed an improvement.
A dialogue on AfT within partner countries appears to involve civil society only on an irregular basis. The replies indicate that 11% of recipient countries consistently incorporate civil society in AfT discussions while 54% occasionally do so. More importantly, about 31% rarely or never involve civil society in the policy dialogue, suggesting that opportunities for a broader dialogue exist.
Compared to 2009, 52% of Delegations in partner countries report that demand for AfT has increased. Despite not reflecting the general opinion of recipient countries, a non- negligible 23 respondents (35%) answered that AfT demand had seen little or no change since 2009. Moreover, the overwhelming majority of non-ACP countries (64%) have an existing intra-ministerial/institutional committee to coordinate trade issues whereas the same existed only in 39% of ACP countries.
Coordination process to develop and implement trade strategy
Half of EU field responses show that partner country has an existing government-donor coordination mechanism in place to develop and implement trade strategies, mainly in ACP countries. The other half of the countries are said either not to have such coordination processes or to have them formally but not using them actively. Reasons are generally related to lack of capacity or scarcity of human resources.
Trade Needs Assessment and Strategies
This year's exercise shows that 56% of partner countries have not conducted a comprehensive trade needs assessment over the past five years. This percentage was lower in the case of ACP countries (47%). It appears that even if a recent comprehensive trade needs assessment is available, its findings are fully or partially reflected in the trade strategy only in 30% of countries. Countries are either failing to integrate assessment findings or do not have an existing trade strategy in place. This remains a serious concern in that EU and Member States may be providing AfT support on the basis of an obsolete or non-existent trade needs assessment.
Figure 43 – Dialogue on Aid for Trade
(% of total responses)
Source: TAC, EAMR 2011
Figure 44 – Trade Needs Assessment (Has a comprehensive trade needs assessment been undertaken in the last five years?)
Source: TAC, EAMR 2011
6.2 Joint operations and harmonisation
Survey results for 2010 show that compared to 2009 there has been a moderate improvement in donor's coordination. This year's field responses indicated that in 51% of Partner Countries EU donors improved their coordination compared to 2009 (moderate improvements were reported in 43% of countries). However, at the same time, the replies show a softening in the pace of improvement, as only about 12% of those surveyed witnessed significant progress relative to 21% in the previous year.
6.3 Regional dimension of AfT
Field questionnaire's responses indicate that within 62% of partner countries EU donors were supportive/partially supportive in strengthening the inclusion of strategic regional economic integration priorities in national development plans or the trade strategies of partner countries. The remaining 38% reported there was no support. Compared to 2009, 13% of respondents considered that this represented an improvement.
6.4 AfT Monitoring and Evaluation
Asked about the problems that donors encounter in assessing AfT programmes and projects, 26% of replies indicated the difficulty of obtaining in-country data as one of the leading challenges. For the responses that reported the difficulty of obtaining in-country data as either ‘most important’ or ‘important’, the share increases to 83%. The second most importanthurdle is the difficulty in defining suitable indicators (74%).
A critical element in monitoring and evaluation is to feedback results into the government’s trade development strategy for which specific processes need to be in place. According to survey results, this is far from being the case. Only 6% indicated that this process ‘significantly’ applies whereas 36% stated it applies ‘moderately’.
6.5 LDCs and EU AfT
Trade related policy dialogue When asked whether trade is a regular topic of discussion in AfT dialogue with EU and Member States, 60% responded ‘yes’ while 33% ‘only a limited extent’. For a relatively insignificant 7% of partner countries trade is not part of the AfT dialogue at all. Compared to 2009, the trend has improved noticeably for at least eight countries (38%). Several reasons for changes or lack of changes in the LDCs policy dialogue were mentioned in the questionnaires. Among those, the circumstance that several LDCs were in crisis or post-crisis situations leads to a scaled down dialogue or to a focus on constitutional and socio-economic issues.
The case study
Zambia’s Great East Road Rehabilitation Project – Nacala Corridor-Highlights
This project started in 2010 concerns the improvement of some 360km of single carriageway highway on the Great East Road connecting central Zambia to its Eastern province, as well as into the Nacala Corridor, a regional transport corridor linking Malawi and Zambia to the deep sea port of Nacala in Mozambique.
Innovative approach:
AfT demand More than 70% of EU donors in LDCs (fifteen countries) reported an increase in AfT demand since 2009, while 29% reported ‘little or no change’ (six countries).
National coordination mechanisms In five out of twenty-one (25%) LDCs, EU field offices considered that national coordination mechanisms were in place to coordinate trade policy. Nine (45%) responded that these mechanisms exist formally but not actively used. In six LDCs (30%), such mechanisms were said not to exist.
It should be noted that LDCs responses indicate a lower degree of availability and use of trade policy coordination mechanisms in LDCs as compared to the total sample (Here 49% indicate that such mechanisms are available and used).
Trade needs assessment The replies from the EU Delegations indicate that only seven (two partially) LDCs countries (33%) carried out a comprehensive trade needs assessment in the last five years. For the few countries that have conducted a comprehensive trade needs assessment, six reflected the findings in their respective trade strategies. 44% of answers from LDCs show that there was no trade strategy in place in these countries.
Main LDCs constraints to increasing attention to trade
According to 19 responses (out of 21), the main constraint to increasing attention to trade is related to the low capacity to identify needs and priorities.17 responses indicated that the most important challenge is the low absorption capacity of LDCs. Other constraints highlighted as important or very important included ‘trade-related needs not substantiated’ (11 countries), ‘other more pressing priorities’ (11 countries), and ‘insufficient availability of funds from donors’ (7 countries). However, the latter constraint was considered to be the least important with 11 ‘less important’ and 4 ‘not important’ responses.
The case study
Supporting coffee and tea production in Rwanda
An EU project, set up to help support the Rwandan tea and coffee industry, creating more jobs and increasing the livelihoods of farmers as a result, has benefitted 60,000 farmers. Some 85% of the Rwandan population works in the agricultural industry.
6.6 Conclusions
This year’s AfT monitoring exercise demonstrates that EU and Member States continue to advance in the implementation of EU AfT Strategy particularly through a continued effort to increase the impact of AfT delivery.
The responses to the AfT questionnaire show that albeit from a low level a progressive improvement is taking place in terms of joint operations and harmonisation, inclusion of strategic regional economic integration priorities into the national development plan or trade strategy and partner-donor policy dialogue. However, it appears from the report that in many cases a national trade needs assessment has not been undertaken or a trade strategyis not in place and not reflected into the national development plans. Furthermore, civil society and private sector seem to be little involved in the AfT dialogue
In order to preserve this momentum and further bolster the effectiveness of the AfT:
• It is vital to pay more attention to LDCs through a direct support to mainstreaming of trade in their national and regional strategies and a better use of existing multi-country instruments like the Enhanced Integrated Framework (EIF) to identify their needs and priorities. Furthermore, particular attention should be paid to improve the Business Enabling Environment in these countries in order to attract more foreign and domestic investments and reduce their dependence on grants in AfT.
• Better coordination and dialogue between Commission and Member States are required to benefit the most from complementarities and to align to development strategies of partner countries as much as possible, supporting efforts to integrate inclusive and sustainable growth dimension in these strategies.
• Need for more transparency and efficiency in trade policy making through a more regular involvement of civil society and private sector in AfT dialogue.
• Continue the give support to partner countries' own monitoring of results and impact of Aid for Trade and the progress of their trade development strategies. Obtaining in-country
Figure 45 – Aid for Trade in LDCs
(% of total LDC responses)
Source: TAC, EAMR 2011
Figure 46 – Monitoring and Evaluation
('Important' % of total responses)