Int. J. Electrochem. Sci., 14 (2019) 2290 – 2304, doi: 10.20964/2019.03.35
International Journal of
ELECTROCHEMICAL
SCIENCE
www.electrochemsci.org
Preparation and Application of Nickel Plating on Copper
Electrode (NPCE) for Uric Acid Analysis in Human Urine Using
Cyclic Voltammetry
Riyanto* and Imaylina Rofida
Department of Chemistry, Faculty of Mathematics and Natural Science, Islamic University of Indonesia, Jalan Kaliurang KM 14,5 Sleman Yogyakarta Indonesia 55584
*E-mail: [email protected]
Received: 2 September 2016 / Accepted: 14 January 2019 / Published: 7 February 2019
Preparation and application of nickel plating on copper electrode (NPCE) for uric acid analysis in human urine using cyclic voltammetry has been done. NPCE electrode was formulated by using copper pure (99.99%), with length of 0.5 cm and wide of 1.0 mm respectively. Electroplating nickel on copper has been done using NiSO4, NiCl2, H3BO3, brighteners and carrier solution. Optimal conditions for electroplating nickel on copper at temperature, pH and time are 55 oC, 4.0-4.4, 15-30 minutes, respectively. Nickel plating on copper connected with silver wire using silver conductive paint. Cyclic voltammetry measurement using three electrode system are platinum wire as counter electrode, SCE was used for reference electrode, and gold wire micro electrode as working electrode. During the electroanalysis process, we used nitrogen to aerify the solutions and keep it on inert atmosphere over reaction. Sodium hydroxide was used for electrolyte solution. Electroanalysis activity of NPCE electrode for uric acid analysis in human urine using cyclic voltammetry evaluated using validation method. This study presented that the precision, recovery, linearity, limit of quantitation (LOQ) and limit of detection (LOD) were 6.32%, 100.95%, 0.998, 1.98 mg/dL, and 0.59 mg/dL, respectively. The NPCE electrode conclusively is an excellent electrode for uric acid analysis in human urine using cyclic voltammetry method.
Keywords: validation, uric acid, human urine, gold, cyclic voltammetry
1. INTRODUCTION
media in considerable rate [1]. Ni electrode has higher stability and good electrooxidation of organic compounds in KOH solution [2].
Uric acid concentration in serum and urine are within a specific timeframe for the health control. Determination of uric acid in blood and human urine has been done universally for interpreting the sickness such as gout, hyperuricaemia and Lesch-Nyhan. Levels of uric acid in the urine are men from 3.4 to 8.5 mg/dL, women from 2.8 to 7.3 mg/dL and children from 2.0 to 5.5 mg/dL. Uric acid concentration in urine and plasma are identified with various sickness and routinely measured in clinical and biomedical laboratories [3].
Many methods have been reported for routine analysis uric acid such as chromatography [4] but they are complex and time-consuming, spectrophotometry [5], biosensor with enzymatic methods [6,7,8]. The enzymatic methods using uricase widely used to fabricate the uric acid sensor in the blood and human urine samples. The enzymatic methods to determine the uric acid is promising due to their high selectivity, but this method natively more expensive and need more technology of the enzymatic immobility. Electrochemical method gets many attentions on regarding uric acid determination on the human urine sample.
Compared to HPLC, cyclic voltammetry approach was proved as the excellent action, because it is more clean, faster, less cost, no required for sample preparation techniques. Electroanalytical method has an advantage of simple, fast, time-saving, inexpensive, chemically modified sensitive. Electroanalytical method can be used to determine uric acid in the blood and urine [9]. Various materials have been reported as the promising electrode in electro-analysis of uric acid in samples. These materials include glassy carbon [10-15], gold [16], carbon-paste [17] and CeO [18].
Herein, we report the results of investigations of the preparation and application of nickel plating on copper electrode (NPCE) for uric acid analysis in human urine using cyclic voltammetry. NPCE electrode have properties are increase the selectivity, sensitivity and electrochemical nature of the electrode. The evaluations of the electrode were carried out by parameters for validation method for uric acid analysis in human urine using cyclic voltammetry are precision, accuracy, linearity, limit of detection (LOD) and limit of quantitation (LOQ).
2. EXPERIMENT
2.1. Preparation of uric acid solution
Uric Acid 0.1 M solution was prepared by dissolving uric acid powder (weight 1.6811 g) in NaOH 1.0 M 100 mL warm solution on a hotplate with stirrer. Uric acid powder must be entered little by little until it dissolved perfectly. Uric acid solution cooled and placed in a dark glass bottle.
2.2. Solutions and electrolyte
and keep it on inert atmosphere over the reaction. Uric acid solution was formulated with diluting an absolute uric acid with deionized water. The calibration graph is then examined by using uric acid concentration from 0-0.025 M.
2.3. Preparation of nickel plating on copper electrode (NPCE)
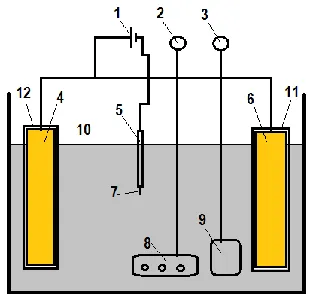
[image:3.596.220.376.345.492.2]Electroplating nickel on copper has been done using NiSO4, NiCl2, H3BO3, brightener and carrier solution. Optimal conditions for electroplating nickel on copper at temperature, pH and time are 55oC, 4.0-4.4, 15-30 minutes, respectively. Cu metals wire (99.99% purity, Aldrich Chemical Company) was used to prepare nickel plating on copper electrode (number 7 at Figure 1). The Cu metal wire electrodes were formulated in by length of 0.5 cm, and wide of 0.1 cm. The nickel plating on copper electrode was connected to silver wire with silver conducting paint prior covered with epoxy gum. Figure 1 represents a schematic diagram of the preparation of nickel plating on copper electrode (NPCE). Nickel plating on copper electrode surface was characterized using Scanning Electron Microscopy (SEM).
Figure 1. A schematic diagram of the Ni electroplating on Cu metal apparatus: (1) DC power supply; (2) electric source for air bubble; (3) electric source for heater; (4) and (6) pure nickel anode; (5) cathode; (7) pure copper cathode; (8) water bubble; (9) heater; (10) plating solution; (11) and (12) canvas
2.4. Experimental
The experiment of cyclic voltammetry used three electrodes system, which are nickel plating on copper electrode (NPCE) as a working electrode (anode). Ag/AgCl (saturated KCl) or SCE as reference electrode and platinum wire as the counter electrode. The electrochemical process of uric acid was conducted in the electrolyte solution at room temperature. The cyclic voltammetry (CV) studies were conducted in 250 mL capacity glass electrochemical cell.
2.5. Determination of precision
with 15 mL standard solution uric acid 0-0.025 M with total volume 25 mL. This solution was entered in electrolysis cell with three electrode system. Precision in this method has been done using standard additions technique with seven replications.
2.6. Determination of recovery
Recovery this method has been done using three solutions with different composition. The first solution with the composition are 5 mL NaOH 0.1 M with 5 mL deionized water and 15 mL uric acid 0.015 M and the measurement of cyclic voltammetry (C1). The second solution is the composition of 5 mL human urine sample with 5 mL NaOH 0.1 M and 15 mL deionized water (C2). The solution is the composition of 5 mL human urine with 5 mL NaOH 0.1 M and 15 mL uric acid standards 0.015 M (C3). This solution was measurement with voltammetry cyclic using three electrode system.
3. RESULT AND DISCUSSION
3.1. Characterization of NPCE material electrode
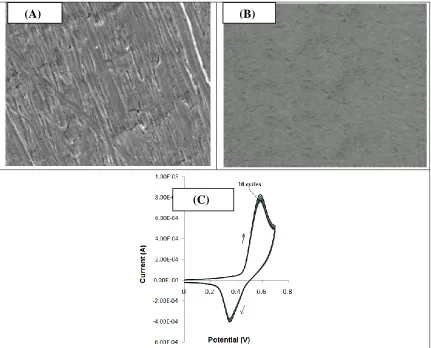
Figure 2. SEM micrographs with magnification 1000x of the surface of a pure nickel (A); nickel plating on copper (NPCE) (B) and (C) cyclic voltammogram with 10 cycles using NPCE electrode in 0.1 M NaOH 5 mL with scan rate 100 mVs-1
(A) (B)
[image:4.596.81.512.346.694.2]
Figure 2A represents the surface morphologies on pure nickel without treatment. Figure 2B shows the surface morphologies of nickel plating on copper. Pure nickel has a rough surface while NPCE have a smooth and flat surface. Figure 2C represents that the effect of continues cycle using in NPCE electrode in 0.1 M KOH. Figure 2C indicates that NPCE electrode was relatively stable in alkaline solution. The stability and reactivity of an electrode was critical in the electroanalytical process. The electrode used in the electroanalytical technique should be reactive and has excellent stability. Figure 2C represents that NPCE electrode has good stability for electrochemical oxidation in KOH.
3.2. The effect of electrolyte on voltammogram uric acid using Ni plating on Cu electrode (NPCE)
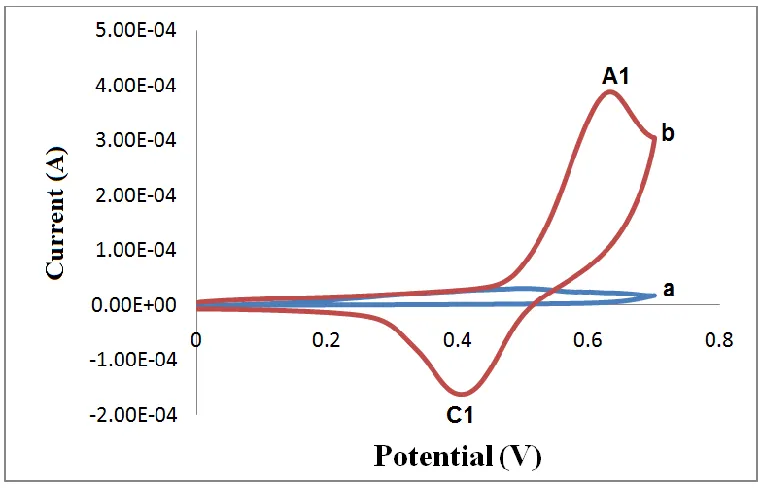
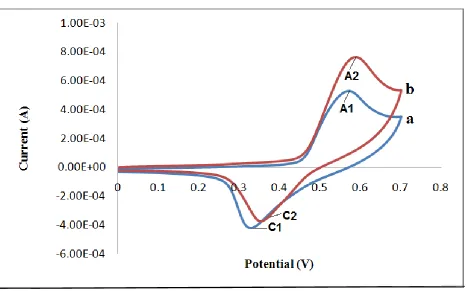
Figure 3A represents that the cyclic voltammogram NPCE electrode in 0.1 M KCl 5 mL (without uric acid). Figure 3B represents the cyclic voltammogram NPCE electrode in 0.1 M KCl 5 mL and 20 mL uric acid 0.003 M. A1 peak is anodic peak (Figure 3B) expresses the oxidation process of ßNi(OH)2 to NiOOH. C1 (cathodic peak) in Figure 3B expresses two forms of crystallographic from oxyhydroxide α and ß. Nickel oxyhydroxide (NiOOH) is capable to oxidize a number of functional groups, for example primary alcohols may be oxidized to carboxylic acids. Nickel has been reported to be an excellent electrode for the oxidation of various organic compounds [19].
[image:5.596.108.487.424.668.2]
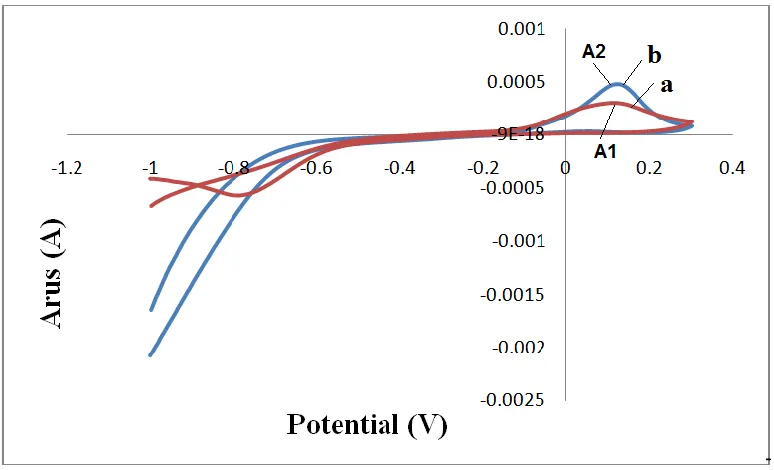
Figure 4. Cyclic voltamograms at Ni plating on Cu electrode (NPCE) in (A) 0.1 M H2SO4 5 mL (without uric acid) and (B) 0.1 M H2SO4 5 mL + 20 mL uric acid 0.003 M with scan rate 100 mVs-1
A redox couple of nickel, i.e., nickel hydroxide (Ni(OH)2) and nickel oxyhydroxide (NiOOH) were presented to be concerned in the oxidation of uric acid to allantoin at nickel electrode in alkaline media. Nickel oxyhydroxide (NiOOH) involved in the reaction that will oxidized uric acid to allantoin. This result supported by some research at studies nickel electrode in potassium chloride and alkaline solution [19, 23-25]. Figure 3A represents that the cyclic voltammogram using the NPCE electrode in KCl (without ethanol). Uric acid 0.003 M was added (Figure 3B), a high peak was observed (A1), which represents the electrochemical oxidation of uric acid peak overlay with Ni (II) peak (Ep anodic).
Figure 4A represents cyclic voltammogram NPCE electrode in 0.1 M H2SO4 5 mL (without uric acid). Figure 4B represents cyclic voltammogram NPCE electrode in 0.1 M H2SO4 5 mL and 20 mL uric acid 0.003 M with scan rate 100 mVs-1. A1 peak at Figure 4A represent is anodic peaks showed at potential 0.1 V. There were three oxidation reactions explaining the acidic solution occurred.
1. The first reaction at potential 0.1 V represent is oxidation reactions Ni (0) to Ni (II), according to the following reactions:
Ni + H2O → (NiOH)ads + H+ + e- (NiOH)ads → (NiOH+)ads + e- (NiOH+)ads + H2O → Ni(OH)2 + H+ Ni(OH)2 + 2H+ → Ni2+ + 2H2O Ni(OH)2 → NiO(Ni2O3)
Total reaction: Ni → Ni2+ + 2e-
[image:6.596.105.492.69.304.2]
H2SO4 + 8e− + 8H+ → H2S + 4H2O Ni2+ + H2S → NiS + 2H+
3. The third reaction is attributed to the formation of a passive NiOOH oxide film and the reduction of H2SO4. The corresponding reaction would be:
H2SO4 + 6e− + 6H+ → S + 4H2O
Ni + H2SO4 → NiOOH + SO2 + H+ + e−
A2 peak at Figure 4B represent is anodic peaks; this peak overlay oxidation between Ni and uric acid. According to Gulmira et al. [27] and Sanli and Aytac [28] the corrosion reactions in the main nickel electrode in acid solution are repeated, but it is seen that when potential moves from anode to cathode the hydrogen release potential shifts to reverse area.
Figure 5. Cyclic voltamograms at Ni plating on Cu electrode (NPCE) in (A) 0.1 M NaOH 5 mL (without uric acid) and (B) 0.1 M NaOH 5 mL + 20 mL uric acid 0.003M with scan rate 100 mVs-1
[image:7.596.67.534.285.576.2]
Uric acid Allantoin
3.3. The effect of uric acid concentration
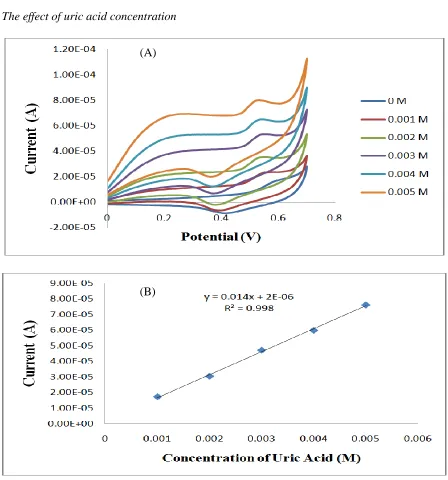
Figure 6. Cyclic voltamograms for uric acid at NPCE electrode: (A) 20 mL uric acid with various concentrations 0.001-0.005 M + 5 mL NaOH 0.1 M, (B) calibration curve from anodic peaks and (C) calibration curve from cathodic peaks. Scan rate 100 mVs-1.
(A)
[image:8.596.69.517.202.682.2]
Figure 6A represents the cyclic voltamograms of uric acid at NPCE electrode in 20 mL uric acid with various concentrations 0.001-0.005 M using 5 mL NaOH 0.1 M as an electrolyte. Figure 6B represents the calibration curve of uric acid concentration for NPCE electrodes. The various concentration of uric acid was linear at a range of 0.001-0.005 M. The Linear regression equation (Figure 6B) is y = 0.014x + 2.10-6. LOD and LOQ of the electrode NPCE towards uric acid were identified as follow 0.59 mg/dL and 1.98 mg/L, respectively.
3.4. Validation methods
3.4.1. Determination of Uric Acid in Human Urine and Precision with Addition Method
(A)
(B)
(A1)
[image:9.596.44.526.270.645.2](C)
(D)
(E)
(C1)
(D1)
[image:11.596.45.527.67.460.2]
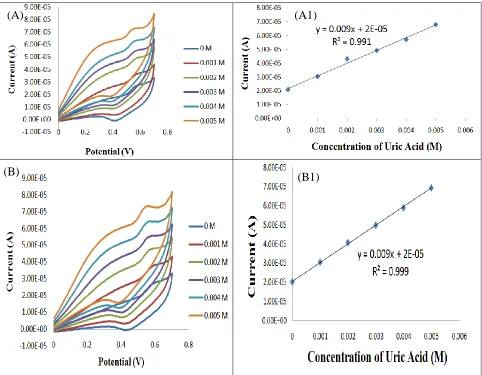
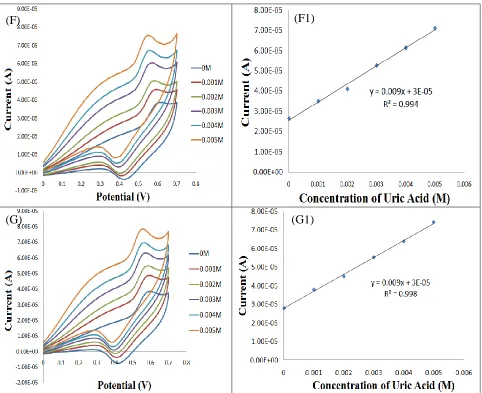
Figure 7. (A-G) Cyclic voltamograms of uric acid at NPCE electrode in 5 mL human urine + 5 mL NaOH 0.1 M + 15 mL uric acid with various concentrations 0-0.025 M and (A1-G1) calibration curve from anodic peaks with standard addition method. Scan rate 100 mVs-1.
Table 1. Concentration of Uric Acid in Human Urine with seven replications
No Concentration of Uric Acid in Human Urine (mg/dL)
1 2.42
2 2.59
3 2.18
4 2.26
5 2.38
6 2.40
7 2.58
Average 2.40
(F)
(G)
(F1)
[image:11.596.115.482.574.727.2]
Uric acid determination in human urine used standard addition method because prevent the matrix effect from the urine sample. From the standard addition curve (Figure 7A1-G1), the correlation value (R2) was 0.994-0.999. Linear regression equation (Figure 7A1) is y = 0.009x + 2.10-5 with slope (b) 0.009 and intercept (a) is 2.10-5. Uric acid concentration in human urine sample is given by a/b, the ratio of the intercept and the slope of the regression line. Calculation of the concentration of uric acid in human urine sample with seven replications can be seen at Table 1.
Figure 6 and Table 1 represented the precision measurement method of the sample by 7 replications. The precision values result (Relative Standard Deviation/RSD) and RSD Horwitz are 6.32% and 9.35%, respectively. This method presented a satisfying precision as below the limit of 9.35% (RSD Horwitz value).
[image:12.596.138.460.308.533.2]3.4.2. Recovery
Figure 8. Cyclic voltamograms for uric acid at Au electrode: (C1) 5 mL human urine + 5 mL NaOH 0.1 M + 15 mL uric acid 0.015 M (C2) 5 mL human urine + 5 mL NaOH 0.1 M + 15 mL aquadest and (C3) 5 mL aquadest + 5 mL NaOH 0.1 M + 15 mL uric acid 0.015 M. Scan rate 100 mVs-1.
C1 is solution contain are 5 mL human urine + 5 mL NaOH 0.1 M + 15 mL uric acid 0.015 M. C2 is solution contain are 5 mL human urine + 5 mL NaOH 0.1 M + 15 mL aquadest and C3 is solution contain 5 mL aquadest + 5 mL NaOH 0.1 M + 15 mL uric acid 0.015 M with scan rate 100 mVs-1. Figure 8 represents cyclic voltammogram from C1, C2 and C3 solution. Peak current for C1, C2 and C3 solution are 0.141 mA, 0.029 mA, 0.110 mA, respectively. Recovery has been calculation using equation as follow:
[image:13.596.69.529.210.307.2]
The recovery values of the analysis are 100.95%. This method has a good recovery as at a range of 95±105 %. Table 2 shows the validation parameters of uric acid analysis in human urine using cyclic voltammetry method on NPCE electrode in 5 mL NaOH 0.1 M. Table 2. represented that this method was very useful for uric acid determination in human urine sample.
Table 2. Validation parameters of uric acid analysis in human urine using cyclic voltammetry method on NPCE electrode in 5 mL NaOH 0.1 M
No Validation Parameters Value
1 Linierity 0.998
2 LOD 0.709x10⁻³ M
3 LOQ 2.360x10⁻³ M
4 Precission 6.32%
5 Recovery 100.95%
Table 3. Comparison of electroanalytical technique and limit of detection (LOD) for determination of uric acid in human urine using different electrodes
No Modified Electrode Electroanalytical Technique LOD (M) References 1 Nickel hexa-cyano ferrate
modified carbon paste
Differential pulse voltammetry 1.80 x 10⁻⁷ [28] 2 Poly (p-aminobenzene sulfonic
acid) (p-ABSA) modified glassy carbon
Differential pulse voltammetry
1.13 x 10⁻⁶
[29]
3 Copper(II)-polydopamine immobilized
Differential pulse voltammetry 2.46 x 10⁻² [30] 4 Indium tin oxide Differential pulse voltammetry 0.30 x 10⁻³ [31] 5 Hexacyanoferrate lanthanum
film
Differential pulse voltammetry 1.00 x 10⁻⁷ [32] 6 Mesoporous carbon
functionalized with ferrocenecarboxylic acid
Amperometric 1.80 x 10⁻³ [33]
7 3-D periodic mesoporous nickel oxide
Cyclic Voltammetry 0.05 x 10⁻⁴ [34] 8 Nickel plating on copper
electrode (NPCE)
Cyclic Voltammetry 0.71 x 10⁻³ This work
[image:13.596.48.544.373.626.2]
human urine with concentrations above the LOD value. This method is suitable uric acid diagnosis in human urine.
4. CONCLUSIONS
Nickel plating on copper electrode (NPCE) electrode was preparation using electroplating method. NPCE was evaluated based on electroanalysis activity for uric acid analysis in human urine using cyclic voltammetry. Validation method for NPCE electrode showed that the precision, recovery, linearity, LOD and LOQ were 6.32%, 100.95 %, 0.998, 0.59 mg/dL, 1.98 mg/dL, respectively. NPCE electrode is a good electrode for uric acid analysis in human urine using cyclic voltammetry method.
ACKNOWLEDGMENTS
We thank to Kementerian Riset, Teknologi, dan Pendidikan Tinggi, Republic of Indonesia for the funding of this research through “Insentif Riset Sinas” Grant at 2015.
References
1. M. Abdallah, I.A. Zaafarany, S.A.E. Wanees and R. Assi, Int. J. Electrochem. Sci., 9 (2014) 1071 2. M.R. Othman, and Riyanto, Int. J. Electrochem. Sci., 7 (2012) 8408
3. Y. Zuo, Y. Yang, Z. Zhu, W. He, and Z. Aydin, Talanta. 83. 5 (2011) 1707 4. R. Zuo, S. Zhou, Y. Zuo, and Y. Deng, Food Chemistry, 182 (2015) 242 5. L. Diogo, Rocha, and R.P. Fábio, Microchemical Journal, 94 (2010) 53
6. K. Jindal, M. Tomar, and V. Gupta, Biosensors and Bioelectronics, 38 (2012) 11
7. R.D. Chaudhari, A.B. Joshi, and R.Srivastava, Sensors and Actuators B: Chemical, 173 (2012) 882
8. K. Arora, M. Tomar, and V. Gupta, Biosensors and Bioelectronics, 30 (2011) 333
9. M. Sadikoglu, G. Saglikoglu, S. Yagmur, E. Orta, and S. Yilmaz, Current Anal. Chem. 7 (2011) 130
10. M. Sadikoglu, G. Taskin, F.G. Demirtas, B. Selvi and M. Barut, Int. J. Electrochem. Sci., 7 (2012) 11550
11. X. Lin and G. Jin, Electrochim. Acta, 50 (2005) 3210 12. X. Lin and Y. Li, Electrochim. Acta, 51 (2006) 5794
13. J.W. Luo, M. Zhang and D.W. Pang, Sens. Actuators B, 106 (2005) 358
14. H.R. Zare, F. Memarzadeh, M.M. Ardakani, M. Namazian and S.M. Golabi, Electrochim. Acta, 50 (2005) 3495
15. H.R. Zare, N. Rajabzadeh and M. M. Ardakani, J. Electroanal. Chem., 589 (2006) 60 16. R.C. Matos, M.A. Augelli, C.L. Lago and L. Agnes, Anal. Chim. Acta, 404 (2000) 151 17. S. Shahrokhian and M. Ghalkani, Electrochim. Acta, 51 (2006) 2599
18. Y.Wei, M. Li, S. Jiao, Q. Huang, Wang and B.G. Fang, Electrochim. Acta, 52 (2006) 766 19. F. Hahn, B. Beden, M.J. Croissant and C. Lamy C, Electrochim Acta, 32 (1987) 1631 20. T.R.L.C. Paixao and M. Bertotti, J Electroanal Chem., 571 (2004) 101
21. F. Hahn, B. Beden, M.J. Croissant and C. Lamy, Electrochim Acta, 31 (1986) 335
24. P. Parpot, S.G. Pires and A.P. Bettencourt, J. Electroanal Chem., 566 (2004) 401
25. S.L. Medway, C.A. Lucas, A. Kowal, R.J. Nichols and D. Johnson, J Electroanal Chem., 587 (2006) 172
26. B. Gulmira, B. Abduali and Y. Satilmis,Oriental Journal of Chemistry, 31, 1 (2015) 141 27. A.E. Sanli and A. Aytac, ECS Transactions, 42, 1 (2012) 3
28. K. Ali, T. Hunde, M. Tirfu, R. Pal and R.C. Saini, International Journal of Pure and Applied Researches, 1, 1 (2015) 43
29. M. Sadikoglu, G. Taskin1, F.G. Demirtas, B. Selvi and M. Barut, Int. J. Electrochem. Sci., 7 (2012) 11550
30. L. Huang, S. Jiao and M. Li, Electrochim Acta, 121 (2014) 233
31. M.M.I. Khan, A.J. Haque and K. Kim, J Electroanal Chem., 700 (2013) 54
32. G. Wang, J. Meng, H. Liu, S. Jiao, W. Zhang, D. Chen and B. Fang, Electrochim Acta, 53, 6 (2008) 2837
33. J.C. Ndamanisha and L. Guo, Biosensors and Bioelectronics, 23, 11 (2008) 1680