A STUDY ON THE ASSOCIATION OF SERUM
URIC ACID IN NEW AND RECENT ONSET
PRIMARY HYPERTENSION
Dissertation submitted to
THE TAMIL NADU DR. M.G.R. MEDICAL UNIVERSITY
in partial fulfillment of the regulations for the award of the degree of
M.D. BRANCH – I GENERAL MEDICINE
K.A.P.V. GOVERNMENT MEDICAL COLLEGE, TIRUCHIRAPPALLI
CERTIFICATE
This is to certify that the dissertation entitled “A STUDY ON THE ASSOCIATION OF SERUM URIC ACID IN NEW AND RECENT
ONSET PRIMARY HYPERTENSION” is the bonafide original work of Dr. R. SARAVANAN in partial fulfillment of the requirements for
M.D. Branch-I (General Medicine) Examination of the Tamil Nadu Dr. M.G.R. Medical University to be held in March 2010.
Prof. Dr. P. KANAGA RAJ, M.D.,
Associate Professor of Medicine, Unit Chief,
K.A.P.V. Govt. Medical College, Trichy – 1.
Prof. Dr. S. PANNEER SELVAM,M.D., Professor & Head of the
Department of Medicine, K.A.P.V. Govt. Medical College,
Trichy – 1.
DEAN
DECLARATION
I Dr. R. SARAVANAN, solemnly declare that dissertation titled, “A STUDY ON THE ASSOCIATION OF SERUM URIC ACID IN NEW AND RECENT ONSET PRIMARY HYPERTENSION” is a
bonafide work done by me at K.A.P.V. Government Medical College, during 2007-2009 under the guidance and supervision of my Unit Chief Prof. Dr. P. KANAGA RAJ, M.D., Associate Professor of Medicine, Chief
– Medical Unit – III.
The dissertation is submitted to the Tamilnadu Dr. M.G.R. Medical University, towards the partial fulfillment of requirement for the award of M.D. Degree (Branch – I) in General Medicine.
Place: Trichy
ACKNOWLEDGEMENT
I owe my thanks to Dr. S. Balasubramanian, M.D., THE DEAN, K.A.P.V. Govt. Medical College and Annal Gandhi Memorial Government Hospital, for allowing me to avail the facilities needed for my dissertation work.
I am grateful to Prof. Dr. S. Panneer Selvam, M.D., Prof. and Head of the Department of Medicine, K.A.P.V. Govt. Medical College for permitting me to do the study and for his encouragement.
I express my gratitude to Prof. Dr. P. Kanaga Raj, M.D., Associate Professor of Medicine and Chief of Medical Unit III, for his valuable assistance and guidance.
I express my gratitude to Registrar / Prof. Dr. M. Sivasankaran, M.D., Department of Medicine and K.A.P.V. Govt. Medical College, for his valuable assistance and guidance.
I owe my thanks to Prof. Dr. Selvapandian, M.D., Professor and Head of the Department of Biochemistry, K.A.P.V. Govt. Medical College for his help and guidance.
I owe my thanks to Dr. A.R. Parveen Gani, M.D., Associate Professor of Community Medicine, Dr. S. Kandasamy, M.D., D.M., Assistant Professor of Medicine, Dr. S. Rajasekaran, M.D., D.M., for their guidance and help during this study.
Last but not least, my sincere thanks to all the patients who co-operated for this study, without whom this study could not have been undertaken and to all my colleagues who helped me and shared their knowledge about this study.
CONTENTS
CHAPTER
NO. TITLE
PAGE NO.
I INTRODUCTION 1
II AIM OF THE STUDY 3
III REVIEW OF LITERATURE 4
IV MATERIALS AND METHODS 32
V OBSERVATIONS AND RESULTS 41
VI DISCUSSION 54
VII CONCLUSION 58
VIII BIBLIOGRAPHY
IX ANNEXURE
1. PROFORMA
CHAPTER
–
I
INTRODUCTION
Hypertension is an increasing important medical and public health
issue. Hypertension markedly increases the risk for myocardial infarction,
stroke, congestive heart failure, peripheral vascular disease and end stage
renal disease.
Worldwide prevalence estimates for hypertension may be as much
as 1 billion individuals, and approximately 7.1 million deaths per year
may be attributable to hypertension.(1) The WHO reports that suboptimal
blood pressure (>115 mm Hg Systolic BP) is responsible for 62% of
cerebrovascular disease and 49% of ischemic heart disease, with little
variation by sex. In addition, suboptimal blood pressure is the number
one attributable risk for death throughout the world.(1)
Approximately 30% of adults are still unaware of their
hypertension, more than 40% of individuals are not on treatment, and two
thirds of hypertensive patients are not being controlled to BP levels less
than 140/90 mm Hg.(1)
Studies of uric acid levels and the development of hypertension
have generally been consistent, continuous, and of similar magnitude.
hyperuricemia precedes the development of hypertension indicates that it
is not simply a result of hypertension per se.(2)
Uric acid is a purine metabolite that in most mammals is degraded
by the hepatic enzyme uricase to allantoin. However, mutations in the
uricase gene occurred during primate development, with the consequence
that humans have relatively higher levels of serum uric acid.
An elevation in serum uric acid has been associated with an
increased risk for the development of hypertension,(4,6) and 25% to 50%
of hypertensive individuals are hyperuricemic6. Hyperuricemia also
confers increased risk for cardiovascular mortality, especially in
women.(6,7) Despite the clinical and epidemiological evidence, many
authorities do not consider an elevated uric acid to be a true
cardiovascular risk factor, because patients with hyperuricemia often
have other well-established risk factors for cardiovascular disease, such
as hypertension, renal disease, obesity, dyslipidemia, and insulin
resistance.
Several studies have found that an elevated uric acid level is an
independent risk factor for cardiovascular disease after controlling for the
CHAPTER
–
II
AIM OF THE STUDY
Numerous studies have reported that hyperuricemia carries an
increased relative risk for hypertension, independent of other risk factors.
The aim of this study is
1. To find the association of hyperuricemia in new-onset and recent
onset Hypertensive patients.
2. To find the association of hyperuricemia in hypertensive patients
with regard to gender and risk factors like smoking, central obesity
and BMI.
3. To find the association of serum uric acid in hypertensive patients
CHAPTER
–
III
REVIEW OF LITERATURE
Hypertension doubles the risk of cardiovascular diseases, including
coronary heart disease (CHD), congestive heart failure (CHF), ischemic
and hemorrhagic stroke, renal failure, and peripheral arterial disease.
Hypertension is often associated with additional cardiovascular disease
risk factors, and the risk of cardiovascular disease increases with the total
burden of risk factors.(10)
MECHANISMS OF HYPERTENSION
1. INTRAVASCULAR VOLUME
The initial elevation of blood pressure in response to vascular
volume expansion is related to an increase of cardiac output; however,
over time, peripheral resistance increases and cardiac output reverts
toward normal.
The mechanism for the “pressure-natriuresis” phenomenon may
involve a subtle increase of glomerular filtration rate, decreased
AUTONOMIC NERVOUS SYSTEM
The autonomic nervous system maintains cardiovascular
homeostasis via pressure, volume and chemoreceptor signals. Adrenergic
reflexes modulate blood pressure over the short term, and adrenergic
function, in concert with hormonal and volume-related factors,
contributes to the long-term regulation of arterial pressure.(10)
RENIN-ANGIOTENSIN-ALDOSTERONE-SYSTEM
The renin-angiotensin-aldosterone system contributes to the
regulation of arterial pressure primarily via the vasoconstrictor properties
of angiotensin II and the sodium-retaining properties of aldosterone.
Angiotensin II is a potent pressor substance, the primary trophic factor for
the secretion of aldosterone by the adrenal zona glomerulosa, and a potent
mitogen stimulating vascular smooth-muscle cell and myocyte growth.
Independent of its hemodynamic effects, Angiotensin II may play a role
in the pathogenesis of atherosclerosis through a direct cellular action on
the vessel wall.(10)
Aldosterone also has effects on nonepithelial targets. Independent
of a potential effect on blood pressure, aldosterone may also play a role in
Pathologic patterns of left ventricular geometry have also been
associated with elevations of plasma aldosterone concentration in patients
with essential hypertension, as well as in patients with primary
aldosteronism.
PATHOLOGIC CONSEQUENCES OF HYPERTENSION
1. HEART
Hypertensive heart disease is the result of structural and functional
adaptations leading to left ventricular hypertrophy, diastolic dysfunction,
CHF, abnormalities of blood flow due to atherosclerotic coronary artery
disease and microvascular disease and cardiac arrhythmias.
Diastolic dysfunction is an early consequent of
hypertension-related heart disease and is exacerbated by left ventricular hypertrophy
and ischemia.
2. BRAIN
Hypertension is an important risk factor for brain infarction and
hemorrhage. The incidence of stroke rises progressively with increasing
blood pressure levels, particularly systolic blood pressure in individuals
>65 years.(10)
autoregulation of cerebral blood flow at the upper pressure limit, resulting
in vasodilation and hyperperfusion. Untreated hypertensive
encephalopathy may progress to stupor, coma, seizures, and death within
hours.
3. KIDNEY
Hypertension is a risk factor for renal injury and ESRD. The
increased risk associated with high blood pressure is graded, continuous,
and present throughout the entire distribution of blood pressure above
optimal. Renal risk appears to be more closely related to systolic than to
diastolic blood pressure.
The atherosclerotic, hypertension-related vascular lesions in the
kidney primarily affect the preglomerular arterioles, resulting in ischemic
changes in the glomeruli and postglomerular structures. Glomerular
pathology progresses to glomerulosclerosis, and eventually the renal
tubules may also become ischemic and gradually atrophic.
Clinically, macroalbuminuria (a random urine albumin/creatinine
ratio > 300 µg/mg) or microalbuminuria (a random urine albumin /
4. PERIPHERAL ARTERIES
Hypertensive patients with arterial disease of the lower
extremities are at increased risk for future cardiovascular disease. The
ankle-brachial index is a useful approach for evaluating Peripheral
Arterial Disease and is defined as the ratio of noninvasively assessed
ankle to brachial (arm) systolic blood pressure. An ankle-brachial index
< 0.90 is considered diagnostic of Peripheral Arterial Disease.
DEFINING HYPERTENSION
From an epidemiologic perspective, there is no obvious level of
blood pressure that defines hypertension. The multiple Risk Factor
Intervention Trial (MRFIT), which included > 350,000 male participants,
demonstrated a continuous and graded influence of both systolic and
diastolic blood pressure on CHD mortality.
Cardiovascular disease risk doubles for every 20-mmHg increase in
systolic and 10-mmHg increase in diastolic pressure. Among older
individuals, systolic blood pressure and pulse pressure are more powerful
predictors of cardiovascular disease than diastolic blood pressure.(1,10)
CRITERIA
≥ 120/75 mmHg. These levels approximate a clinic blood pressure of
≥140/90 mm Hg.(1,10)
Classification of Blood Pressure for Adults
Based on the seventh report of JOINT NATIONAL
COMMITTEE ON PREVENTION, DETECTION, EVALUATION
AND TREATMENT OF HYPERTENSION (JNC 7).
Table – 1
JNC VII Classification
Blood Pressure Classification Systolic, mmHg Diastolic, mmHg
Normal < 120 and < 80
Prehypertension 120-139 or 80-89
Stage 1 hypertension 140-159 or 90-99
Stage 2 hypertension ≥ 160 or ≥ 100
Isolated systolic hypertension ≥ 140 and ≤ 90
ACCURATE BLOOD PRESSURE MEASUREMENT
The accurate measurement of BP is the sine qua non for successful
Persons should be seated quietly for at least 5 minutes in a chair
(rather than on an examination table), with feet on the floor, and arm
supported at heart level. Caffeine, exercise and smoking should be
avoided for at least 30 minutes prior to measurement. Measurement of BP
in the standing position is indicated periodically, especially in those who
report symptoms consistent with reduced BP on standing. An
appropriately sized cuff (cuff bladder encircling at least 80% of the arm)
should be used to ensure accuracy. At least two measurements should be
made and the average recorded.
For manual determinations, palpated radial pulse obliteration
pressure should be used to estimate SBP; the cuff should then be inflated
20 to 30 mm Hg above this level for the auscultatory determinations; the
cuff deflation rate for auscultatory readings should be 2 mm Hg per
second. SBP is the point at which the first of two or more Korotkoff
sounds is heard (onset of phase 1), and the disapperance of Korotkoff
sound (onset of phase 5) is used to define DBP.
In certain conditions like Aortic Regurtitation, the diastolic BP will
be 0 mm Hg and the appearance of muffled sound is taken as diastolic
BP. Care should be taken while measuring BP in elderly patients as there
Recommendations for Follow-Up Based on Initial Blood Pressure
Measurements for Adults without Acute End Organ Damage (JNC-7)
Initial Blood Pressure, mm Hg* Follow-Up Recommended+
Normal Recheck in 2 years
Prehypertension Recheck in 1 year
Stage 1
Hypertension Confirm within 2 months #
Stage 2 Hypertension
Evaluate or refer to source of care within 1 month. For those with higher
pressures (eg, > 180/110 mm Hg), evaluate and treat immediately or within 1 week depending on clinical
situation and complications.
* If systolic and diastolic categories are different, follow recommendations for shorter time follow-up (e.g, 160/86 mm Hg should be evaluated or referred to source of care within 1 month).
+ Modify the scheduling of follow-up according to reliable information about past BP measurements, other cardiovascular risk factors, or target organ disease.
# Provide advice about lifestyle modifications.
The key messages of JNC – VII are:(1)
Ø In those older than age 50, systolic blood pressure of greater than
140 mm Hg is a more important cardiovascular disease (CVD) risk
factor than diastolic BP.
Ø Beginning at 115/75 mm Hg, CVD risk doubles for each increment
Ø Prehypertensive individuals require health promoting lifestyle
modifications to prevent the progressive rise in blood pressure and
Cardio Vascular Disease.
Ø For uncomplicated hypertension, thiazide diuretic should be used
in drug treatment for most patients, either alone or combined with
drugs from other classes.
Ø Two or more antihypertensive drugs will be required to achieve
goal BP (<140/90 mm Hg or <130 mm Hg) for patients with
diabetes and chronic kidney disease.
Ø For patients whose BP is more than 20 mm Hg above the systolic
BP goal or more than 10 mm Hg above the diastolic BP goal,
initiation of therapy using two agents, one of which usually will be
a thiazide diuretic, should be considered.
CLINICAL DISORDERS OF HYPERTENSION
1. ESSENTIAL HYPERTENSION
2. METABOLIC SYNDROME
3. RENOVASCULAR HYPERTENSION
4. PRIMARY ALDOSTERONISM
7. MISCELLANEOUS CAUSES OF HYPERTENSION
Obstructive sleep apnea, Coarctation of the aorta, acromegaly,
hypercalcemia, both hypo and hyper thyroidism.
8. MONOGENIC HYPERTENSION
ESSENTIAL HYPERTENSION
Essential hypertension tends to be familial and is likely to be the
non-sequence of an interaction between environmental and genetic
factors. The prevalence of essential hypertension increases with age. In
the majority of patients with established hypertension, peripheral
resistance is increased and cardiac output is normal or decreased;
however, in younger patients with mild or labile hypertension, cardiac
output may be increased and peripheral resistance may be normal.
High-renin patients may have a vasoconstrictor form of
hypertension, whereas low-renin patients may have a volume-dependent
URIC ACID METABOLISM
Uric acid is the final breakdown product of purine degradation in
humans. Urates, the ionized forms of uric acid, predominate in plasma
extracellular fluid and synovial fluid, with ~98% existing as monosodium
urate at pH 7.4.(11)
The pH of urine greatly influences the solubility of uric acid.
Although purine nucleotides are synthesized and degraded in all tissues,
urate is produced only in tissues that contain xanthine oxidase, primarily
the liver and small intestine. Urate production varies with the purine
content of the diet and the rates of purine biosynthesis, degradation, and
salvage. Normally, two-third to three-fourth of urate is excreted by the
kidney, and most of the remainder is eliminated through the intestine.
METABOLISM
The kidneys clear urate from the plasma and maintain physiologic
balance by utilizing specific organic anion transporters (OATs) including
urate transporter 1 (URATI) and human uric acid transporter (hUAT).
URAT1and other OATs carry urate into the tubular cells from the apical
side of the lumen. Once inside the cell, urate must pass to the basolateral
hUAT. Until recently, component model has been used to describe the
renal handling of urate / uric acid. The methods are
(1) Glomerular filtration,
(2) Tubular reabsorption
(3) Secretion, and
(4) Postsecretory reabsorption.
URAT1 is a novel transporter expressed at the apical brush border
of the proximal nephron. Uric acid compounds directly inhibit URAT1 on
the apical side of the tubular cell (so-called cis-inhibition).(11)
The total-body urate pool is the net result between urate production and excretion
Urate production is influenced by dietary intake of purines and the
rates of de novo biosynthesis of purines from nonpurine precursors,
nucleic acid turnover, and salvaging phosphoribosyltransferase activities.
The formed urate is normally excreted by urinary and intestinal routes.
Hyperuricemia can be caused by increased production, decreased
excretion, or a combination of mechanisms. When hyperuricemia exists,
URIC ACID TURNOVER AND METABOLISM
De novo
biosynthesis Nucleic acids
Nucleotides
Diet Nucleosides
Bases
Urate
Urine Intestine
HYPERURICEMIA
Hyperuricemia is defined as a plasma (or serum) urate
concentration > 6.0mg/dl in females and > 7.0mg/dl in males.(2,11,12)
CAUSES OF HYPERURICEMIA
Hyperuricemia may be classified as primary or secondary
depending on whether the cause is innate or is the result of an acquired
disorder.
However, it is more useful to classify hyperuricemia in relation to
the underlying pathophysiology, i.e., whether it results from increased
Classification of hyperuricemia by pathophysiology
Urate Overproduction
Primary idiopathic Myeloproliferative diseases
Rhabdomyolysis
HPRT deficiency Polycythemia vera Exercise
PRPP synthetase Overactivity
Psoriasis Alcohol
Hemolytic processes Paget’s disease Obesity
Lymphoproliferative diseases
Glycogenosis III, V, and
VII
Purine-rich diet
Decreased Uric Acid Excretion
Primary idiopathic Starvation ketosis Drug ingestion
Renal insufficiency Berylliosis Salicylates (> 2 g/d)
Polycystic kidney disease
Sarcoidosis Diuretics
Diabetes insipidus Lead intoxication Alcohol
Hypertension Hyperparathyroidism Levodopa
Acidosis Hypothyroidism Ethambutol
Lactic acidosis Toxemia of pregnancy
Pyrazinamide
Diabetic ketoacidosis Bartter’s syndrome Nicotinic acid
Down syndrome Cyclosporine
Combined Mechanism
Alcohol Glucose-6-phosphatase
deficiency
Fructose-1-phosphate
HISTORY OF URIC ACID AND HYPERTENSION
The concept that uric acid may be involved in hypertension is not a
new one. In fact, in the paper published in 1879 that originally described
essential hypertension, Frederick Akbar Mohamed noted that many of his
subjects came from gouty families. He hypothesized that uric acid might
be integral to the development of essential hypertension.(13)
Ten years later, this hypothesis reemerged when Haig(14) proposed
low-purine diets as a means to prevent hypertension and vascular disease.
In 1909, the French academician Henri Huchard noted that renal
arteriolosclerosis (the histologic lesion of hypertension) was observed in
three groups: Those with gout, those with lead poisoning, and those who
have a diet enriched with fatty meat. All of these groups are associated
with hyperuricemia.(15)
The association between elevated serum uric acid and hypertension
was observed and reported repeatedly in the 1950s to 1980 but received
relatively little sustained attention because of the lack of a mechanistic
explanation.(16-18)
hypertension is > 70%.(21) Despite these observations, the lack of a causal
mechanism led to mild elevations of serum uric acid being largely
ignored in medical practice.
The strength of the relationship between uric acid level and
hypertension decreases with increasing patient age and duration of
hypertension, suggesting that uric acid may be most important in younger
subjects with early-onset hypertension. (18)
Cross-sectional studies have consistently noted that more than a
quarter of patients with untreated hypertension have elevated serum
UA.(19,22) Serum UA levels have also been associated cross-sectionally
with BP(18,23,24) and longitudinally with hypertension incidence (4,5,27-29)
and future increases in BP.(30)
Mild hyperuricemia in the Rat, an animal model for essential hypertension
The study of mild hyperuricemia required an animal model before
the lack of any mechanistic detail that had plagued the hypothesis over
100 years could be addressed.
In the late 1990s, Johnson and Colleagues(31) developed a model
using a pharmacologic inhibitor of urate oxidase, oxonic acid, that allows
uric acid concentrations from 0.5 to 1.4 g/dl to 1.7 to 3.0 mg/dl. During a
7-wk treatment period, systolic BP increases an average of 22 mmHg.
The increase in BP can be prevented entirely by the co-administration of
the xanthine oxidase inhibitor allopurinol or by the uricosuric agent
benziodarone, indicating linearly related to the rise in uric acid (r = 0.77).
Histologic evaluation of the renal tissue of the hyperuricemic,
hypertensive rats reveals an expansion of the vascular smooth muscle and
narrowing of the lumina of the afferent arterioles. It is interesting that the
development of arteriolosclerosis can be prevented using allopurinol to
control uric acid levels; however, hydrochlorothiazide, which normalizes
BP without lowering serum uric acid, does not prevent the development
of arteriolosclerosis, indicating that uric acid, not hypertension, is the
causative stimulus.(22,32)
These experimental results indicate that mild hyperuricemia
induces renal inflammation, activation of the renin-angiotensin system,
and downregulation of nitric oxide production, all of which are
potentially important pathways that lead to uric acid-mediated
Recent in vitro studies also have elucidated the possible
mechanism of uric acid-mediated arteriolosclerosis. Primary human
vascular smooth muscle cells (HVSMC) are induced to proliferate by
addition of uric acid to the growth medium in a dose-dependent
manner.(33) The human smooth muscle cells express the urate-transport
channel URAT1 as evidenced by both Northern and Western analyses.
Consistent with this observation, cultured HVSMC rapidly take up
C-urate, and blockade of this uptake by probenecid attenuates the uric
acid-mediated induction of proliferation in a dose-dependent manner.(34)
Signaling studies have revealed further the possible mechanism by which
urate uptake leads to HVSMC proliferation.(33,35,36)
The effect of uric acid on vascular smooth muscle cells (VSMC)
Uric acid is taken up through the probenecid-sensitive
urate-transport channel URAT1. This leads to mitogen-activated protein kinase
activation and extracellular signal-regulated kinase 1 and 2 (Erk ½)
Phosphorylation. In turn, transcription factors NF-β (nuclear transcription
factor) and AP1 are activated leading to increased cyclo-oxygenase-2
(COX-2) expression and activity. The COX-2 product Thromboxane A2
induce VSMC proliferation and macrophage infiltration,
respectively.(33,35,36)
REMNANT KIDNEY MODEL
Various studies have investigated the effect of uric acid on
multiple mechanisms of progressive renal injury. In the remnant kidney
model, Hyperuricemic remnant kidney rats (caused by addition of 2%
oxonic acid to their diets) had higher BP, greater proteinuria, and higher
serum creatinine.(37,38) Addition of oxonic acid to cyclosporine treatment
led to higher uric acid levels, more severe arteriolar hyalinosis,
macrophage infiltration, and tubulointerstitial damage compared with rats
that were treated with cyclosporine alone.(39) Furthermore treatment of
cyclosporine-exposed rats with allopurinol improves GFR(39), and in
human liver transplant patients who were receiving cyclosporine,
treatment with allopurinol resulted in improved renal function.(40)
RECENT EPIDEMIOLOGY: A CHANGE IN PERSPECTIVE
Before 1990, only Khan et al.(27) had reported that an increased
systolic BP.(41) Three reports indicated that serum uric acid is an
independent risk factor for hypertension were published in the
1990s(25,26,29) and five more were published in the past 4 yrs(28,30,42,43,44),
including two in the first month of 2005 (Table 2). The recent evaluation
of a subset of the Framingham Heart Study found that serum uric acid
level was an independent predictor of hypertension and BP progression
over as little as 4 yrs.(44)
Uric acid and essential hypertension in children
In adolescents, the association between elevated serum uric acid
and the onset of essential hypertension is even more striking. The
Moscow Children’s Hypertension study found hyperuricemia
(> 8.0 mg/dl) in 9.5% of children with normal BP, 49% of children with
borderline hypertension, and 73% of children with moderate and severe
hypertension.(45)
The Hungarian Children’s Health Study followed all 17,624
children who were born in Budapest in 1964 for 13yrs and found that
significant risk factors for the development of hypertension were elevated
heart rate, early sexual maturity, and hyperuricemia.(46)
had normal BP. The hypertensive children had both elevated serum uric
acid (mean > 6.5 mg/dl) and higher peripheral renin activity.
Feig and Johnson observed that the mean serum uric acid level
(±SD) in control subjects and children with white coat hypertension were
nearly identical but slightly higher in secondary hypertension (4.3 ± 1.4
mg/dl, respectively; P = 0.80) but very high in children with primary
hypertension (6.7 ± 1.3 mg/dl; P = 0.004) (38). There was a tight, linear
correlation between the serum uric acid levels and the systolic and
diastolic BP in patients who were referred for evaluation of hypertension
(r = 0.8 for systolic BP and r = 0.6 for diastolic BP).(24)
Among patients who were referred for evaluation of hypertension,
a serum uric acid > 5.5 mg/dl had an 89% positive predictive value for
essential hypertension, whereas a serum uric acid level <5.0 had a
negative predictive value for essential hypertension of 96%.(24)
The results from both animal and human studies strongly implicate
uric acid as a factor in the onset of essential hypertension and as a
2. An elevated uric acid level is observed in 25-60% of patients with
untreated essential hypertension and in nearly 90% of adolescents with
essential hypertension of recent onset.(24)
3. Raising the uric acid level in rodents results in hypertension with the
clinical, hemodynamic, and histologic characteristics of
hypertension.(31)
4. Reducing the uric acid level with xanthine oxidase inhibitors lowers
blood pressure in adolescents with hypertension of recent onset.(48)
MECHANISM OF HYPERTENSION IN HYPERURICEMIA - RAT MODEL
Most mammals have a low serum uric acid level because of the
presence of uricase, a hepatic enzyme that degrades uric acid to allantoin.
However in humans the uricase gene is mutated resulting in uric acid
levels that are both higher and less regulatable than in other mammals.
Interestingly when mild hyperuricemia was induced in rats by the
administration of a uricase inhibitor, they became hypertensive.
Hypertension in this model was mediated by 2 mechanisms.
1. Uric acid induced renal vasoconstriction mediated by endothelial
dysfunction with reduced NO levels and by activation of the
occurs even in the presence of a low-salt diet, and it responds to lowering
of uric acid.
2. Later, however, the hyperuricemia causes progressive renal
microvascular disease (a lesion resembling arteriolosclerosis), and once
sufficient narrowing of the arteriolar lumen occurs, a component of the
hypertension becomes salt-driven, renal-dependent, and independent of
uric acid levels.
The identification of a biological mechanism by which uric acid
could cause hypertension in humans has led to a renewed interest in the
role of uric acid in hypertension. Indeed, there are now 10 studies that
have examined whether an elevated uric acid level predicts the
development of hypertension, and all found uric acid predictive.
The Bogalusa Heart study, found that uric acid levels in childhood
predict the development of diastolic hypertension 10 years later. The
second study, from the Framingham group(44), also found uric acid to
predict the development of hypertension. This latter study is all the more
remarkable as it was performed in an older population (mean age 50) in
PROPOSED MECHANISM FOR URIC ACID MEDIATED
HYPERTENSION IN HUMANS(2)
Excessive intake of fructose or purine-rich meats or exposure to
low doses of lead may result in chronic hyperuricemia. Mothers with
high uric acid levels that are the result of diet or conditions such as
preexisting hypertension, obesity, or preeclampsia may transfer uric acid
into the fetal circulation through the placenta, which may ultimately
contribute to intrauterine growth retardation (IUGR) and a reduction in
nephron number. Among babies born with a low nephron number,
hyperuricemia may develop in childhood because of genetic or
environmental factors. Chronic hyperuricemia would stimulate the
renin-angiotensin system and inhibit release of endothelial nitric oxide
contributing to renal vasoconstriction and possibly increasing blood
pressure. Persistent renal vasoconstriction may contribute to
arteriolosclerosis and the development of salt-sensitive hypertension,
PROPOSED MECHANISM FOR URIC ACID MEDIATED
HYPERTENSION IN HUMANS (2)
Maternal Factor Placental Factor Uric acid? IUGR
Low nephron number Genetic or
environmental factors Purine-rich or
fructose-heavy diet or exposure to lead
Increased uric acid
Increased renin and decreased Nitric Oxide
Interstitial inflammation Microvascular inflammation Afferent arteriopathy Interstitial fibrosis
Decreased nitric oxide and increased ROS
Vascular inflammation
Proliferation of vascular smooth muscle cells with inhibition of endothelial cell growth
Early stage
Uric-acid-induced vasoreactive hypertension
Late stage
Table - 2
Epidemiological studies suggested that serum uric acid predicts hypertension
Author Year
published Study size
Duration of Follow-up (yr)
Increased Risk
Kahn et al.(27) 1972 10,000 men
5 2-fold
Selby et al.(26) 1990 2062 adults 6 3-fold
Hunt et al.(29) 1991 1482 adults 7 2-fold
Jossa et al.(25) 1994 619 men 12 1.2-fold
Taniguchi et al.(42) 2001 6356 men 10 2-fold
Masuo et al.(30) 2003 433 men 5 +27 mmHg in systolic BP per each
1-mg/dl change in
uric acid
Nakanishi et al.(28) 2003 2310 men 6 1.6-fold
Nagahama et al.(49) 2004 4489 adults 23 1.5-fold in men
Alper et al.(43) 2005 577 children
11 Predicts diastolic hypertension
Sundstrom et al.(44) 2005 3119 adults 4 1.5-fold
CHAPTER
–
IV
MATERIALS AND METHODS
Study Setting
Annal Gandhi Memorial Government Hospital and K.A.P.
Viswanatham Government Medical College, Trichy. The collaborative
department was Department of Biochemistry, K.A.P. Viswanatham
Government Medical College.
Study design
Analytical study.
Period of study
October 2008 to September 2009.
Ethical Committee Approval
The study was approved by the Ethical Committee, Trichy.
Patient Population
Cases
One hundred adults aged between 20-50 years were selected for the
Gandhi Memorial, Government Hospital, Trichy. They were studied for
Serum Uric acid levels.
Controls
Normotensive controls (n = 100) were selected for the study and
evaluated for clinical and laboratory data.
Both males and females were included for the study. All subjects
and controls had normal renal function (Renal biochemistry, USG
Abdomen).
Inclusion Criteria
1. Hypertensive patients, whom are of new-onset and recent onset
(<1 yr) without any target end organ damage.
2. Age group between 20 to 50 years.
3. Both sexes were included.
4. Stage 1 and stage 2 Hypertension according to JNC-VII.
Exclusion Criteria
1. Hypertensive patients with Target End Organ damage
3. Hypertensive Retinopathy
2. Diabetes Mellitus – Type 1 and Type 2 or metabolic syndrome
3. Patients with Chronic kidney disease.
4. Hypertensive Patients with known Cerebro vascular disease.
5. Hypertensive Patients with coronary Artery disease - Myocardial
Ischemia or Infarction.
6. Patients with long term drug intake like steroids, Anti-Tuberculous
Treatment (ATT), diuretics, antimetabolite or chemotherapy drugs.
7. Patients who were regularly consuming alcohol – Alcohol dependence
subjects - Evidenced by History, liver function tests and USG
Abdomen.
8. Patients of Lympho or Myelo proliferative disorders.
9. Patients who had chronic liver disease and metabolic disorders.
10.Endocrine disorder – Hypothyroid patients.
11.Psoriasis patients.
12.Patients in whom BMI >30.
13. Hypertensive crisis / Malignant Hypertension
Consent
willing for the study were selected after getting an informed and written
consent from them.
Thus, a total of 100 patients were taken up for study who satisfied
the inclusive and exclusion criteria. Similarly, 100 age and sex matched
subjects were kept as control.
There was no conflict of interest and financial support was Nil.
Urinary excretion and urate clearance were not done, only serum
uric acid levels were analysed.
Patient profile
Selected socio-demographic, clinical and laboratory data were
collected from the cases and controls and recorded in proforma.
1. Socio-demographic profile
Ø Age
Ø Sex
Ø Occupation.
Ø Cardiovascular risk factors – smoking, family history
§ Body mass index
§ Waist circumference
§ Pulse
§ Systolic and diastolic blood pressure – Average of 2 BP
measurements
§ Clinical examination
Evaluation of subject and controls
Laboratory analyses, performed in Biochemical laboratory at the
AGM Government Hospital, Trichy included blood tests for the
evaluation of renal parameters, fasting blood sugar, serum electrolytes,
uric acid, lipid profile, thyroid function tests.
§ Complete urinalyses were performed by the pathological faculty.
§ ECG was taken for all the subjects and controls to rule out
coronary artery disease and left ventricular hypertrophy.
§ Fundus examination was done for all subjects.
Definitions used in the present study
1. Hypertension
Hypertension is defined as systolic blood pressure of ≥ 140mmHg
Blood pressure classification: By JNC VII
Normal Systolic, mm Hg Diastolic mm Hg
Pre hypertension 120-139 or 80-89
Stage 1 140-159 or 90 – 99
Stage 2 ≥ 160 or ≥ 100
Isolated systolic hypertension ≥ 140 and < 90
2. Hyperuricemia
Hyperuricemia is defined as serum uric acid level more than > 7.0
mg/dl in Indian men and > 6.0mg/dl in Indian women. (2,11,12)
3. Body Mass Index
It is calculated by using the following formula
= 2
metres in
Height
kg weight
4. Waist circumference
The waist is measured by taking a circumference that gives the
narrowest measurement between the rib cage and the iliac crest. It is an
important component of the diagnostic criteria for the metabolic
Central obesity
According to NCFP: ATP III (National Cholesterol) Education
program Adult Treatment Panel III)
Waist circumference > 102 cm in males > 88 cm in females.
Body Mass Index > 30, is usually classified as obesity. Body mass
index between 25 to 30 should be viewed as medically significant,
especially in the presence of other risk factors like hypertension, diabetes.
Large scale epidemiological studies suggest that cardiovascular morbidity
begins to rise when body mass index > 25, suggesting that the cut off for
obesity should be lowered.
5. Metabolic syndrome
NCEP: ATP III 2001.
Three or more of the following:
1. Central obesity
Waist circumference >102 cm (m) > 88cm (F)
2. Hypertriglyceridemia
Triglycerides ≥ 150mg / dl or specific medication.
3. Low HDL cholesterol: < 40 mg / dl (M) and < 50 mg / dl (F) or
4. Hypertension: Blood pressure ≥ 130 mm Hg systolic BP or ≥ 85 mm
Hg diastolic BP or specific medication.
5. Fasting plasma glucose ≥100 mg/dl or specific medication or
previously diagnosed type 2 diabetes.
Laboratory Data
§ Blood urea estimation was done manually by using urease GLDH
(Glutamate and Lactate De-Hydrogenase) method.
§ Serum creatinine estimation was done by using modified Jaffes
method and calibrated by fully automated random access
Biochemistry analyzer XL 300.
§ Serum uric acid was done by using uricase method and calibrated
by fully automated random access Biochemistry analyzer XL 300.
§ Blood Glucose was estimated by using GOD / POD (Glucose
oxidase and peroxidase) method and estimated by ERBA auto
analyzer.
Principle of Uric acid estimation
1) Uric acid + 2H2O + O2 uricase → Allantoin + CO2 + H2O2.
2) 2H2O2 + 4 Aminopyrine DHBSPeroxidase→ Red Quinolone + H2O
+ HCl
(DHBS – 3,5 – Dichloro – 2-Hyroxy Benzene Sulphonic acid)
Statistical Analysis
Data was entered in Microsoft excel spread sheet and analyzed
statistically using standard statistical software. Significance testing of the
difference between means was done by unpaired 2 – tailed student ‘t’
test, and correlations were assessed by Pearson coefficient. Significance
CHAPTER
–
V
OBSERVATIONS AND RESULTS
The total number of subjects included in this study was 200. Of
these 100 were study cases (Hypertensive without target end organ
damage) and another 100 were controls (Non – Hypertensive).
Both the cases and controls selected were adjusted for age
distribution, Sex, BMI, selected cardio vascular risk factors like smoking,
family history.
At the end of the study, 30 subjects in study group were found to
have metabolic syndrome according to NCEP : ATP III criteria.
Similarly 10 of the 100 controls satisfied the criteria for metabolic
syndrome.
Both the cases and controls whom had met the criteria for
metabolic syndrome were excluded from the study.
Many studies previously published had indicated that
hyperuricemia is also associated with metabolic syndrome, as other
conditions like coronary artery disease, stroke, pre eclampsia, malignant
hypertension and chronic kidney disease.
Table – 1
Selected Subjects for the study
Metabolic Syndrome Cases Controls
+ 30 10
- 70 90
Total 100 100
Subjects finally selected
Cases – 70 Controls – 90
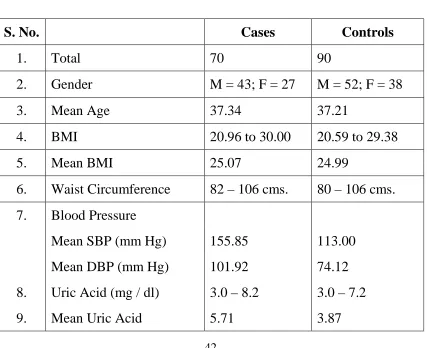
Distribution of Socio-demographic and clinical profile in cases and controls
Table – 2
S. No. Cases Controls
1. Total 70 90
2. Gender M = 43; F = 27 M = 52; F = 38
3. Mean Age 37.34 37.21
4. BMI 20.96 to 30.00 20.59 to 29.38
5. Mean BMI 25.07 24.99
6. Waist Circumference 82 – 106 cms. 80 – 106 cms.
7. Blood Pressure
Analysis of Cases and Controls in Relation to Age
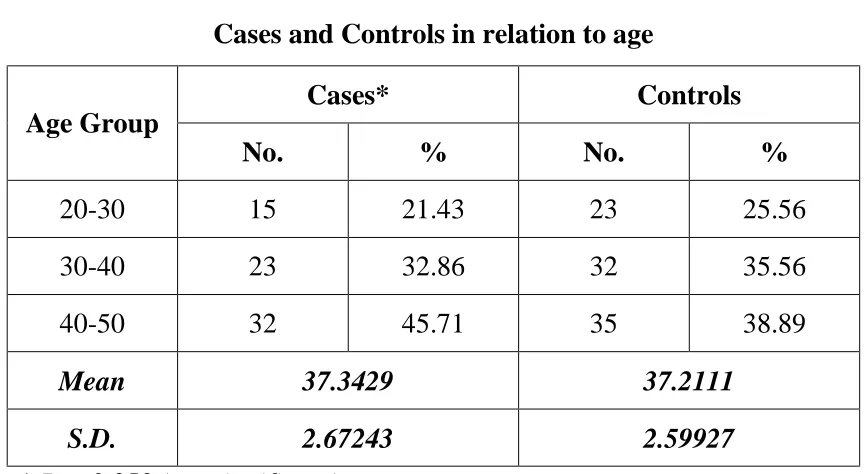
The age of the subjects in both groups ranges from 20 – 50 yrs.
The mean and standard deviation for age of the cases and controls are
37.34 ± 2.7 and 37.21 ± 2.6 respectively, there is no significant difference
among the cases and controls with reference to the age (p = 0.35, not
[image:54.595.99.531.319.556.2]significant).
Table - 3
Cases and Controls in relation to age
Cases* Controls
Age Group
No. % No. %
20-30 15 21.43 23 25.56
30-40 23 32.86 32 35.56
40-50 32 45.71 35 38.89
Mean 37.3429 37.2111
S.D. 2.67243 2.59927
* P = 0.353 (not significant)
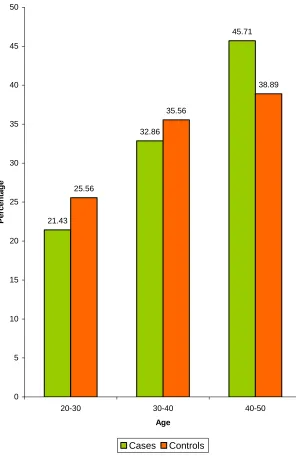
Both the study and control groups are comparable with regard to
Fig. 1
Cases and Controls in relation to age
21.43 32.86 45.71 25.56 35.56 38.89 0 5 10 15 20 25 30 35 40 45 50
20-30 30-40 40-50
Analysis of Cases and Controls with regard to Sex Distribution
In 70 cases the subjects involved in this study are 43 males and 27
females. In 90 controls, there are 52 males and 38 females.
Table - 4
Cases and Controls in relation to gender
Cases* Controls
Sex
No. % No. %
Male 43 61.4 52 57.8
Female 27 38.6 38 42.2
* P = 0.240 (Not significant)
The Sex distribution of the study group and control group does not
Fig. 2
Cases and Controls in relation to gender
61.4
57.8
38.6
42.2
0 10 20 30 40 50 60 70
P
e
rce
nt
a
ge
Male Female
Analysis of cases and controls in relation to BMI
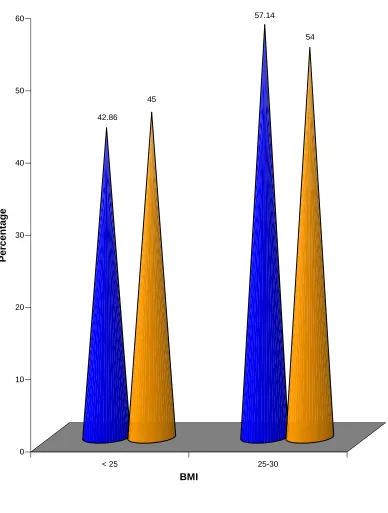
The study subjects whose BMI > 30 are excluded from the study as
BMI >30 has a strong association with hyperuricemia.
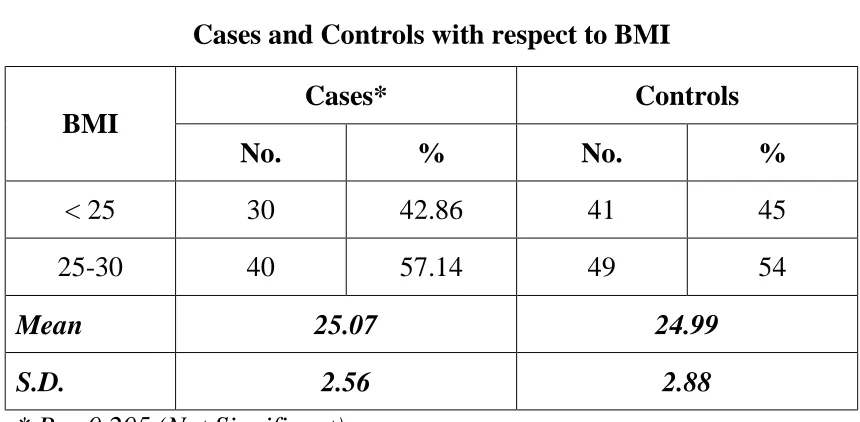
The mean and standard deviation of BMI for the cases and controls
are 25.06 ± 2.5 and 24.99 ± 2.88 respectively. The details are shown in
Table 5 given below.
There is no significant difference among cases and controls with
[image:58.595.100.530.383.594.2]regard to BMI.
Table - 5
Cases and Controls with respect to BMI
Cases* Controls
BMI
No. % No. %
< 25 30 42.86 41 45
25-30 40 57.14 49 54
Mean 25.07 24.99
S.D. 2.56 2.88
* P = 0.205 (Not Significant)
The following bar diagram shows both the study and control
Fig. 3
Cases and Controls with respect to BMI
42.86
45
57.14
54
0 10 20 30 40 50 60
P
e
rce
nt
a
ge
< 25 25-30
Distribution of cases and controls in relation to selected
[image:60.595.97.532.196.575.2]cardiovascular risk factors
Table - 6
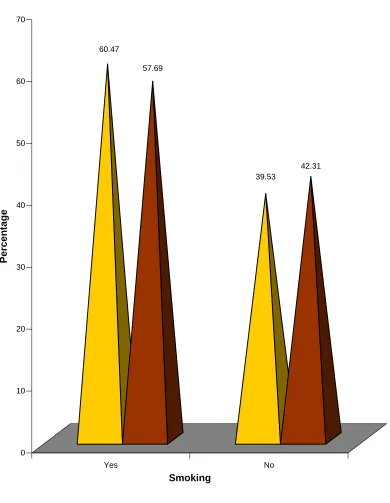
Cases and Controls in relation to Selected Cardiovascular Risk Factor - Smoking (Males)
Cases* Controls
Smoking
No. % No. %
Yes 26 60.47 30 57.69
No 17 39.53 22 42.31
Total 43 100 52 100
P = 0.655 (Not Significant)
Table – 7
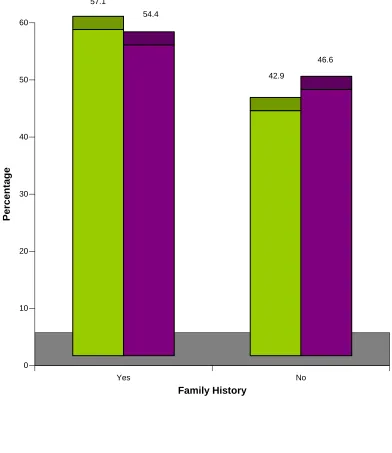
Selected Cardiovascular Risk Factor – Family History
Cases* Controls
Family
History No. % No. %
Yes 40 57.1 49 54.4
No 30 42.9 41 46.6
P = 0.404 (Not Significant)
Fig. 4
Cases and Controls in relation to Smoking (Males)
60.47
57.69
39.53
42.31
0 10 20 30 40 50 60 70
P
e
rce
nt
a
ge
Yes No
Fig. 5
Cases and controls in relation to Family History
Yes No
57.1
54.4
42.9
46.6
0 10 20 30 40 50 60
P
e
rce
nt
a
ge
Family History
Distribution of blood pressure in cases and controls
The mean and standard deviation of systolic blood pressure in
cases and controls are 155 ± 12.7 and 113.00 ± 7.41 respectively.
Similarly, the mean and standard deviation of diastolic blood
pressure in cases and controls are 101 ± 17.35 and 74 ± 8.39 respectively.
Table - 8
Cases and Controls in relation to Blood Pressure
Cases* Controls
Blood Pressure
Mean S.D. Mean S.D.
Systolic 155 12.73 113 7.41
Analysis of Serum Uric Acid in study and control groups
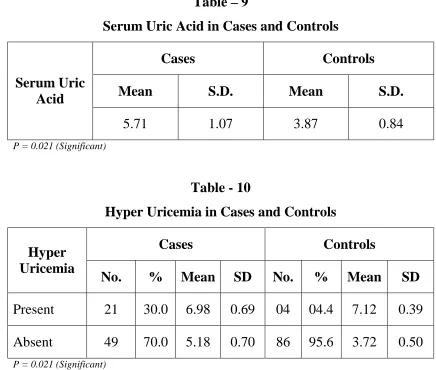
Serum uric acid in the study population and control varied from 3.0
to 8.2 mg/dl and 3.0 to 7.2 mg/dl respectively. The mean and standard
deviation of uric acid among cases is 5.71 ± 1.06, while in control it is
3.87 ± 0.84 respectively.
[image:64.595.95.531.312.682.2]The details are given in the table 9 and table 10 below.
Table – 9
Serum Uric Acid in Cases and Controls
Cases Controls
Mean S.D. Mean S.D.
Serum Uric Acid
5.71 1.07 3.87 0.84
P = 0.021 (Significant)
Table - 10
Hyper Uricemia in Cases and Controls
Cases Controls
Hyper Uricemia
No. % Mean SD No. % Mean SD
Present 21 30.0 6.98 0.69 04 04.4 7.12 0.39
Absent 49 70.0 5.18 0.70 86 95.6 3.72 0.50
Fig. 6
Cases and Controls in relation to Uric Acid
30 4.4 70 95.6 0 10 20 30 40 50 60 70 80 90 100 P e rc en ta ge Present Absent Hyper Uricemia Cases Controls Fig. 7
Mean Uric Acid Level in Cases and Controls
Analysis of Gender Distribution of cases with regard to Serum Uric Acid
The mean of serum uric acid in males is 6.12 ± 0.5 and 5.5 ± 0.7 in
[image:66.595.120.514.255.388.2]females. The details are shown in the following Table 11.
Table – 11
Serum Uric Acid values in relation to gender among cases
Cases Sex
No. Mean SD P
Male 43 6.12 0.49
Female 27 5.50 0.70
0.0309 Significant
From this study mean uric acid levels is higher in males than
Fig. 8
Serum Uric Acid values in relation to gender among cases
6.125
5.5
5.1 5.2 5.3 5.4 5.5 5.6 5.7 5.8 5.9 6 6.1 6.2
Mea
n
UA
Male Female
Serum Uric Acid in relation to BMI in cases
The mean and standard deviation of serum uric acid in study
subjects whose BMI < 25 is 5.50 ± 0.99 and in whose BMI > 25 is
5.86 ± 1.1. The statistical difference found is not significant between the
two groups as the p value = 0.362 (Not significant).
[image:68.595.101.533.320.470.2]The details are shown in Table 12 given below.
Table – 12
Uric acid in relation to BMI in cases
BMI Number Mean of Uric
Acid S.D.
< 25 30 5.50 0.99
> 25 40 5.86 1.10
P = 0.362 (Not Significant)
The study shows the uric acid level between two groups (BMI < 25
and > 25) does not differ. But Nakanishi et al. showed that hyperuricemia
is more correlated with low BMI subjects than high BMI subjects in
Analysis of uric acid in relation to waist circumference abnormality
Table – 13
Waist abnormality and hyper uricemia in cases
Waist Abnormality (Males > 102 cm; Females > 88 cm)
Number Mean of Uric
Acid S.D.
+ 9 5.8889 0.75572
- 61 5.6836 1.10773
P = 0.578 (Not Significant)
Waist circumference is a reliable marker for central obesity. Waist
abnormality is said to be present in males if it is more than 102 cm, and in
females more than 88 cm.
The mean and standard deviation of uric acid in cases with waist
abnormality is 5.88 ± 0.75 and in subjects without waist abnormality is
Analysis of Uric acid in relation to smoking (males)
The mean & standard deviation of uric acid in cases with history of
smoking is 5.3 ± 1.14. Similarly the mean and standard deviation in
cases without history of smoking is 6.27 ± 1.17. There is no significant
difference between the two groups with regard to uric acid as the P value
[image:70.595.102.529.313.459.2]is 0.56.
Table – 14
Smoking and Uric acid in cases
Smoking Number Mean of Uric
Acid S.D.
+ 26 5.38 1.14
- 17 6.27 1.17
Analysis of Uric acid and metabolic syndrome
Out of 100 cases 30 subjects were found to have metabolic
syndrome. Similarly, out of 100 controls 10 subjects were found to have
the syndrome. The mean & standard deviation of uric acid in cases with
metabolic syndrome is 6.13 ± 0.91 and in controls it is 3.68 ± 0.94.
The statistical test shows a significant difference between the two
groups with regard to metabolic syndrome. (P value = 0.039) as also
evidenced by other studies. The details are given in the following table
[image:71.595.99.533.423.582.2]no.15.
Table – 15
Uric acid and metabolic syndrome
Cases Controls
Metabolic syndrome
No. % Mean SD No. % Mean SD
Present 08 27 01 10
Absent 22 73
6.13 0.91
09 90
3.68 0.94
CHAPTER - VI
DISCUSSION
In this study, the relation of serum uric acid to BP in new and
recent onset hypertensive adults without any target end organ damage
was examined. The study was based on strong epidemiologic data that
have linked serum uric acid to hypertension in humans(18,19,22-29) and
experimental animal data, which suggest that hyperuricemia contributes
to hypertension.(31,32)
The experimental studies further demonstrated that hyperuricemia
caused preglomerular vascular disease via a BP-independent pathway (31),
and once vascular changes were established, the hypertension was driven
by the kidney, and lowering uric acid levels was no longer protective.(31)
It is therefore hypothesized that if serum uric acid were important in the
genesis of primary hypertension, then the relation would be greatest in the
new and recent onset hypertensive subjects.
To test this hypothesis, 70 adults of which 43 males and 27 females
strong association among those with lower BMI, a possible relationship
between UA and BMI (< 25 and > 25 kg/m2) was also examined.
The mean age of the study population was 37.3 and 37.2 in both
cases and controls respectively.
Blood pressure in both controls and cases were measured according
to JNC VII classification and the mean blood pressure in cases was 155 /
101 and in controls it was 113 / 74 respectively.
Uric acid was normally distributed among both subjects and was
examined as a continuous variable. The mean plasma uric acid in cases
was 5.7 mg/dl ± 1.0 (range 3.0 to 8.2) and the mean plasma uric acid in
controls was 3.8 mg/dl ± 0.8 (range 3.0 to 7.2). The association between
uric acid and hypertension was analyzed using student ‘t’ test and
statistical difference was assessed by Pearson coefficient.
The study showed a significant difference between the
hypertensive subjects and the normotensive controls (p value = 0.021).
If uric acid was simply a marker, then a similar degree of
hyperuricemia in the control subjects would be expected, and this was not
observed.
Though mean uric acid was higher is subjects with BMI ≥ 25
uric acid and BMI did not show a statistical difference in this study, but
Nakanishi et al. found a stronger association among those with lower
BMI.
Males were found to be more hyperuricemic than females in the
study in which the difference is significant (p = 0.03).
Many studies have showed that hyperuricemia is closely associated
with waist abnormality. The study revealed that there was not a
significant difference between waist abnormality and uric acid in cases
(p = 0.57).
The study also examined a possible relationship between smoking
and hyperuricemia in hypertensive individuals. It was to observe that
whether smoking influences hyperuricemia in hypertension.
The study showed that there is no significant difference between
smoking (present or absent) and hyperuricemia (P = 0.56).
The study also examined a relation between metabolic syndrome
and uric acid. Uric acid is associated with metabolic syndrome as
indicated by various studies. It was also observed that a significant
hypertension. Once microvascular lesion develops, lowering uric acid
levels will not be useful, as the late stage hypertension is uric acid
independent and salt sensitive.
One study showed (48) lowering uric acid levels in adolescent
hypertension resulted in BP reduction. The results represent a new
potential therapeutic approach, although not a fully developed therapeutic
strategy due to potential adverse effects. These preliminary findings
CHAPTER - VII
CONCLUSION
Ø Serum uric acid is strongly associated with BP in new and recent
onset primary hypertension.
Ø An elevated or high–normal serum uric acid value>5.5mg/dl(19,20,24)
(mean uric acid-5.7 in this study) in an adult being evaluated for
hypertension strongly supports the presence of primary
hypertension. The remarkable association of uric acid with BP in
adults is consistent with recent animal model data and the
hypothesis that uric acid might have a pathogenic role in the
development of hypertension.
Ø Males have a higher degree of hyperuricemia than females in
hypertensive patients.
Ø Though mean uric acid is higher in study subjects whose BMI > 25
than those subjects with BMI < 25, the association is not
significant.
Ø There is no stronger association of hyperuricemia in hypertension
Ø There is no significant difference among hypertensive males with
regard to uric acid and smoking. Smoking does not show an
influence on hyperuricemia in cases.
Ø Hyperuricemia is associated with metabolic syndrome, as
CHAPTER - VIII
BIBLIOGRAPHY
1. Chobanian A, Bakris G, Black H, Cushman WC, Green LA, Izzo JL
Jr, Jones DW, Materson BJ, Oparil S, Wright JT Jr, Roccella EJ;
National Heart, Lung, and Blood Institute Joint National Committee
on Prevention, Detection, Evaluation, and Treatment of High Blood
Pressure; National High Pressure Education Program Coordinating
Committee: The Seventh Report of the Joint National Committee.
JAMA 289: 2560-2572, 2003.
2. Daniel Fieg, Duk – Hee Kang – Uric Acid and Cardiovascular risk –
NEJM 2008.
3. Wu X, Muzny DM, Lee CC, Caskey CT. Two independent
mutational events in the loss of urate oxidase during hominoid
evolution. J. Mo Evol. 1992; 34 : 78 – 84.
4. Selby JV, Friedman GD, Quesenberry CP. Precursors of essential
hypertension: pulmonary function, heart rate, uric acid, serum
cholesterol, and other serum chemistries. Am J Epidemiol. 1990;
131:1017 – 1027.
6. Cannon PJ, Stason WB, Demartini FE, Sommers SC, Laragh JH.
Hyperuricemia in primary and renal hypertension. N Engl. J. Med.
1966; 275:457 – 464.
7. Alderman MH, Cohen H, Madhavan S, Kivlighn S. Serum uric acid
and cardiovascular events in successfully treated hypertensive
patients. Hypertension. 1999; 34: 144 – 150.
8. Vaccarino V, Krumholz HM. Risk factors for cardiovascular
disease: one down, many more to evaluate. Ann Intern Med. 1999;
131: 62 – 63.
9. Fang J, Alderman MH. Serum uric acid and cardiovascular
mortality: the NHANES I Epidemiologic Follow – up study. 1971 –
1992. JAMA. 2000; 283:2404 – 2410.
10. Theodore A. Kotchen – Harrison’s principles of Internal medicine –
17th Edition.
11. Robert L. Wortmann – Harrison’s Principles of Internal Medicine –
17th Edition.
12. U.R.K. Rao – API-Textbook of Medicine – 8th Edition.
13. Mohamed FA: On chronic Bright’s disease, and its essential
symptoms. Lancet 1: 399-401, 1879.
14. Haig A: On uric acid and arterial tension. BMJ1: 288-291, 1889.
15. Huchard H: Arteriolosclerosis: Including its cardiac form. JAMA 53:
16. Gertler MM, Garn SM, Levine SA: Serum uric acid in relation to age
and physique in health and in coronary heart disease. Ann Intern
Med 34: 1421-1431, 1951.
17. Breckenrige A: Hypertension and hyperuricemia, Lancet 1: 15-18,
1966.
18. Brand FN, McGee DL, Kannel WB, Stokes J 3rd, Castelli WP:
Hyperuricemia as a risk factor of coronary heart disease: The
Framingham Study. Am J Epidemiol 121: 11-18, 1985.
19. Cannon PJ, Stason WB, Demartini FE, Sommers SC, Laragh JH:
Hyperuricemia in primary and renal hypertension. N Engl J Med
275: 457-464, 1966.
20. Kinesey D, Walther R, Sise HS, Whitelaw G, Smithwick R:
Incidence of hyperuricemia in 400 hypertensive subjects. Circulation
24: 972-973, 1961.
21. Curtis JJ, Luke RG, Jones P, Diethelm AG: Hypertension in
cyclosporine – treated renal transplant recipients is sodium
dependent. Am J Med 85: 134-138, 1988.