Copyright © 2000, American Society for Microbiology. All Rights Reserved.
Global Analysis of Herpes Simplex Virus Type 1 Transcription
Using an Oligonucleotide-Based DNA Microarray†
S. W. STINGLEY,1J. J. GARCIA RAMIREZ,2S. A. AGUILAR,1K. SIMMEN,3 R. M. SANDRI-GOLDIN,1P. GHAZAL,2*ANDE. K. WAGNER1*
Department of Molecular Biology and Biochemistry, University of California, Irvine,1Departments of Immunology and Molecular Biology, The Scripps Research Institute, La Jolla,2and
The R. W. Johnson Pharmaceutical Research Institute, San Diego,3California Received 21 June 2000/Accepted 10 August 2000
More than 100 transcripts of various abundances and kinetic classes are expressed during phases of productive and latent infections by herpes simplex virus (HSV) type 1. To carry out rapid global analysis of variations in such patterns as a function of perturbation of viral regulatory genes and cell differentiation, we have made DNA microchips containing sets of 75-mer oligonucleotides specific for individual viral transcripts. About half of these are unique for single transcripts, while others function for overlapping ones. We have also included probes for 57 human genes known to be involved in some aspect of stress response. The chips effi-ciently detect all viral transcripts, and analysis of those abundant under various conditions of infection dem-onstrates excellent correlation with known kinetics of mRNA accumulation. Further, quantitative sensitivity is high. We have further applied global analysis of transcription to an investigation of mRNA populations in cells
infected with a mutant virus in which the essential immediate-early␣27 (UL54) gene has been functionally
deleted. Transcripts expressed at 6 h following infection with this mutant can be classified into three groups: those whose abundance is augmented (mainly immediate-early transcripts) or unaltered, those whose abun-dance is somewhat reduced, and those where there is a significant reduction in transcript levels. These do not conform to any particular kinetic class. Interestingly, levels of many cellular transcripts surveyed are
in-creased. The high proportion of such transcripts suggests that the␣27 gene plays a major role in the early
decline in cellular gene expression so characteristic of HSV infection.
The application of robotic microarraying techniques and laser-based image analysis has led to the development of DNA microarrays as a powerful tool for the global analysis of tran-scriptional responses of cells and microorganisms to perturba-tions in their environment such as stress (23, 47). The major source of DNA sequences for gene probes are currently cloned fragments, often amplified by PCR, but the relatively afford-able synthesis of oligonucleotides long enough to afford appropriate hybrid stability and specificity (especially strand specificity) provides another approach. The use of defined oligonucleotide probes is especially attractive for the synthesis of microarrays specific for large viral pathogens, and Chambers et al. have reported a highly effective chip for global assay of human cytomegalovirus (human herpesvirus 5) using 75-mers (6). Indeed, this is the first description of a chip for a human pathogen. We have used this approach to synthesize a first-generation chip for the analysis of herpes simplex virus type 1 (HSV-1; human herpesvirus 1) of equivalent specificity and sensitivity.
Despite HSV replication and pathogenesis being phenome-nologically well characterized (see references 53 to 56 for re-cent reviews emphasizing our point of view), there are plenty of gaps remaining in our understanding of its mechanistic
basis. A rapidly resolving initial acute infection is followed by lifelong latent infection interspersed with sporadic reactivation episodes. HSV (as well as other herpesviruses) has a promoter-rich genome. During infection, specific promoters mapping at cognate genes mediate transcript expression. All data suggest that the coordinate regulation of expression of viral transcripts must involve the transcriptional machinery of the cell in toto. A major factor in the control of viral gene expression is the differential activity of promoters whose functional architecture is, in large part, responsible for controlling access to the tran-scriptional machinery of the cell. A second major factor in the regulation of expression of at least some viral genes is the alteration of posttranscriptional processing and transport of viral transcripts mediated by the activity of the immediate-early␣27 (ICP27) gene (42, 50). In this light and in the most general sense, regulation of HSV gene expression can be un-derstood only in light of normal cellular transcription pro-cesses. While viral regulatory proteins operate to drastically alter the regulatory environment of the host cell during infec-tion, their effects are manifest through existing cellular tran-scription factors and enzymes. Two well-studied examples of this fact are the initial activation of immediate-early viral reg-ulatory genes by the potenttrans activator ␣-TIF (UL48) in conjunction with the action of a cellular adapter, Oct-1 (2, 58). And, the global transcriptional activator␣4 (ICP4), itself re-lated to a cellular transcriptional activator (26), functions through stabilization of the binding of TFIID (10).
Global analysis of viral transcription under various con-ditions of infection will provide a powerful tool for further analysis of the HSV transcription program. We have applied sequence-based computer programs and our own databases to select sets of 75-nucleotide (nt) oligonucleotide sequences within * Corresponding author. Mailing address for P. Ghazal:
Depart-ments of Mol. Biol. & Immunology, The Scripps Research Institute, 10055 N. Torrey Pines Rd., La Jolla, CA 92037. Phone: (858) 784-8678. Fax: (858) 784-9272. E-mail: [email protected]. Mailing address for E. K. Wagner: Department of Molecular Biology & Biochemistry, University of California, Irvine, 19172 Jamboree Rd., Irvine, CA 92697. Phone: (949) 824-5370. Fax: (949) 824-8551. E-mail: ewagner @uci.edu.
† Publication no. 13376-IMM from the Scripps Research Institute.
9916
on November 9, 2019 by guest
http://jvi.asm.org/
the HSV-1 genome (Genbank accession number NC001806) that are specific for the expression of individual viral tran-scripts. With an eye toward efficient synthesis of oligo(dT)-primed cDNA from RNA isolated from infected cells and tissues, we have probed the 52 polyadenylation sites known to function in the viral genome. More than half of the total viral transcripts are terminated with a unique polyadenylation site and thus can be uniquely specified with unique oligonucleo-tides adjacent to the polyadenylation sites. Accordingly, we arrayed these oligonucleotide probes on glass slides to gener-ate a first-generation HSV-1 DNA microarray (HSV-chip). We have included a set of cellular oligonucleotide probes specific for a number of transcripts expressed from genes involved in cellular response pathways to provide an indicator of the re-sponse of the cell to virus infection under the conditions sur-veyed here.
We have used nick-translated viral DNA and cloned DNA fragments to optimize hybridization conditions and demon-strate the high specificity of this first-generation chip. We next generated oligo(dT)-primed cDNA labeled with Cy3- and Cy5-tagged fluorescent nucleoside derivatives generated from RNA isolated from cells infected and mock infected with HSV under various conditions, which influence the class of viral and cel-lular genes expressed. Thus, inhibition of de novo protein synthesis allows only expression of immediate-early genes, blockage of DNA replication inhibits expression of strict late genes, isolation of RNA at short times after infection results in high enrichment of early-phase transcripts, and isolation of RNA at a time of high rates of viral genome replication results in preferential recovery of late transcripts. The data presented here demonstrate that all classes of viral transcripts can be detected with good efficiency and very high specificity. Further, a limited set of cellular transcripts are induced following in-fection against a general background of virus-mediated shutoff of cellular gene expression. Measurement of the transcript population abundant in cells infected with a mutant of HSV-1 lacking a functional ␣27 (UL54) gene revealed significantly different patterns of both viral and cellular genes.
MATERIALS AND METHODS
Selection and synthesis of oligonucleotide probes for the microarray.We followed published methodology (6, 47) to select a total of 99 individual 75-mers specific for individual HSV-1 transcription units. The positions of these oligo-nucleotides vis-a`-vis the sequence of the genome of HSV-1 strain 17syn⫹are shown in Table 1. Our overall criteria for choice were as follows. We concen-trated within 300 nt of the polyadenylation [poly(A)] signal for each transcript group because synthesis of cDNA using oligo(dT) primers with the bulky Cy3-and Cy5-tagged dCTP produces a product of average length of less than 500 nt. We then used the commercial Oligo6 program (Molecular Biology Insights, Cascade, Colo.) to scan these sequences and chose 75-mers whose base compo-sition was near the average for the region as a whole and which did not display a large deal of self-homology that would lead to the formation of hairpin loops. Oligonucleotides thus chosen had G⫹C contents ranging from 50 to 80%. Two nonoverlapping oligomers were chosen for all abundant transcripts. Cell genes (GenBank notation) and accession numbers from which specific oligonucleo-tides were synthesized are as follows: ATF3, L19871; JUNC, J04111; CCNA cyclinA, M963390; JUND, NM005354; MAPK, NM002745; MBP-2, X65644; MHC-1, NM005514; MHC-2, AH002891; CvDC25A, NM001789; mlkBa, L32976; CvDC25B, NM004358; NFAT1, U43341, CYCLIN B, M25753; NF-Y, NM002505; CYCLIND1, NM001758; NF-YB, NM006166; E2F1, AH006643; N-SHC, D84361; E2F2, NM004091; p107, NM002895; p130 HSP130K, X76061; p15, U19796; E2F5, NM001951; p16, U12820; EGR1, NM001964; p18, J04991; ELK, NM005229; p19, U71364; FAS-1A, D38122; p21 (PAK1), NM002576; FAS-2, M67454; p27, NM005532; FOS, NM005252; p300, NM001429; FRA1, NM005438; p38 (RPP38), NM006414; p53, AAF63442; p65NFkB, A42017; RARa1, NM000964; RARb, NM000965; RXRb, AF120161; IL6, S56892; INF␣/, M54886; SRF, NM003131; INT6, UP4175; STAT2, NM005419; IRF1, NM002198; STAT5, NM003252; ISG 54K E1, M14659; STAT6, NM003153; ISG 54K E2, M14660; TAP1, L21207; ISG F3g p48, NM000107; JAK3, NM000215; JNK, NM002750; JUN B, NM002229; UNG, NM003362; and JUN-Bta, U20734.
Oligonucleotides were synthesized by using a PE Perseptive Bio-System
[image:2.612.313.551.94.571.2](Fra-mingham, Mass.) Expedite MOSS DNA synthesizer with membrane columns. Synthesized gene target oligonucleotides were cleaved, deprotected, and purified by standard procedures. Probe oligonucleotides were transferred in triplicate to 96-well master plates at a concentration of 1g/l in 3⫻SSC (1⫻SSC is 0.15 M NaCl plus 0.015 M sodium citrate) for robotic deposition.
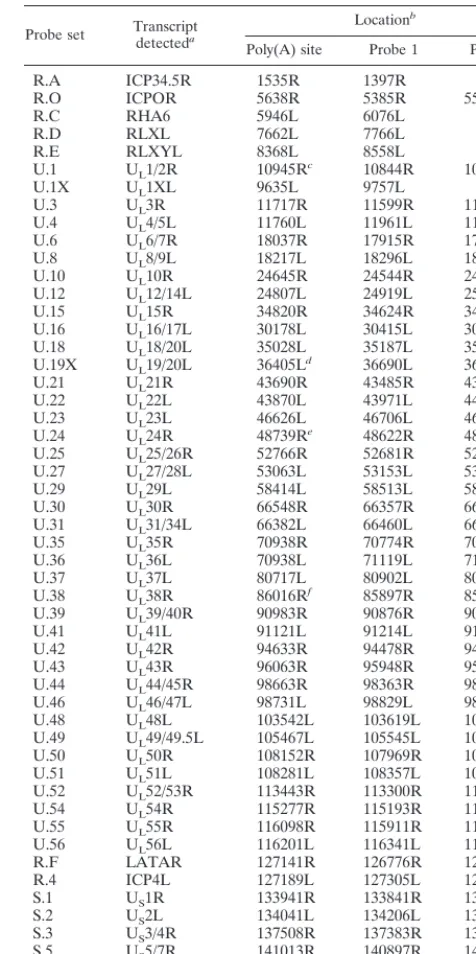
TABLE 1. Locations of specific 75-mer probes on the HSV strain 17syn⫹genome
Probe set Transcriptdetecteda
Locationb
Poly(A) site Probe 1 Probe 2
R.A ICP34.5R 1535R 1397R
R.O ICPOR 5638R 5385R 5535R
R.C RHA6 5946L 6076L
R.D RLXL 7662L 7766L
R.E RLXYL 8368L 8558L
U.1 UL1/2R 10945Rc 10844R 10743R
U.1X UL1XL 9635L 9757L
U.3 UL3R 11717R 11599R 11519R
U.4 UL4/5L 11760L 11961L 11896L
U.6 UL6/7R 18037R 17915R 17840R
U.8 UL8/9L 18217L 18296L 18406L
U.10 UL10R 24645R 24544R 24407R
U.12 UL12/14L 24807L 24919L 25005L
U.15 UL15R 34820R 34624R 34743R
U.16 UL16/17L 30178L 30415L 30375L
U.18 UL18/20L 35028L 35187L 35234L
U.19X UL19/20L 36405Ld 36690L 36483L
U.21 UL21R 43690R 43485R 43611R
U.22 UL22L 43870L 43971L 44061L
U.23 UL23L 46626L 46706L 46816L
U.24 UL24R 48739Re 48622R 48548R
U.25 UL25/26R 52766R 52681R 52571R
U.27 UL27/28L 53063L 53153L 53253L
U.29 UL29L 58414L 58513L 58529L
U.30 UL30R 66548R 66357R 66218R
U.31 UL31/34L 66382L 66460L 66594L
U.35 UL35R 70938R 70774R 70834R
U.36 UL36L 70938L 71119L 71182L
U.37 UL37L 80717L 80902L 80823L
U.38 UL38R 86016Rf 85897R 85936R
U.39 UL39/40R 90983R 90876R 90897R
U.41 UL41L 91121L 91214L 91201L
U.42 UL42R 94633R 94478R 94435R
U.43 UL43R 96063R 95948R 95837R
U.44 UL44/45R 98663R 98363R 98533R
U.46 UL46/47L 98731L 98829L 98932L
U.48 UL48L 103542L 103619L 103695L
U.49 UL49/49.5L 105467L 105545L 105620L
U.50 UL50R 108152R 107969R 108038R
U.51 UL51L 108281L 108357L 108432L
U.52 UL52/53R 113443R 113300R 113225R
U.54 UL54R 115277R 115193R 115091R
U.55 UL55R 116098R 115911R 115896R
U.56 UL56L 116201L 116341L 116282L
R.F LATAR 127141R 126776R 126450R
R.4 ICP4L 127189L 127305L 127390L
S.1 US1R 133941R 133841R 133788R
S.2 US2L 134041L 134206L 134257L
S.3 US3/4R 137508R 137383R 137433R
S.5 US5/7R 141013R 140897R 140937R
S.8 US8/9R 143667R 143514R 143592R
S.12 US10/12L 144139L 144255L 144218L
aR designates rightward transcription; i.e., the sense of the transcript is the same sense as the prototypical genome arrangement. L designates leftward transcription; i.e., the sense of the transcript is opposite genome sense.
bThe number designates the location of the first base of each oligonucleotide read in the sense of transcript. Therefore, probes designated R are read genome sense left to right, and those designated L are read right to left on the comple-mentary DNA strand.
cDifferentially used at early and late times. dWeak poly(A) site.
ePoly(A) site usage is regulated.
fSignificant transcriptional read-through in some cell types.
on November 9, 2019 by guest
http://jvi.asm.org/
Generation of microarrays, hybridization, and scanning.The deposition print-ing of DNA was carried out as described in reference 6. The microarrayer tip delivered approximately 4 nl per spot on prescreened custom-made polylysine-coated glass slides (46, 47; see also http://www.gene-chips.com/). Microarrays were hybridized for 16 h in 5⫻SSC–0.2% sodium dodecyl sulfate (SDS) at 68°C under coverslips with combined Cy5dCTP and Cy3dCTP (Amersham)-labeled DNA. The entire assembly was enclosed in a custom-made hybridization cham-ber. After hybridization, the microarray slide assembly was washed for 5 min in 1⫻SSC–0.2% SDS at room temperature for 5 min, 5 min in 0.1⫻SSC–0.2% SDS at room temperature, and 1 min in 0.1⫻SSC, spun dry in a low-speed centrifuge, and scanned. Microarrays were scanned by using a confocal laser ScanArray 4000 (General Scanning, Inc.) system. Data were collected at a max-imum resolution of 10 m/pixel with 16 bits of depth by using Quantarray software (General Scanning).
Cells and virus.We used HSV-1 (17syn⫹) for kinetic and control experiments. The27lacZmutant, in which a-galactosidase cassette was inserted into the␣27 (UL54) gene to inactivate the protein, was constructed from the KOS strain, and control experiments with this virus were done with the wild-type (wt) parent (40, 49, 52). Cultures of 5 ⫻ 106 HeLa cells in 100-mm2plates were used for infections at a multiplicity of infection of 5 PFU/cell except where indicated otherwise. Cells were maintained at 37°C under 5% carbon dioxide in Eagle minimum essential medium containing 5% calf serum, 100 U of penicillin per ml, and 100g of streptomycin per ml.
RNA preparation, cDNA synthesis, and nick translation.We followed pub-lished procedures (11, 12, 24, 27, 31, 47, 56) to extract total RNA from infected and mock-infected cells. Virus was adsorbed for 30 min prior to addition of fresh overlay medium. For preparation of RNA from cycloheximide and phosphono-acetic acid (PAA)-treated cells, cells were pretreated with drug for 30 min prior to addition of virus, and drug was present in the virus inocula and overlay medium. At appropriate times, cultures were rinsed twice with ice-cold saline containing cycloheximide (50g/ml), scraped and deposited by low-speed cen-trifugation, and then extracted with guanidinium isothiocyanate. Extracted RNA was recovered by pelleting through a 5.7 M CsCl cushion by centrifugation for 16 h at 36,000 rpm in a Beckman SW41 rotor. RNA recoveries were approxi-mately 200g per dish.
Fluorescence-labeled cDNA was prepared from 40-g aliquots of total in-fected or mock-inin-fected cell RNA by oligo(dT)-primed polymerization by using SuperScript II reverse transcriptase (Gibco-BRL). The pool of nucleotides in the labeling reaction consisted of 0.5 mM dGTP, dATP, and dTTP and 0.3 mM dCTP and fluorescent nucleotides (Cy3dCTP and Cy5dCTP; Amersham) at 0.1 mM. All experiments with virus-infected cell RNA or nick-translated viral DNA were carried out with the Cy3 label. Nick-translated DNA was synthesized in a mixture of 50 mM Tris-HCl (pH 7.2), 10 mM MgSO4, and 0.1 mM dithiothreitol with 20m dATP, dTTP, dGTP, and Cy3dCTP. Fluorescence-labeled DNA was purified by chromatography through Microcon YM-30 columns (Amicon), then heat denatured for 2 min at 100°C, and incubated 20 to 30 min at 37°C before use. Hybridization was for 16 h at 68°C using 3⫻SSC–0.3% SDS under a glass coverslip. The array area was ca. 3 cm2, and total hybridization volume was 20l.
RESULTS
Demonstration of hybridization specificity.We first
estab-lished probe specificity. We hybridized chips with probes ar-rayed in triplicate with fluorescence-labeled nick-translated HSV DNA at 65, 68, and 72°C. We found no appreciable cross-hybridization to the cellular probes (data not shown). We
surveyed signal strength and plotted this versus G⫹C content of the probe. We found 68°C to be the best overall tempera-ture, since it provided the strongest hybridization signals with no obvious correlation with G⫹C content (Fig. 1). Specificity was further checked by hybridization with nick-translated DNA from a plasmid in which only the high-G⫹C joint and repeat regions were cloned (anXhoI/EcoRI fragment spanning 0.81 to 0.86 map units); here only the joint and repeat regions represented in the clone provided a hybridization signal (data not shown).
Patterns of RNA expression as a function of conditions of
infection. We isolated RNA from HeLa cells infected with
HSV-1 (5 PFU/cell) under various conditions of infection. Re-sults of hybridization of cDNA generated from RNA isolated from cells 3 h postinfection (p.i.) in the presence of cyclohex-imide (50g/ml), 2 h p.i. with no drug, 4 h p.i. in the presence of PAA (300g/ml) to inhibit viral DNA replication, and 8 h p.i. with no drug are shown in Table 2. Each value is the median of values from two completely separate experiments with a total number of probes spotted per transcript unit rang-ing from 6 to 12. No normalization between experiments was carried out, but each group of signals was compared to mock-infected controls, and the difference was ranked. The statistical analysis is described in the table footnotes, and a significant value (i.e., one showing a significant difference) was one with a rank ofⱕ0.05.
Clearly, different individual transcripts reach their maximum levels under different conditions of infection. These levels gen-erally reflect the kinetics of expression of the transcripts as determined by numerous individual Northern blot, RNase pro-tection, and primer extension analyses carried out by us as well as many other laboratories over the past two decades (29, 37, 45, 53, 55, 62). The statistical significances of the differences between early (2-h) and late (8-h) hybridization patterns are also listed in Table 2.
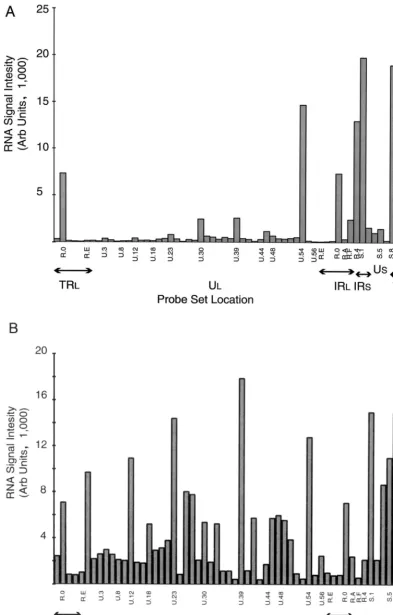
The average (mean) values from individual cycloheximide, 2-h, and 8-h RNA experiments are shown in Fig. 2. In the absence of appreciable protein synthesis (the result of incuba-tion of HeLa cells with 50g of cycloheximide per ml), only the immediate-early genes␣0 (ICP0), ␣4, UL54 (␣27), US1 (␣22 [ICP22]), and US12 (␣47 [ICP47]) are expressed at high levels. Low levels of the DNA polymerase transcript (UL30) and large and small subunits of ribonucleotide reductase (UL39/40) are discernible in this experiment; of this yield, only the UL39/40 signal is significantly different from the mock-infected control (P ⫽0.0002). Expression of both
low-abun-FIG. 1. Demonstration of microarray specificity. The maximum hybridization signal in arbitrary (Arb) units attained with nick-translated HSV-1 DNA fluorescently labeled with Cy3dCTP and hybridized with the probes listed in Table 1 at 68°C is plotted against the G⫹C content of each probe.
on November 9, 2019 by guest
http://jvi.asm.org/
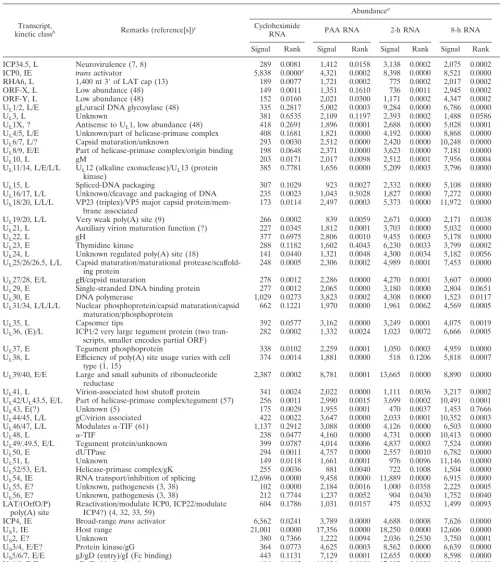
TABLE 2. Transcript abundance in HeLa cells infected with HSV-1 under various conditions
Transcript,
kinetic classb Remarks (reference[s])c
Abundancea Rankd
Cycloheximide
RNA PAA RNA 2-h RNA 8-h RNA 2-h vs 8-h Signal Rank Signal Rank Signal Rank Signal Rank ICP34.5, L Neurovirulence (7, 8) 289 0.0081 1,412 0.0158 3,138 0.0002 2,075 0.0002 0.2174 ICP0, IE transactivator 5,838 0.0000e 4,321 0.0002 8,398 0.0000 8,521 0.0000 0.9556 RHA6, L 1,400 nt 3⬘of LAT cap (13) 189 0.0077 1,721 0.0002 775 0.0002 2,017 0.0002 0.0002 ORF-X, L Low abundance (48) 149 0.0011 1,351 0.1610 736 0.0011 2,945 0.0002 0.0002 ORF-Y, L Low abundance (48) 152 0.0160 2,021 0.0300 1,171 0.0002 4,347 0.0002 0.0011 UL1/2, L/E gL/uracil DNA glycosylase (48) 335 0.2817 5,002 0.0003 9,284 0.0000 6,786 0.0000 0.1943 UL3, L Unknown 381 0.6535 2,109 0.1197 2,393 0.0002 1,488 0.0586 0.0173 UL1X, ? Antisense to UL1, low abundance (48) 418 0.2691 1,896 0.0001 2,688 0.0000 5,028 0.0001 0.0000 UL4/5, L/E Unknown/part of helicase-primase complex 408 0.1681 1,821 0.0000 4,192 0.0000 8,868 0.0000 0.0024 UL6/7, L/? Capsid maturation/unknown 293 0.0030 2,512 0.0000 2,420 0.0000 10,248 0.0000 0.0000 UL8/9, E/E Part of helicase-primase complex/origin binding 198 0.0648 2,371 0.0000 3,623 0.0000 7,181 0.0000 0.0000
UL10, L gM 203 0.0171 2,017 0.0098 2,512 0.0001 7,956 0.0004 0.0000
UL11/14, L/E/L/L UL12 (alkaline exonuclease)/UL13 (protein
kinase) 385 0.7781 1,656 0.0000 5,209 0.0003 3,796 0.0000 0.0000 UL15, L Spliced-DNA packaging 307 0.1029 923 0.0027 2,332 0.0000 5,108 0.0000 0.0006 UL16/17, L/L Unknown/cleavage and packaging of DNA 235 0.0023 1,043 0.5028 1,827 0.0000 7,272 0.0000 0.0000 UL18/20, L/L/L VP23 (triplex)/VP5 major capsid
protein/mem-brane associated 173 0.0114 2,497 0.0003 5,373 0.0000 11,972 0.0000 0.0000 UL19/20, L/L Very weak poly(A) site (9) 266 0.0002 839 0.0059 2,671 0.0000 2,171 0.0038 0.0349 UL21, L Auxiliary virion maturation function (?) 227 0.0345 1,812 0.0001 3,703 0.0000 5,032 0.0000 0.0119
UL22, L gH 377 0.6975 2,806 0.0010 9,455 0.0003 5,178 0.0000 0.2581
UL23, E Thymidine kinase 288 0.1182 1,602 0.4043 6,230 0.0033 3,799 0.0002 0.0000 UL24, L Unknown regulated poly(A) site (18) 141 0.0440 1,321 0.0048 4,300 0.0034 5,182 0.0056 0.3674 UL25/26/26.5, L/L Capsid maturation/maturational
protease/scaffold-ing protein 248 0.0005 2,306 0.0002 4,989 0.0001 7,453 0.0000 0.0173 UL27/28, E/L gB/capsid maturation 278 0.0012 2,286 0.0000 4,270 0.0001 3,607 0.0000 0.6544 UL29, E Single-stranded DNA binding protein 277 0.0012 2,065 0.0000 3,180 0.0000 2,804 0.0651 0.9111 UL30, E DNA polymerase 1,029 0.0273 3,823 0.0002 4,308 0.0000 1,523 0.0117 0.0001 UL31/34, L/L/L/L Nuclear phosphoprotein/capsid maturation/capsid
maturation/phosphoprotein 662 0.1221 1,970 0.0000 1,961 0.0062 4,569 0.0005 0.0000 UL35, L Capsomer tips 392 0.0577 3,162 0.0000 3,249 0.0001 4,075 0.0019 0.1074 UL36, (E)/L ICP1/2 very large tegument protein (two
tran-scripts, smaller encodes partial ORF) 282 0.0002 1,332 0.0024 1,023 0.0072 6,666 0.0005 0.0000 UL37, E Tegument phosphoprotein 338 0.0102 2,259 0.0001 1,050 0.0003 4,959 0.0000 0.0000 UL38, L Efficiency of poly(A) site usage varies with cell
type (1, 15) 374 0.0014 1,881 0.0000 518 0.1206 5,818 0.0007 0.0000 UL39/40, E/E Large and small subunits of ribonucleotide
reductase 2,387 0.0002 8,781 0.0001 13,665 0.0000 8,890 0.0000 0.0357 UL41, L Virion-associated host shutoff protein 341 0.0024 2,022 0.0000 1,111 0.0036 3,217 0.0002 0.0000 UL42/UL43.5, E/L Part of helicase-primase complex/tegument (57) 256 0.0011 2,990 0.0015 3,699 0.0002 10,491 0.0001 0.0003 UL43, E(?) Unknown (5) 175 0.0029 1,955 0.0001 470 0.0037 1,453 0.7666 0.0000 UL44/45, L/L gC/virion associated 422 0.0022 3,647 0.0000 2,033 0.0001 10,352 0.0003 0.0000 UL46/47, L/L Modulates␣-TIF (61) 1,137 0.2912 3,088 0.0000 4,126 0.0000 6,503 0.0000 0.1227 UL48, L ␣-TIF 238 0.0477 4,160 0.0000 4,731 0.0000 10,413 0.0000 0.0001 UL49/.49.5, E/L Tegument protein/unknown 399 0.0787 4,014 0.0006 4,837 0.0003 7,524 0.0000 0.1535 UL50, E dUTPase 294 0.0011 4,757 0.0000 2,557 0.0010 6,782 0.0000 0.0008 UL51, L Unknown 149 0.0118 1,661 0.0001 976 0.0096 11,146 0.0000 0.0000 UL52/53, E/L Helicase-primase complex/gK 255 0.0036 881 0.0040 722 0.1008 1,504 0.0000 0.0000 UL54, IE RNA transport/inhibition of splicing 12,696 0.0000 9,458 0.0000 11,889 0.0000 6,915 0.0000 0.0000 UL55, E? Unknown, pathogenesis (3, 38) 102 0.0000 2,184 0.0016 1,000 0.0358 2,225 0.0005 0.0000 UL56, E? Unknown, pathogenesis (3, 38) 212 0.7744 1,237 0.0052 904 0.0430 1,752 0.0040 0.0736 LAT/(OrfO/P)
poly(A) site Reactivation/modulate ICP0, ICP22/modulateICP4?) (4, 32, 33, 59) 604 0.1786 1,031 0.0157 475 0.0532 1,499 0.0093 0.0002 ICP4, IE Broad-rangetransactivator 6,562 0.0241 3,789 0.0000 4,688 0.0008 7,626 0.0000 0.0172 US1, IE Host range 21,001 0.0000 17,356 0.0000 18,250 0.0000 12,606 0.0000 0.1714 US2, E? Unknown 380 0.7366 1,222 0.0094 2,036 0.2530 3,750 0.0001 0.0003 US3/4, E/E? Protein kinase/gG 364 0.0773 4,625 0.0003 8,562 0.0000 6,639 0.0000 0.0207 US5/6/7, E/E gJ/gD (entry)/gI (Fc binding) 443 0.1131 7,129 0.0001 12,655 0.0000 8,598 0.0000 0.0344 US8/9, E/E gE (Fc binding)/unknown 486 0.1692 11,934 0.0000 17,082 0.0000 9,113 0.0000 0.0000 US10/11/12, E/E/IE Unknown/RNA binding phosphoprotein/␣47
(inhibits MHC-I presentation) (60) 13,764 0.0000 7,692 0.0001 14,381 0.0000 10,203 0.0000 0.0636
aSignal intensities were determined by calculating the median of background-subtracted values for two independent experiments based on 6 or 12 replicates.Pvalues reported with corresponding median values (Rank) were determined by ranking the replicate values for each sequence (n⫽6 or 12) from both mock-infected and HSV-infected cells. The null hypothesis (P⫽1), that mock and HSV groups are identical, was tested for the ranked values instead of the background-adjusted values by using Student’sttest with two-tail distribution and assuming unequal variance. This procedure of applying Student’sttest to the rank of the signals instead the signal values is an approximation to the nonparametric Mann-Whitney rank test (16).
bEarly mapping and kinetic data are compiled in reference 45. L, late; IE, immediate early; E, early. cGeneral information concerning genetic functions can be found in reference 37.
dThe null hypothesis is that the 2- and 8-h signals are the same. eP⬍0.0001.
on November 9, 2019 by guest
http://jvi.asm.org/
FIG. 2. Hybridization of oligo(dT)-primed cDNA synthesized from HeLa cells under various conditions of infection to an HSV-1 specific microarray. Each panel is based on a single experiment; a summary showing median values is shown in Table 2. (A) Hybridization of cDNA synthesized to RNA abundant in HeLa cells 3 h following infection in the presence of cycloheximide (50g/ml). (B) Hybridization of cDNA synthesized to RNA abundant in HeLa cells 2 h following infection. (C) Hybridization of cDNA synthesized to RNA abundant in HeLa cells 8 h following infection. Arb, arbitrary.
on November 9, 2019 by guest
http://jvi.asm.org/
dance transcripts was eliminated by increasing the stringency of inhibition of protein synthesis through raising the inhibitor concentration to 100 g/ml (data not shown). Under these conditions, expression of the ␣27 (UL54) transcript is also markedly reduced. We also isolated RNA from rabbit skin cells infected at the same multiplicity and incubated for 3 h in the presence of the lower amount of inhibitor. There was no evi-dent expression of transcripts detected by either the UL30- or UL39/40-specific probe, but the relative expression of the␣27 transcript was comparable to that seen in HeLa cells at the same inhibitor concentration (data not shown).
The hybridization pattern due to the presence of RNA ex-pressed at 2 h p.i. was, as expected, considerably more complex (Fig. 2B). The relative abundance of thymidine kinase (UL23), the early alkaline exonuclease transcript (UL12), DNA poly-merase (UL30),␣27, and many of the early transcripts of the short unique region are evident. On the other hand, results for 8-h RNA hybridization (Fig. 2C) reveal the relative increase in abundance of both strict late and leaky late transcripts, includ-ing those hybridizinclud-ing to the U.18 probe (containinclud-ing the major capsids [UL19]-encoding transcript), the strict late UL38 capsid protein, and the gC- and UL45-encoding transcripts revealed with the U.44 probe. In addition, the relative decline in abun-dance of some early transcripts such as thymidine kinase,␣27, and DNA polymerase are notable.
While this analysis is generally consistent with the kinetic classification of individual transcripts arrived at both by anal-ysis of stable transcripts and by incorporation of radioactive precursors as a measure of synthesis at a specific time or in the presence of metabolic inhibitors, there are some notable dif-ferences. One factor is a difference in the stability of viral transcripts in HeLa cells compared to rabbit skin cells, where
thorough transcription studies have been carried out. For ex-ample, we have extensively studied the properties of the pro-moter controlling the expression of the UL37 transcript in HSV-infected rabbit skin cells (30, 62). All data demonstrate that this is a low-abundance early transcript controlled by a relatively weak promoter. Despite this, the level of this tran-script increases in HeLa cells between 2 and 8 h (Table 2).
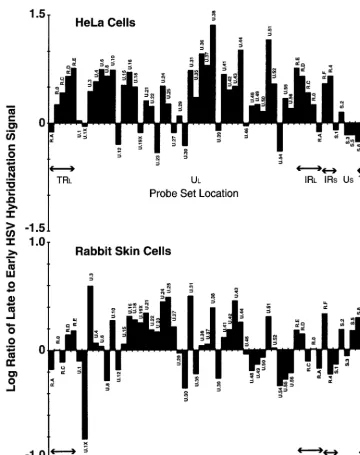
Continuous labeling using [32P]orthophosphate experiments demonstrated that the 3.6-kb UL37 transcript continues to accumulate in HeLa cells (1), and we confirmed that this dif-ference is cell based by carrying out a comparative analysis of the ratio of cDNA generated from RNA isolated at late (7 h p.i.) and early (3 h p.i.) times in rabbit skin cells. Here, the abundance of this transcript declines as would be expected for an early transcript (Table 3). Both the similarities and differ-ences between the ratios of RNA abundance at late versus early times following infection of HeLa and rabbit skin cells is readily apparent when the log10 of each ratio is plotted as shown in Fig. 3. The possible significance of other differences is considered in Discussion.
Global analysis of viral transcripts accumulating in the
absence of the ␣27 gene product.The above results
demon-strate the efficiency of the HSV-1 DNA microarray for detect-ing differential accumulation of viral transcripts as a function of conditions of infection. We also compared the relative abun-dance of viral transcripts in cells 6 h after infection with the
27lacZmutant of the KOS strain of HSV-1 versus the parental
[image:6.612.109.496.74.376.2]wt virus. The data in Table 4 show that there are generally three groups of transcripts. The first group evidenced expres-sion near or abovewtlevels. Thus, in the mutant infections a total of 10 of the 52 transcript sets had a rank statistically equivalent to thewtlevel (i.e.,P⬎⬎0.05), and one (ICP4) was FIG. 2—Continued.
on November 9, 2019 by guest
http://jvi.asm.org/
present at greater than thewtlevel (P⬍0.0001). The majority (39 of 52) of transcript sets analyzed showed a statistically significant reduction in abundance following infection with the mutant virus. Of these, about half (21 of 39) were reduced by a factor of 5 or more. As detailed in Discussion, the effects seen are generally consistent with a number of other studies using different approaches.
Response of selected cellular transcripts to HSV-1 infection.
As outlined in Materials and Methods, we designed the present DNA microarray to contain selected human genes, a number of which are expressed by transcripts known to be responsive to perturbations of the cellular environment. Not unexpectedly, we found that the maximum signal for most cellular genes probed was significantly less than seen for the viral transcripts, but the 57 genes listed in Table 5 all provided a signal during at least one of the conditions tested that was reproducibly above the background level seen with a control human cytomegalovirus probe (UL124R) included as a nega-tive control.
We first analyzed cellular mRNA abundance in HeLa cells immediately following the 30-min virus adsorption period with that compared to a mock-infected sample as a control for differential efficiency of detecting the infected cell Cy3 label versus the uninfected cell Cy5 label. This 0-h time point control was used to establish a baseline for the expected normal level of cellular transcript. We then analyzed cellular mRNA abun-dance in HeLa cells at 2 and 8 h after infection with the 17syn⫹
[image:7.612.52.294.92.352.2]strain of HSV-1. The average data from two independent ex-periments are shown in Table 5, and the log10of each ratio of
TABLE 4. Abundance of HSV transcripts at 6 h p.i. in cells infected with the27lacZmutanta
Probe set
27lacZ KOS Mutant vs
KOS rankb
Probe set
27lacZ KOS Mutant vs
KOS rank
Signal Rank (P) Signal Rank Signal Rank Signal Rank
R.A 784 0.0576 2,420 0.0062 0.0000c U.35 1,099 0.0001 5,026 0.0000 0.0000
R.O 6,855 0.0000 6,588 0.0000 0.8285 U.36 557 0.9017 3,232 0.0000 0.0001
R.C 473 0.8994 1,296 0.3714 0.0576 U.37 777 0.0187 3,184 0.0000 0.0000
R.D 458 0.9664 1,792 0.2447 0.0568 U.38 4,343 0.0000 6,559 0.0000 0.1080
R.E 1,014 0.0545 1,787 0.0000 0.1264 U.39 7,952 0.0000 9,303 0.0000 0.5991
U.1 4,423 0.0000 7,911 0.0000 0.0340 U.41 706 0.2629 3,255 0.0000 0.0007
U.1X 600 0.6425 1,765 0.0072 0.0452 U.42 710 0.0027 5,913 0.0000 0.0000
U.3 735 0.2103 4,675 0.0000 0.0000 U.43 723 0.2887 1,974 0.0000 0.0002
U.4 971 0.0014 6,005 0.0000 0.0000 U.44 1,512 0.0011 5,744 0.0000 0.0000
U.6 632 0.4950 6,767 0.0000 0.0000 U.46 964 0.0000 4,642 0.0000 0.0000
U.8 601 0.1233 4,505 0.0000 0.0000 U.48 909 0.0004 8,040 0.0000 0.0000
U.10 1,450 0.0000 4,749 0.0000 0.0000 U.49 991 0.0011 5,831 0.0000 0.0000
U.12 627 0.6874 1,336 0.0632 0.0000 U.50 1,407 0.0000 7,546 0.0000 0.0000
U.15 726 0.2105 2,716 0.0000 0.0004 U.51 560 0.8286 3,750 0.0000 0.0000
U.16 389 0.2914 2,054 0.0000 0.0000 U.52 628 0.8284 1,731 0.0000 0.0000
U.18 367 0.1240 4,042 0.0000 0.0000 U.54 676 0.2346 3,561 0.0000 0.0000
U.19X 435 0.4021 9,223 0.0000 0.0000 U.55 574 0.4009 2,437 0.0000 0.0000
U.21 353 0.2004 1,801 0.0000 0.0000 U.56 505 0.3837 1,455 0.0039 0.0000
U.22 421 0.5772 2,767 0.0000 0.0001 R.Fd 663 1.0000 843 0.4187 0.3183
U.23 1,984 0.0156 6,349 0.0000 0.0000 R.4 8,205 0.0000 2,930 0.0000 0.0000
U.24 1,043 0.0218 3,919 0.0000 0.0014 S.1 17,194 0.0000 15,490 0.0000 0.8045
U.25 373 0.2769 3,586 0.0000 0.0000 S.2 650 0.7100 4,664 0.0000 0.0000
U.27 2,098 0.0345 6,367 0.0000 0.0030 S.3 1,166 0.0103 5,010 0.0000 0.0000
U.29 3,030 0.0000 3,729 0.0000 0.9753 S.5 2,287 0.0000 9,329 0.0000 0.0002
U.30 1,812 0.0000 1,051 0.0395 0.6198 S.8 3,623 0.0000 9,464 0.0000 0.0761
U.31 2,211 0.0000 3,616 0.0000 0.0010 S.12 6,451 0.0000 8,189 0.0000 0.7568
aSignal intensities were determined by calculating the median of background-subtracted values for three independent experiments based on 9 or 18 replicates.P values reported with corresponding median values (Rank) were determined by ranking the replicate values for each sequence (n⫽9 or 18) from both mock- and HSV-infected cells. The null hypothesis, that mock and HSV groups are identical, was tested for the ranked values instead of the background adjusted values by using Student’sttest with two-tail distribution and assuming unequal variance. This procedure of applying Student’sttest to the rank of the signals instead the signal values is an approximation to the nonparametric Mann-Whitney rank test (16). Boldface entries are comparable or increased in27lacZ(an insertion mutant expressing a chimeric transcript [40, 49, 52]) infection compared towtKOS infection.
[image:7.612.54.550.394.655.2]bThe null hypothesis is that the mutant (27lacZ) andwtsignals are the same. cSignal too low under conditions used for a meaningful conclusion. dP⬍0.0001.
TABLE 3. Effect of the host cell on the ratio of HSV-1 transcripts at early and late times following infection
8-h/2-h signal, HeLa cells Probeset
7-h/3-h signal, rabbit skin
cells
8-h/2-h signal, HeLa cells Probeset
7-h/3-h signal, rabbit skin
cells
0.75 R.A 0.67 2.28 U.35 0.60
1.80 R.O 1.00 9.21 U.36 1.09
2.64 R.C 0.78 6.34 U.37 1.13
4.47 R.D 1.39 23.10 U.38 2.46
5.80 R.E 1.51 0.79 U.39 0.55
1.08 U.1 0.80 4.77 U.41 1.30
0.90 U.1X 0.15 2.90 U.42 1.54
2.74 U.3 3.93 3.25 U.43 2.85
3.78 U.4 1.16 10.38 U.44 1.80
5.56 U.6 1.09 0.91 U.46 0.91
4.51 U.8 0.52 1.73 U.48 0.64
5.46 U.10 1.88 1.81 U.49 0.73
0.51 U.12 0.66 1.45 U.50 0.85
3.35 U.15 1.14 14.40 U.51 2.02
5.10 U.16 2.06 3.51 U.52 1.04
3.19 U.18 1.91 0.41 U.54 0.46
0.74 U.19X 1.79 2.19 U.55 0.53
2.04 U.21 2.20 1.59 U.56 0.61
1.71 U.22 1.54 3.52 R.F 2.14
0.39 U.23 1.47 4.48 R.4 0.59
3.27 U.24 2.80 0.80 S.1 0.73
1.85 U.25 3.08 1.41 S.2 1.52
0.73 U.27 1.64 0.68 S.3 0.87
1.26 U.29 0.94 0.68 S.5 1.48
0.49 U.30 0.44 0.54 S.8 1.96
5.41 U.31 3.16 0.73 S.12 1.51
on November 9, 2019 by guest
http://jvi.asm.org/
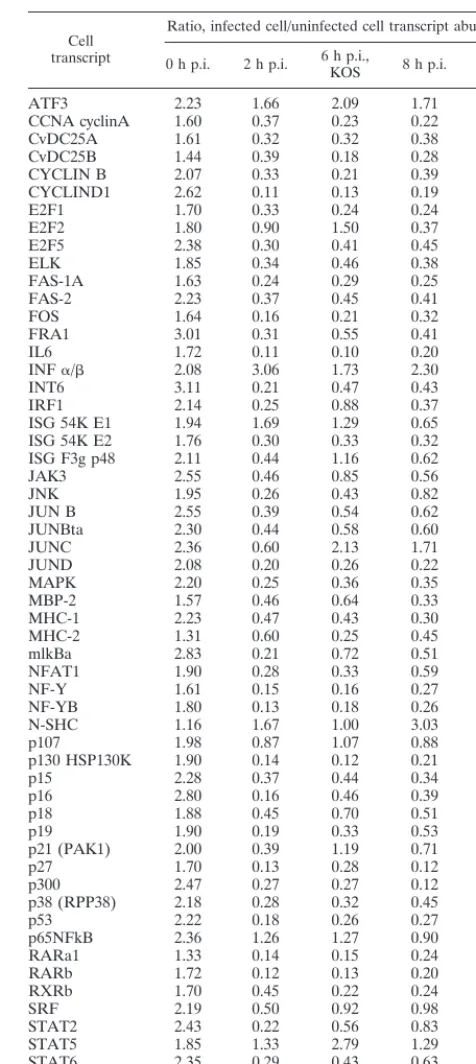
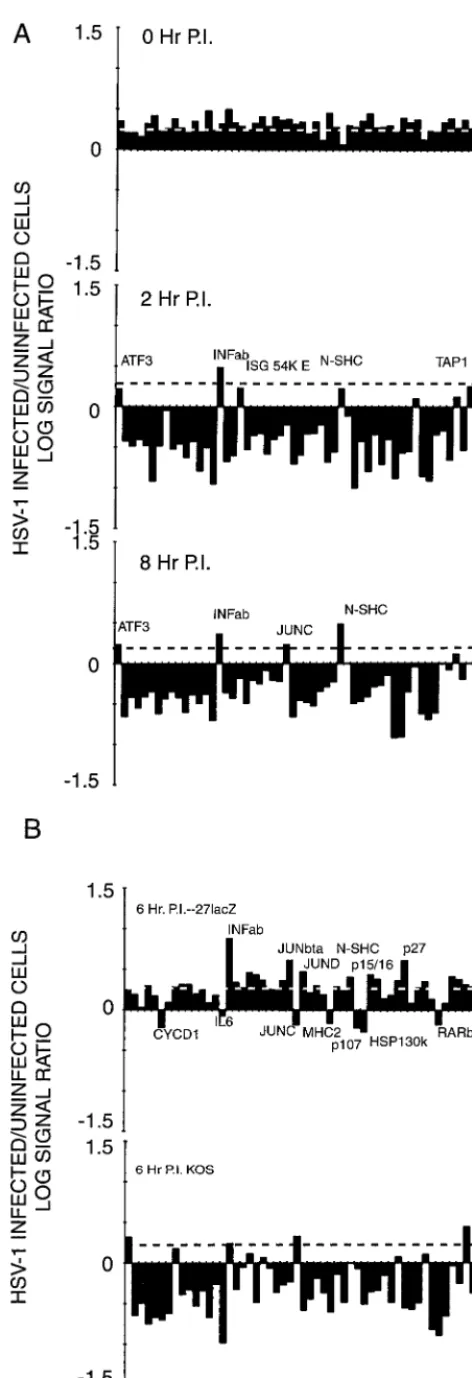
infected cell to uninfected cell abundance is shown graphically in Fig. 4A. Notably, against (an expected) general decline in cellular mRNA abundance, transcripts representing database entries ATF3, INF␣/, ISG 54K E2, JUNC, N-SHC, and TAP1 were present at levels near or above control values at either the 2- or 8-h time point.
The effect of infection of the 27lacZ mutant on cellular transcript abundance was more varied (Table 5 and Fig. 4B). The major decline in transcript abundance is not seen at 6 h following infection with this mutant, but some transcripts are markedly reduced compared to control values. These include CYCLIND1, IL6, JUNC, MHC-2, p107, p130 HSP130K, and RARb. Transcripts specific for INF␣/, JUNBta, JUND, N-SHC, p15, p16, p27, and TAP1 were significantly increased in abundance compared to control values.
DISCUSSION
The data presented here demonstrate the power of the ap-proach of using defined oligonucleotide probes for the HSV-1 DNA microarray. Such a microarray provides an additional convenient addition to the available tools for the investigation of HSV transcription. Our immediate goal was to construct a microarray with the minimum number of probes necessary to uniquely detect all groups of HSV transcripts as well as diag-nostic host cell genes perturbed by viral infection. Our criteria for choosing appropriate probes included position relative to the transcript polyadenylation site, lack of internal repeat or reiterated sequences, and base composition near the average for the region of DNA being transcribed. The first-generation chip that we have constructed demonstrates that these criteria are sufficient for the choice of probes displaying excellent
spec-FIG. 3. The log10of the ratio of late to early infected HeLa and rabbit skin cell viral RNA is plotted to emphasize time-specific differences in abundance. The late
and early times for HeLa cells are 8 and 2 h p.i., respectively; those for rabbit skin cells are 7 and 3 h p.i.
on November 9, 2019 by guest
http://jvi.asm.org/
[image:8.612.124.485.67.523.2]ificity and adequate sensitivity for assaying the expression of a large number of viral genes under various conditions of infec-tion. Despite its value, however, it is important to note that further probes and cDNA synthesis regimens will be necessary to fully optimize the specificity of detection of individual viral genes transcribed. Our ultimate goal is to apply this microarray technology to direct analysis of viral gene expression in specific tissues and in animals.
Since the general patterns of HSV-1 gene expression during productive infection are well known, as is the transcription program and relationship of transcripts to genomic sequence, we used viral RNA isolated under varied conditions of infec-tion to serve as our basic platform for assaying the capabilities of the present microarray for detailed global analysis of viral transcript abundance.
Microarray analysis of HSV mRNA abundance. General
patterns of viral gene expression and gene function have been derived from studies where relatively large quantities of cul-tured cells are infected under selected and/or optimized con-ditions (see references 53 and 55 for recent reviews emphasiz-ing our own point of view on this broadly studied topic). The summary microarray data presented in Table 2 are in good general agreement with the far more laboriously formulated kinetic classification of viral transcripts based on Northern blot, hybrid selection, RNase protection, primer extension, and metabolic labeling studies carried out over the past two de-cades. There are, of course, some areas of nonagreement. Some of these are due to lack of resolution of the current chip, since coterminal transcripts of different kinetic classes cannot be distinguished. Also, and not surprisingly, some discrepan-cies are seen with transcripts expressed with low abundance. And it is clear that the actual cell in which the studies are carried out has a significant bearing on the relative proportion of viral transcripts recovered at any given time or under any particular conditions of infection. Thus, HeLa cells require quite high levels of cycloheximide (100 g/ml) to suppress low-level expression of one or two nominally early HSV tran-scripts. Also, the early UL37 transcript continues to accumu-late accumu-late in infected HeLa cells but not rabbit skin cells (Table 3). Another example can be seen in the level of the prototyp-ical immediate-early ␣4 transcript, which does not change much between 2 and 8 h in HeLa cells but decreases markedly in rabbit skin cells (compare Tables 2 and 3). While most differences in accumulation can be ascribed to differential mRNA stability in the various cells infected with the virus, other differences may reflect differences in the efficiency of shutoff of early transcription at late times in various cell types. Indeed, the sharp shutoff with rabbit skin cells is the major reason that we have used them for our continuing kinetic studies (62).
Most of these relatively few discrepancies will be readily resolved by increasing the resolution of the microarray using random oligomers as well as oligo(dT) to prime cDNA synthe-sis and by carefully characterizing the nature of viral transcrip-tion and RNA accumulatranscrip-tion as a functranscrip-tion of the cell infected. Some discrepancies, however, are the result of inadequacies in our current kinetic classification schemes. The classification of three basic groups of transcripts (and the proteins encoded by them) is based on one or another measures of transcript abun-dance in infections where virus-induced protein and DNA syn-thesis are blocked with metabolic inhibitors. The subclassifica-tion into leaky late and strict late, early and delayed early, etc., is based on relative abundance at specific times before and after genome replication. Such a scheme fails to take into account the real situation where some transcripts are expressed at low levels throughout infection and neither amplified nor
shut off. This would appear to be the case for LAT (latency-associated transcript) and its truncated 5⬘-colinear polyadenyl-ated transcript detected by probe sets R.C and R.F, respec-tively. Further, the levels of others transcripts are modulated posttranscriptionally. Other variations are also evident. For example, expression of the ICP34.5 protein has been classified as strict late (essentially requiring viral genome replication for expression), yet our experiments demonstrate that the
tran-TABLE 5. Relative abundance of transcripts under various conditions of HSV-1 infection of HeLa cells
Cell transcript
Ratio, infected cell/uninfected cell transcript abundancea
0 h p.i. 2 h p.i. 6 h p.i.,KOS 8 h p.i. 6 h p.i.,27lacZ
ATF3 2.23 1.66 2.09 1.71 1.80
CCNA cyclinA 1.60 0.37 0.23 0.22 1.55
CvDC25A 1.61 0.32 0.32 0.38 1.07
CvDC25B 1.44 0.39 0.18 0.28 1.98
CYCLIN B 2.07 0.33 0.21 0.39 1.47
CYCLIND1 2.62 0.11 0.13 0.19 0.97
E2F1 1.70 0.33 0.24 0.24 1.23
E2F2 1.80 0.90 1.50 0.37 1.90
E2F5 2.38 0.30 0.41 0.45 2.05
ELK 1.85 0.34 0.46 0.38 2.05
FAS-1A 1.63 0.24 0.29 0.25 1.56
FAS-2 2.23 0.37 0.45 0.41 1.77
FOS 1.64 0.16 0.21 0.32 1.21
FRA1 3.01 0.31 0.55 0.41 1.51
IL6 1.72 0.11 0.10 0.20 0.85
INF␣/ 2.08 3.06 1.73 2.30 7.62
INT6 3.11 0.21 0.47 0.43 2.17
IRF1 2.14 0.25 0.88 0.37 1.87
ISG 54K E1 1.94 1.69 1.29 0.65 2.89
ISG 54K E2 1.76 0.30 0.33 0.32 2.71
ISG F3g p48 2.11 0.44 1.16 0.62 2.32
JAK3 2.55 0.46 0.85 0.56 1.78
JNK 1.95 0.26 0.43 0.82 1.77
JUN B 2.55 0.39 0.54 0.62 2.30
JUNBta 2.30 0.44 0.58 0.60 4.09
JUNC 2.36 0.60 2.13 1.71 0.65
JUND 2.08 0.20 0.26 0.22 2.96
MAPK 2.20 0.25 0.36 0.35 1.64
MBP-2 1.57 0.46 0.64 0.33 1.99
MHC-1 2.23 0.47 0.43 0.30 1.55
MHC-2 1.31 0.60 0.25 0.45 0.69
mlkBa 2.83 0.21 0.72 0.51 1.92
NFAT1 1.90 0.28 0.33 0.59 1.73
NF-Y 1.61 0.15 0.16 0.27 1.25
NF-YB 1.80 0.13 0.18 0.26 1.27
N-SHC 1.16 1.67 1.00 3.03 2.56
p107 1.98 0.87 1.07 0.88 1.49
p130 HSP130K 1.90 0.14 0.12 0.21 0.99
p15 2.28 0.37 0.44 0.34 2.72
p16 2.80 0.16 0.46 0.39 2.40
p18 1.88 0.45 0.70 0.51 1.38
p19 1.90 0.19 0.33 0.53 1.52
p21 (PAK1) 2.00 0.39 1.19 0.71 2.31
p27 1.70 0.13 0.28 0.12 4.11
p300 2.47 0.27 0.27 0.12 1.22
p38 (RPP38) 2.18 0.28 0.32 0.45 1.88
p53 2.22 0.18 0.26 0.27 1.41
p65NFkB 2.36 1.26 1.27 0.90 2.26
RARa1 1.33 0.14 0.15 0.24 1.36
RARb 1.72 0.12 0.13 0.20 0.66
RXRb 1.70 0.45 0.22 0.24 1.21
SRF 2.19 0.50 0.92 0.98 2.59
STAT2 2.43 0.22 0.56 0.83 2.40
STAT5 1.85 1.33 2.79 1.29 2.06
STAT6 2.35 0.29 0.43 0.63 1.96
TAP1 1.84 1.78 4.72 0.99 3.12
UNG 1.94 0.13 0.10 0.17 1.01
aBased on at least two separate experiments.
on November 9, 2019 by guest
http://jvi.asm.org/
[image:9.612.311.549.91.623.2]script encoding it detected by probe set R.A is present at essentially equivalent levels at 2 h and 8 h. While the expres-sion of this transcript is somewhat reduced in the presence of the DNA replication inhibitor PAA, it clearly does not fit the criteria of a strict-late transcript such as seen with UL38 and UL44/45 detected by the U.38 and U.44 probe sets, respec-tively.
Our survey of the relative abundance of viral transcripts expressed during infection with the 27lacZ mutant virus, in which the posttranscriptional regulatory protein␣27 (UL54) has been inactivated, provides an excellent example of some of the advantages as well as limitations of using global quantita-tive analysis to form a complete picture of the situation inside the infected cell. Work from a number of laboratories has consistently shown that this protein has a major role in post-transcriptional regulation of viral RNA both through inhibition of splicing and by mediating the transport of a subset of viral transcripts from the nucleus to the cytoplasm in infected cells. This observation is based on a comparison in various cell types of the relative levels of ␣4, ␣0, ␣47 (US12), UL8 (helicase-primase), UL19 (major capsid protein), UL23 (thymidine ki-nase), UL24, UL27 (gB), UL29 (major DNA binding protein), UL30 (DNA polymerase), UL38 (capsid protein), UL41 (viri-on-associated shutoff protein), UL44 (gC), UL52 (helicase-pri-mase), US6 (gD), and US11 (RNA binding protein) on polyri-bosomes as well as the ratio of viral transcripts in the nucleus versus the cytoplasm (18–21, 34–36, 41, 52). While we will need to use polysome-associated and nuclear and cytoplasmic RNA fractions for a complete comparison, generally the results of these studies are consistent with those presented in Table 4. Thus, increases in the levels of␣4 and␣47 (US12) were evident (19–21). Despite this overall consistency, we did not see the marked reduction in levels of UL30 (DNA polymerase) and UL52 (helicase-primase) transcripts reported (52). Also, DNA microarray analysis demonstrated an increased signal using the U.38 probe set specific for the UL38 transcript in contrast to the complete absence of full-length transcript on polyribo-somes noted by Hibbard and Sandri-Goldin (21). In other work, however, these same workers found that 3⬘probes spe-cific for UL38 mRNA detected a 0.4-kb transcript in27lacZ -infected cells, while 5⬘probes detected nothing (M. K. Hibbard and R. M. Sandri-Goldin, unpublished data). Such a result suggests the stable accumulation of a misprocessed form of this transcript in mutant-infected cells. Such stable RNA fragments may also account, in part, for the other discrepancies noted here.
[image:10.612.52.288.65.754.2]While it is clear that greater probe resolution and RNA fractionation will be required to fully characterize the specific transcripts accumulating during infections with mutants lack-ing functional␣27 (UL54) protein using DNA microarray tech-nology, the resolution of the present chip is still sufficient to add new information. Thus, the accumulation of the␣4 and
FIG. 4. Abundance of selected cellular transcripts under various conditions of HSV-1 infection of HeLa cells. The relative abundance of transcripts hybrid-izing to the cellular probes used in this study is shown in Table 5. The log10of the
ratio of the signal seen in mock-infected to infected cells is plotted here. (A) Relative levels of cellular transcripts present under various conditions of infec-tion with the 17syn⫹strain of HSV-1. The dashed line is the average ratio of
mock-infected to infected cell signal for RNA isolated immediately following a 30-min virus adsorption period (top). (B) Effect of the␣27 (UL54)
immediate-early protein on cellular RNA abundance. The dashed line shows the average values of the 0-h control in panel A. The top panel shows the ratio of abundance of cellular RNAs in HeLa cells 6 h following infection and mock infection with the27lacZmutant of the KOS strain of HSV-1; the bottom panel shows the same ratio for cells infected and mock infected with thewtparental KOS strain.
on November 9, 2019 by guest
http://jvi.asm.org/
␣47 (US12) transcripts is reflected by a similar increase in the level of␣22 (US1) mRNA (Table 5). This suggests that the␣27 (UL54) protein may play a role in modulating levels of these immediate-early transcripts during the normal course of infec-tion. The increase in abundance of transcripts detected by the U.30 and U.39 probe sets suggests important roles for them at the earliest stages of infection, and their apparent refractori-ness to inhibition of protein synthesis in HeLa cells may be a related phenomenon. The statistically significant decrease in the abundance of ICP34.5 as seen with the loss of material hybridizing to probe set R.A suggests that the␣27 protein also modulates the expression of this neurovirulence factor.
HSV-1 infection augments the abundance of some cellular
transcripts.Hobbs and DeLuca (22), using an HSV mutant
expressing primarily ICP0 and a human DNA microarray, noted induction of cellular transcripts. A similar array specific for 327 cellular genes was recently used to assess the effect of
wtHSV infection in human embryonic lung cells (25). In agree-ment with these surveys, our much less extensive survey of cellular genes shown in Table 5 and Fig. 3A reveals a marked general decrease in transcript abundance. Exceptions include a limited number of stress response and cellular transcriptional regulatory genes. None of the transcripts surveyed were in-cluded in our group of cellular probes, but it is notable that the transcription factor ATF4 transcript abundance was increased since we found this to also be the case for the ATF3-specific transcript. In our studies, the INF␣/probe showed the most striking increase in cellular transcript abundance, and we also found increases in ISG 54K E2, JUNC, N-SHC, STAT5, and TAP1 transcripts consistent with a major effect on a limited number of stress response and regulatory genes.
A role of the␣27 (UL54) protein in the shutoff of host cell protein synthesis has been inferred from studies of protein synthesis in mutant virus-infected cells (36, 39, 50). Our anal-ysis adds significant dimension to that picture by showing that the protein is directly involved in a decline in host mRNA abundance. Despite the general lack of decline of host cell transcripts, no correlation with extensive splicing was noted, and several were clearly reduced during infection with the regulatory mutant. Reductions in the levels of MHC (major histocompatibility complex) class II may reflect a role of␣47 (US12) protein, although its primary function appears to be in the MHC class I pathway (17). Decreases in CYCLIND1, IL6, JUNC, p107, p130, HSP130K, and RARb transcripts must reflect the specific function(s) of other viral genes.
When adjusted for the appropriate controls, the abundance of only a few cellular transcripts increased during infection with the mutant virus. While similar to those increased inwt
infections, the set was not identical. These results suggest that the␣27 (UL54) protein plays a role in the induction or stabi-lization of specific cellular genes following infection. This role may be related to its differential effect on the abundance and stability of only a subset of viral transcripts. It will be of interest to determine whether such transcripts contain common struc-tural motifs.
Conclusions.As useful as the application of DNA
microar-ray analysis is and will continue to be in studying viral gene expression in cultured cells, such infection does not necessarily reflect the process of virus infection and spread in the host. The most promising application of HSV-specific chips will be in analysis of viral replication in reactivation from latent infec-tion and infecinfec-tion of a specific organ or cell type. Further, techniques are now available for collection of individual neu-rons and laser dissection of individual cells or extremely small samples of differentiated tissue and for the amplification of RNA in such tissues (14, 28, 43, 44, 46, 51). The power of the
approach will be augmented by assaying an increasing collec-tion of cellular genes (both human and those specific for the animal model being studied) chosen to represent those whose expression is modulated by the stress of viral infection. The broad patterns of HSV and critical cellular gene expression exhibited under various conditions of infection and under the influence of defined modification of critical regulatory genes will illuminate potential critical points in the course of virus replication in the whole animal. Those differentiated cells and tissues where there is a critical restriction of virus replication are precisely the points where it can be expected that the full panoply of viral regulatory circuits must operate to optimum effect. They will provide important experimental subjects for further regulatory studies.
ACKNOWLEDGMENTS
The first three authors contributed equally to this work.
M. Rice and Danielle Foster provided invaluable technical assis-tance, and L. Buehler carried out the statistical analyses. We also thank Steven Head of the Scripps Research Institute Microarray fa-cility.
Support to E.K.W. was by grant CA11861 and seed funds from the Chao Family Comprehensive Cancer Center, Office of Research and Graduate Studies, UCI, and School of Biological Sciences. P.G. was supported by grants CA66167 and AI30627; he is a Scholar of the Leukemia Society of America. S.W.S. is a trainee under Virology training grant T32 AI07319.
REFERENCES
1.Anderson, K. P., R. J. Frink, G. B. Devi-Rao, B. H. Gaylord, R. H. Costa, and E. K. Wagner.1981. Detailed characterization of the mRNA mapping in the
HindIII fragment K region of the herpes simplex virus type 1 genome. J. Virol.37:1011–1027.
2.Arnosti, D. N., C. M. Preston, M. Hagmann, W. Schaffner, R. G. Hope, G. Laughlan, and B. F. Luisi.1993. Specific transcriptional activationin vitroby the herpes simplex virus protein VP16. Nucleic Acids Res.21:5570–5576. 3.Ben-Hur, T., M. Moyal, A. Rosen-Wolff, G. Darai, and Y. Becker.1989.
Characterization of RNA transcripts from herpes simplex virus-1 DNA frag-ment BamHI-B. Virology169:1–8.
4.Bruni, R., and B. Roizman.1996. Open reading frame P—a herpes simplex virus gene repressed during productive infection encodes a protein that binds a splicing factor and reduces synthesis of viral proteins made from spliced mRNA. Proc. Natl. Acad. Sci. USA93:10423–10427.
5.Carter, K. L., P. L. Ward, and B. Roizman.1996. Characterization of the products of the UL43 gene of herpes simplex virus 1: potential implications for regulation of gene expression by antisense transcription. J. Virol.70:
7663–7668.
6.Chambers, J., A. Angulo, D. Amarantunga, H. Guo, Y. Jian, J. S. Wan, A. Bittner, K. Frueh, M. R. Jackson, P. A. Peterson, M. G. Erlander, and P. Ghazal.1999. DNA microarrays of the complex human cytomegalovirus genome: profiling kinetic class with drug sensitivity of viral gene expression. J. Virol.73:5757–5766.
7.Chou, J., E. R. Kern, R. J. Whitley, and B. Roizman.1990. Mapping of herpes simplex virus-1 neurovirulence to gamma134.5, a gene nonessential for growth in culture. Science250:1262–1266.
8.Chou, J., and B. Roizman.1994. Herpes simplex virus 1 gamma134.5 gene function, which blocks the host response to infection, maps in the homolo-gous domain of the genes expressed during growth arrest and DNA damage. Proc. Natl. Acad. Sci. USA91:5247–5251.
9.Costa, R. H., G. Cohen, R. Eisenberg, D. Long, and E. K. Wagner.1984. Direct demonstration that the abundant 6-kilobase herpes simplex virus type 1 mRNA mapping between 0.23 and 0.27 map units encodes the major capsid protein VP5. J. Virol.49:287–292.
10. DeLuca, N. A., and M. J. Carrozza.1996. Interaction of the viral activator protein ICP4 with TFIID and through TAF250. Mol. Cell. Biol.16:3085– 3093.
11. Devi-Rao, G. B., J. S. Aguilar, M. K. Rice, H. H. Garza, Jr., D. C. Bloom, J. M. Hill, and E. K. Wagner.1997. Herpes simplex virus genome replication and transcription during induced reactivation in the rabbit eye. J. Virol.71:
7039–7047.
12. Devi-Rao, G. B., D. C. Bloom, J. G. Stevens, and E. K. Wagner.1994. Herpes simplex virus type 1 DNA replication and gene expression during explant induced reactivation of latently infected murine sensory ganglia. J. Virol.68:
1271–1282.
13. Devi-Rao, G. B., S. A. Goodart, L. B. Hecht, R. Rochford, M. K. Rice, and E. K. Wagner.1991. The relationship between polyadenylated and
on November 9, 2019 by guest
http://jvi.asm.org/
adenylated herpes simplex virus type 1 latency-associated transcripts. J. Vi-rol.65:2179–2190.
14.Emmert-Buck, M. R., R. F. Bonner, P. D. Smith, R. F. Chuaqui, Z. Zhuang, S. R. Goldstein, R. A. Weiss, and L. A. Liotta.1996. Laser capture micro-dissection. Science274:998–1001.
15.Flanagan, W. M., A. G. Papavassiliou, M. Rice, L. B. Hecht, S. J. Silverstein, and E. K. Wagner.1991. Analysis of the herpes simplex virus type 1 promoter controlling the expression of UL38, a true late gene involved in capsid assembly. J. Virol.65:769–786.
16. Glanz, S. A.1997. Primer of biostatistics. McGraw-Hill, New York, N.Y. 17. Gustafsson, C. M., O. Hammarsten, M. Falkenberg, and P. Elias.1994.
Herpes simplex virus DNA replication: a spacer sequence directs the ATP-dependent formation of a nucleoprotein complex atoriS. Proc. Natl. Acad. Sci. USA91:4629–4633.
18. Hann, L. E., W. J. Cook, S. L. Uprichard, D. M. Knipe, and D. M. Coen.
1998. The role of herpes simplex virus ICP27 in the regulation ofUL24gene expression by differential polyadenylation. J. Virol.72:7709–7714. 19. Hardwicke, M. A., and R. M. Sandri-Goldin.1994. The herpes simplex virus
regulatory protein ICP27 contributes to the decrease in cellular mRNA levels during infection. J. Virol.68:4797–4810.
20. Hardy, W. R., and R. M. Sandri-Goldin.1994. Herpes simplex virus inhibits host cell splicing, and regulatory protein ICP27 is required for this effect. J. Virol.68:7790–7799.
21. Hibbard, M. K., and R. M. Sandri-Goldin.1995. Arginine-rich regions suc-ceeding the nuclear localization region of the herpes simplex virus type 1 regulatory protein ICP27 are required for efficient nuclear localization and late gene expression. J. Virol.69:4656–4667.
22. Hobbs, W. E., II, and N. A. DeLuca.1999. Perturbation of cell cycle pro-gression and cellular gene expression as a function of herpes simplex virus ICP0. J. Virol.73:8245–8255.
23. Iyer, V. R., M. B. Eisen, D. T. Ross, G. Schuler, T. Moore, J. C. F. Lee, J. M. Trent, L. M. Staudt, J. Hudson, Jr., M. S. Boguski, D. Lashkari, D. Shalon, D. Botstein, and P. O. Brown.1999. The transcriptional program in the response of human fibroblasts to serum. Science283:83–87.
24. Jarman, R. G., E. K. Wagner, and D. C. Bloom.1999. LAT expression during an acute HSV infection in the mouse. Virology262:384–397.
25. Khodarev, N. N., S. J. Advani, N. Gupta, B. Roizman, and R. R. Weichsel-baum.1999. Accumulation of specific RNAs encoding transcriptional factors and stress response proteins against a background of severe depletion of cellular RNAs in cells infected with herpes simplex virus 1. Proc. Natl. Acad. Sci. USA96:12062–12067.
26. Kretzshmar, M., K. Kaiser, F. Lottspeich, and M. Meisterernst.1994. A novel mediator of class II gene transcription with homology to viral imme-diate-early transcriptional regulators. Cell78:525–534.
27. Lieu, P. T., and E. K. Wagner.2000. The kinetics of VP5 mRNA expression is not critical for viral replication in cultured cells. J. Virol.74:2770–2776. 28. Luo, L., R. C. Salunga, H. Guo, A. Bittner, K. C. Joy, J. E. Galindo, H. Xiao,
K. E. Rogers, J. S. Wan, M. R. Jackson, and M. G. Erlander.1999. Gene expression profiles of laser-captured adjacent neuronal subtypes. Nat. Med.
5:117–122.
29. McGeoch, D. J.1991. Correlation between HSV-1 DNA sequence and viral transcription maps, p. 29–48.InE. K. Wagner (ed.), Herpesvirus transcrip-tion and its regulatranscrip-tion. CRC Press, Boca Raton, Fla.
30. Pande, N. T., M. D. Petroski, and E. K. Wagner.1998. Functional modules important for activated expression of early genes of herpes simplex virus type 1 are clustered upstream of the TATA box. Virology246:145–157. 31. Petroski, M. D., and E. K. Wagner.1998. Purification and characterization of
a cellular protein that binds to the downstream activation sequence of the strict late UL38 promoter of herpes simplex virus type 1. J. Virol.72:8181– 8190.
32. Randall, G., M. Lagunoff, and B. Roizman.1997. The product of ORF O located within the domain of herpes simplex virus 1 genome transcribed during latent infection binds to and inhibitsin vitrobinding of infected cell protein 4 to its cognate DNA site. Proc. Natl. Acad. Sci. USA94:10379– 10384.
33. Randall, G., and B. Roizman.1997. Transcription of the derepressed open reading frame P of herpes simplex virus 1 precludes the expression of the antisense␥134.5 gene and may account for the attenuation of the mutant virus. J. Virol.71:7750–7757.
34.Rice, S. A., and D. M. Knipe.1990. Genetic evidence for two distinct trans-activation functions of the herpes simplex virus alpha protein ICP27. J. Virol.
64:1704–1715.
35.Rice, S. A., V. Lam, and D. M. Knipe.1993. The acidic amino-terminal region of herpes simplex virus type 1 alpha protein ICP27 is required for an essen-tial lytic function. J. Virol.67:1778–1787.
36. Rice, S. A., L. S. Su, and D. M. Knipe.1989. Herpes simplex virus alpha protein ICP27 possesses separable positive and negative regulatory activities. J. Virol.63:3399–3407.
37. Roizman, B., and A. E. Sears.1996. Herpes simplex viruses and their repli-cation, p. 2231–2295.InB. N. Fields, D. M. Knipe, R. M. Chanock, M. S.
Hirsch, J. L. Melnick, T. P. Monath, and B. Roizman (ed.), Virology. Raven Press, New York, N.Y.
38. Rosen-Wolff, A., J. Scholz, and G. Darai.1989. Organotropism of latent herpes simplex virus type 1 is correlated to the presence of a 1.5 kb RNA transcript mapped within the BamHI DNA fragment B (0.738 to 0.809 map units). Virus Res.12:43–51.
39. Sacks, W. R., C. C. Greene, D. P. Aschman, and P. A. Schaffer.1985. Herpes simplex virus type 1 ICP27 is an essential regulatory protein. J. Virol.55:
796–805.
40. Sandri-Goldin, R. M.1991. Analysis of the regulatory activities of the HSV-1
␣protein ICP27, p. 77–104.InE. K. Wagner (ed.), Herpesvirus transcription and its regulation. CRC Press, Boca Raton, Fla.
41. Sandri-Goldin, R. M.1998. ICP27 mediates HSV RNA export by shuttling through a leucine-rich nuclear export signal and binding viral intronless RNAs through an RGG motif. Genes Dev.12:868–879.
42. Sandri-Goldin, R. M., M. K. Hibbard, and M. A. Hardwicke.1995. The C-terminal repressor region of herpes simplex virus type 1 ICP27 is required for the redistribution of small nuclear ribonucleoprotein particles and splic-ing factor SC35; however, these alterations are not sufficient to inhibit host cell splicing. J. Virol.69:6063–6076.
43. Sawtell, N. M.1997. Comprehensive quantification of herpes simplex virus latency at the single-cell level. J. Virol.71:5423–5431.
44. Sawtell, N. M., D. K. Poon, C. S. Tansky, and R. L. Thompson.1998. The latent herpes simplex virus type 1 genome copy number in individual neurons is virus strain specific and correlates with reactivation. J. Virol.72:5343– 5350.
45. Schaffer, P. A., E. K. Wagner, G. B. Devi-Rao, and V. G. Preston.1987. Herpes simplex virus, p. 93–98.InS. O’Brien (ed.), Genetic maps 1987. Cold Spring Harbor Laboratory, Cold Spring Harbor, N.Y.
46. Schena, M., R. A. Heller, T. P. Theriault, K. Konrad, E. Lachenmeier, and R. W. Davis.1998. Microarrays: biotechnology’s discovery platform for func-tional genomics. Trends Biotechnol.16:301–306.
47. Schena, M., D. Shalon, R. W. Davis, and P. O. Brown.1995. Quantitative monitoring of gene expression patterns with a complementary DNA mi-croarray. Science270:467–470.
48. Singh, J., and E. K. Wagner.1993. Transcriptional analysis of the TRL/UL region of herpes simplex virus type 1. Virology196:220–231.
49. Smith, I. L., M. A. Hardwicke, and R. M. Sandri-Goldin.1992. Evidence that the herpes simplex virus immediate early protein ICP27 acts post-transcrip-tionally during infection to regulate gene expression. Virology186:74–86. 50. Soliman, T. M., R. M. Sandri-Goldin, and S. J. Silverstein.1997. Shuttling
of the herpes simplex virus type 1 regulatory protein ICP27 between the nucleus and cytoplasm mediates the expression of late proteins. J. Virol.71:
9188–9197.
51. Thompson, R. L., and N. M. Sawtell.2000. Replication of herpes simplex virus type 1 within trigeminal ganglia is required for high frequency but not high viral genome copy number latency. J. Virol.74:965–974.
52. Uprichard, S. L., and D. M. Knipe.1996. Herpes simplex ICP27 mutant viruses exhibit reduced expression of specific DNA replication genes. J. Vi-rol.70:1969–1980.
53. Wagner, E. K.1999. Herpes simplex virus—molecular biology, p. 686–697.In
R. G. Webster and A. Granoff (ed.), Encyclopedia of virology. Academic Press, London, England.
54. Wagner, E. K., and D. C. Bloom.1997. The experimental investigation of herpes simplex virus latency. Clin. Microbiol. Rev.10:419–443.
55. Wagner, E. K., J. F. Guzowski, and J. Singh.1995. Transcription of the herpes simplex virus genome during productive and latent infection. Prog. Nucleic Acid Res. Mol. Biol.51:123–168.
56. Wagner, E. K., M. D. Petroski, N. T. Pande, P. T. Lieu, and M. K. Rice.1998. Analysis of factors influencing the kinetics of herpes simplex virus transcript expression utilizing recombinant virus. Methods16:105–116.
57. Ward, P. L., D. E. Barker, and B. Roizman.1996. A novel herpes simplex virus 1 gene, UL43.5, maps antisense to the UL43 gene and encodes a protein which colocalizes in nuclear structures with capsid proteins. J. Virol.70:
2684–2690.
58. Xiao, P., and J. P. Capone.1990. A cellular factor binds to the herpes simplex virus type 1 transactivator Vmw65 and is required for Vmw65-dependent protein-DNA complex assembly with Oct-1. Mol. Cell. Biol.10:4974–4977. 59. Yeh, L., and P. A. Schaffer.1993. A novel class of transcripts expressed with late kinetics in the absence of ICP4 spans the junction between the long and short segments of the herpes simplex virus type 1 genome. J. Virol.67:
7373–7382.
60. York, I. A., C. Roop, D. W. Andrews, S. R. Riddell, F. L. Graham, and D. C. Johnson.1994. A cytosolic herpes simplex virus protein inhibits antigen presentation to CH8⫹T lymphocytes. Cell77:525–535.
61. Zhang, Y., D. A. Sirko, and J. L. C. McKnight.1991. Role of herpes simplex virus type 1 UL46 and UL47 in␣TIF-mediated transcriptional induction: characterization of three viral deletion mutants. J. Virol.65:829–841. 62. Zhang, Y. F., and E. K. Wagner.1987. The kinetics of expression of
indi-vidual herpes simplex virus type 1 transcripts. Virus Genes1:49–60.