International Journal of
ELECTROCHEMICAL
SCIENCE
www.electrochemsci.org
Light Lanthanides Determination by Fast Fourier Transform
Continuous Cyclic Voltammetry after Separation by
Ion-exchange Chromatography
Mohammad Reza Pourjavid,1 Parviz Norouzi*,1,2, Mohammad Reza Ganjali1,2
1Center of Excellence in Electrochemistry, Faculty of Chemistry, University of Tehran, Tehran, Iran 2 Endocrinology & Metabolism Research Center, Medical Sciences/University of Tehran, Tehran, Iran *E-mail: [email protected]
Received: 25 May 2009 / Accepted: 20 June 2009 / Published: 19 July 2009
Cation-exchange separations of the light lanthanides (La3+, Ce3+, Pr3+ and Nd3+) on Nucleosil 100-5-SA ion-exchange column with use of α-hydroxyisobutyricacid (HIBA) as elution agent was investigated in this study. For easy detection and identification, fast Fourier transform continuous cyclic voltammetry (FFT-CCV) was used as detection method. The developed technique is very simple, precise, accurate, time saving, and economical, compared to previously reported methods. The influence of HIBA concentration as well as pH of eluent was studied. The best performance obtained at pH value of 4.0, scan rate value of 30 V/s, accumulation potential of -300 mV, and accumulation time of 0.3 s. The proposed method displays a linear dynamic range between 250 and 21000 ppb and a detection limit of 90 ppb. Precision, inter-day precission and accuracy of the assay have presented too. This method posse some advantages in comparison with former ones such as, no need for the removal of oxygen from the test solution, a reasonable detection limit, and finally the method is sufficiently fast for the determination of any such compound, in a wide variety of chromatographic methods. The potential waveform, consisting of the potential steps for cleaning, accumulation and potential ramp of analyte, was continuously applied on an Au disk microelectrode (12.5 mm in radius).
Keywords: Light lanthanides; α-hydroxyisobutyricacid; Flow injection; Continuous cyclic voltammetry
1. INTRODUCTION
(HPLC), ion chromatography (IC) and capillary electrophoresis (CE) for separation of lanthanides [2-14]. They have been shown to be rapid, precise, accurate, and low-cost for the determination of lanthanides in a wide variety of matrices. Separation is based mainly on the exploitation of the metal complexation properties of the lanthanides. These complexation reactions can take place in either the mobile or stationary phase and even in both. Researchers suggested different chromatographic mechanisms account for the complexation reactions mentioned above such as reversed-phase [11, 15], ion-pair [16, 17], ion-exchange [18–21] or chelating ion chromatography (HPCIC) [22, 23].
Ion chromatography is an attractive procedure for lanthanides analysis. Typically, low-capacity cation-exchange resins are used as stationary phases, with aqueous solutions of complexing agents as the mobile phases. Many eluents like α-hydroxyisobutyricacid (α -HIBA) [24-30], mandelic acid [29], oxalic acid [15], glycolic acid [30], lactic acid [31] can use for separation of lanthanide ions. Except of these carboxylic acides, EDTA used as mobile phase recently for separation of lanthanides [32]. Of course a mixed gradient of two eluents can be used too [33, 34]. HIBA is the most popular eluting agent amongst different hydroxycarboxylic acids that used for the separation of lanthanides and has been shown to provide a good degree of separation between adjacent lanthanides in ion chromatography. Lanthanide metal ions form singly positive charged complexes with HIBA that lower the affinity of the lanthanide for the cation-exchange resin. The degree of complexation increases with increasing atomic number of elements. Two equilibria must be considered. The first one is the equilibrium between the eluent and the resin, and the second one is the equilibrium between the lanthanide and the lanthanide-HIBA complexes. This secondary equilibrium permits the separation of the lanthanides because each lanthanide has a different relative stability with HIBA. Therefore, lanthanides that form the most stable complex with HIBA, such as Neodymium, will spend relatively more time in the eluent and elute first. Lanthanides such as lanthanum, which forms a weaker complex with HIBA, prefer to spend more time in the resin and elute later. Stronger complexing agents such as oxalic acid cause to formation of anionic complexes. In these cases, anion-exchang chromatography uses for separation. Because the strongest complexes are the most negatively charged, the elution order is reversed from that of the cation-exchange separations. So, in the present study we used HIBA as eluting agent.
The separated lanthanides are occasionally determined using the post-column derivatization method. Different complexing reagents especially Arsenazo-III and PAR have been proposed for achieving an efficient detection for all lanthanides, and also for suppressing interference problems due to the presence of other cations [1, 4, 5, 9]. Use of ICP-AES and ICP-MS interfaced with ion chromatography for detection of lanthanides ever-increasing in the last years [35-37]. A large amount of organic reagent used as the mobile phase may cause spectral interferences duo to molecular bands such as CO, CN, OH or NH. In addition, due to the high viscosity of concentrated salt solutions, they tend to influence the nebulization efficiency. In the case of ICP-MS, the interferences due to polyatomic ions cause a serious problem [38, 39].
lanthanide ions with FFT-CCV is faster than other detection method, especially UV-Vis spectrometry, because in these methods pre- or post-column derivatization is necessary that can be time consuming and expensive.
Because of the selective detector, voltammetric techniques are useful for the samples. In addition, owing to the movement of the analyte zone in an electrochemical flow cell for flowing solutions, the application of these techniques requires fast analyte accumulation and fast potential sweeping (which is not appropriate for large electrodes) [53, 54]. The use of voltammetric techniques have been further stimulated by the advent of ultra-micro electrodes (UMEs), due to their steady state currents, higher sensitivity, increased mass transport and their ability to be used in electroanalysis in solutions with high resistance [55, 56]. UMEs, for instance, have been applied as sensors in various techniques such as flow injection analysis (FIA) [57, 58], cardiovascular monitoring and organic compounds analysis [59, 60]. Another problem comes from the changes in the characteristics of the electrode surface during the potential scan. The electrode signal will have a large background current, if the surface of the solid electrode is oxidized and reduced during voltammetric measurements (the response of the electrode will have a large background current), which is associated with high levels of noise due to the structural changes of the electrode surface, currents like this can interfere with the electrode processes of interest, and may adversely affect the detection limits of the methods used.
The background current in voltammetric measurements, as discussed later, can provide useful information about the adsorption processes and changes in the double layer at the electrode surface [61]. In addition, small amounts of adsorption of species, present in the solution, on the electrode surface can strongly affect the cathodic and anodic currents of red/ox reaction of the electrode. For calculation of the signal of the analyte and noise reduction, a special computer based numerical method is also introduced. The calculation of signal was based on the net partial and total charge exchanges at electrode surface and was done by integrating the currents at the selected potential range at the cyclic voltammogram (CV). Depending on the conditions applied, the detector can be used in determination of various species in chromatographic analysis methods (e.g., HPLC and IC). Moreover, the sensitivity of the method significantly depends on the mode of data processing that is used in calculation of the detector response.
2. EXPERIMENTAL PART 2.1. Apparatus
The model IC760 (Metrohm) was used during the ion chromatographic experiments. Characterization of some useful cation exchangers was presented in Table 1 [62]. However, in the case of separation of the light lanthanides, the ion-exchanger DOWEX 50WX8 was used. The operation was completed under the flow rate 1.5 mL/min.
[image:4.612.79.539.214.434.2]
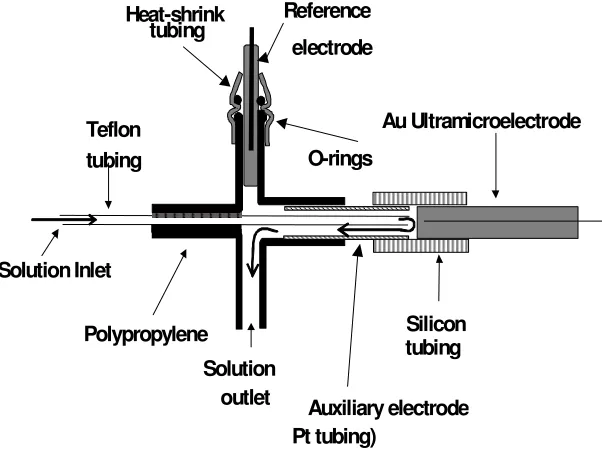
the flow injection analysis. Flow rate of the pump was set at 3mL/min during an experimental run. The solutions were introduced into the sample loop by a plastic syringe. After, opening the loop in the way of eluent flow, the sample can pass over the working electrode. In figure 1, the electrochemical cell of the flow injection analysis was shown in detail. The potentiostate applies a potential in the range of gold oxidation in acidic media and the potential waveform was shown in figure 2. The special program on computer can monitor the cyclic voltammograms online and every change on current or charge will be shown in program.
Table 1. Characterization of cation-exchanger
Character (*)
Trade Name Procedure (**)
Active Group Matrix Effective pH
Total Exchange Capacity (meq/ml)
Standard Mesh Range SAC Dowex 50 1 Sulfonic acid Polystyrene 0-14 Na+ 1.9
H+ 1.7 20-50 (wet)
SAC Dowex MPC-1
4 Sulfonic acid Polystyrene 0-14 1.6-1.8
H+ form 20-40 (wet)
SAC Dowex 50WX8
1 Sulfonic acid Polystyrene 0-14 1.7
H+ form 50-100
SAC Duolite C-20 2 Sulfonic acid Polystyrene 0-14 2.2 16-50 SAC Ionac 240 3 Sulfonic acid Polystyrene 0-14 1.9 16-50 SAC Duolite C-3 2 Methylene
Sulfonic
Phenolic 0-9 1.1 16-50
WAC Dowex CCR-1 4 Carboxylic Phenolic 0-9 - 20-50 (wet) WAC Duolite ES-63 2 Phosphonic Polystyrene 4-14 3.3 16-50 WAC Duolite ES-80 2 Aliphatic Acrylic 6-14 3.5 16-50 * SAC: Strong Acid Cation, WAC: Weak Acid Cation
** 1. Dow, 2. Diamond Shamarck, 3. Ionac, 4. Nalco
Solution outlet Teflon
tubing
Polypropylene
Reference
electrode
O-rings Heat-shrink
tubing
Auxiliary electrode Pt tubing)
Silicon tubing
Au Ultramicroelectrode
Solution Inlet
[image:4.612.155.456.464.690.2]E
C1E
C2E
initial
E
vertex
E
final
P
o
te
n
ti
a
l
Time
E
s [image:5.612.137.477.80.298.2]EC Cleaning Stripping Current Measurement
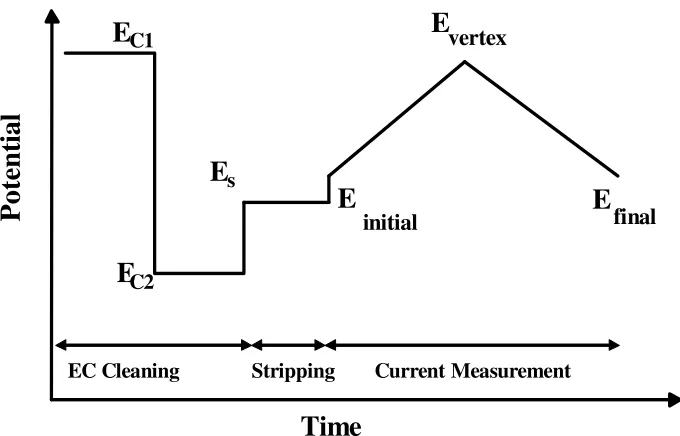
Figure 2. The diagram of the applied potential waveform
2.2. Reagents
The oxide of lanthanides, hydrochloric acid and HIBA were of the high purity available from the Merk Chemicals and were used without further purification. HIBA was 0.3 M buffered at pH 4.0 with sodium hydroxide. The reagents for the preparation of the eluent solution for the flow injection analysis (0.05 mol/L H3PO4) and 1 mol/L NaOH (for the pH eluent adjustment), were obtained from Merck. All solutions were prepared in doubly distilled deionized water, filled with the background electrolyte solution and they were used without the removal of the dissolved oxygen.
2.3. Background electrolyte (BGE) and standard solutions
The running buffer or BGE was made by phosphoric acid (85%, w/v) with the addition of 8.7mL into a 1000mL volumetric flask and dilution to a constant volume with distilled water. The pH was adjusted to the value of 4.0 with sodium hydroxide. The solutions were freshly prepared and filtered, using a Millipore filter (0.45 µm) each day.
2.4. Electrode preparation
The construction of the gold UMEs (12.5 µm in radius) involved the metal micro-wires (Good fellow Metals Ltd., UK) sealing into a soft glass capillary. Then, the capillary was cut perpendicularly to its length to expose the wire. Silver epoxy (Johnson Matthey Ltd., UK) was used for the electrical contacts. Previous to the initiation of any experiment, the electrode surface was polished for 1 min using extra fine carborundum paper and, afterwards, for 10 min with 0.3 µm alumina. Prior to being placed in the cell, the electrode was washed with water. In all measurements, an Ag (s)|AgCl (s)|KCl (aq, 1 M) reference electrode was used. The auxiliary electrode was made of a Pt wire, 1 cm in length and 0.5 mm in diameter.
3. RESULTS AND DISCUSSION
3.1. Data acquisition and processing
For the data acquisition, a setup of a PC PIV Pentium 900MHz microcomputer, equipped with a data acquisition board (PCL-818HG, Advantech. Co.) and a custom made potentiostat, was used. All data acquisition and data processing programs were developed in Delphi 6® program environment. In figure 2, the applied waveform potential diagram during the cyclic voltammetric measurements is shown. The potential waveform consists of three parts; (a) Potential steps, Ec1 and Ec2 (which are used for the oxidation and reduction of the electrode surface, respectively), during which the electrochemical cleaning of the electrode surface takes place, (b) Ec, where the analyte accumulation takes place and (c) the potential ramp, where the current measurements occur.
During the scan, some of the adsorbed analyte molecules are desorbed. Depending on the rate of those processes and the scan rate, the amount of the desorption analyte molecules (during the scan) can be changed. The important point here is that part of the adsorbed analyte molecules still remain on the electrode surface, inhibiting the red/ox process of the electrode surface. In this technique, ∆Q is calculated according with the all current changes at the CVs [63-67].
Application of a special digital filtration, which is applied during the measurement, is one of the considerable aspects of this method. At first, an electrode CV was recorded and then by applying FFT on the collected data, the existing high frequency noises were indicated. With the aid of this information, the cutoff frequency of the analog filter was set at a certain value (where the noises were removed from the CV).
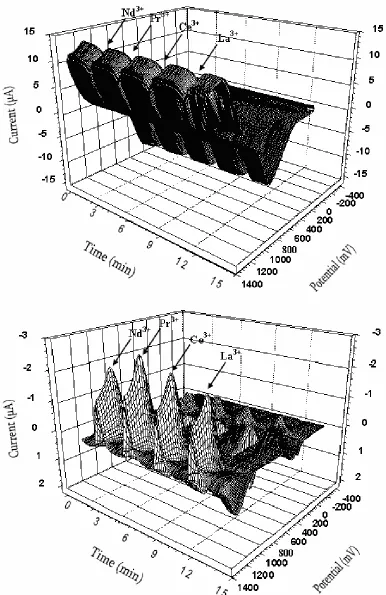
Figure 3. (a) Cyclic voltammogram at a 12.5 µm Au ultramicroelectrode recorded during a flow injection experiment. The eluent was 0.05 M H3PO4, the flow rate was 100 µL/s and the sweep rate was 30 V/s. Each scan was preceded by 100 ms
(at 600 mV) and 100 ms (at -800 mV) conditioning, respectively. The accumulation time was 300 ms at -300 mV. The injected solution (50 µL) contained 1.0 ppm La3+, Ce3+, Pr3+ and Nd3+ in 0.05M H
3PO4. (b) Curves result from the
An example of the recorded CVs is demonstrated in figure 3 (a and b). Figure 3a shows a CV sequence recorded during the flow analysis for the lanthanides determination. The injection volume was 50 µL of (1.0 ppm) La3+, Ce3+, Pr3+ and Nd3+ (in 0.05 mol/L H3PO4) into the eluent solution, containing 0.05 mol/L H3PO4. The time axis of the graph represents the time of the flow injection experiment. In the absence of light lanthanide ions, the shape of the CV curves is typical for a polycrystalline gold electrode in acidic media [69]. Figure 3b illustrates the absolute current changes in the CVs curves, after subtracting the average background of 4 CVs (in the absence of the analytes). Evidently, this way of presenting the electrode response gives more details about the adsorbed ion effect on the CV currents. As a matter of fact, the curves show that the current changes mainly take place at the potential regions of the oxidation and reduction of gold. When the electrode-solution interface is exposed to light lanthanide ions, which can be adsorbed on the electrode, the oxide formation process becomes severely inhibited. In detail, the surface process inhibition causes significant change in the currents at the potential region and, as a consequence, the profound changes in the shape of the CVs take place.
Theoretically, the analyte response can be affected by the thermodynamic and kinetic parameters of adsorption, the mass transport rate and the electrochemical behavior of the adsorbed species. The free energy and the adsorption rate depend on the electrode potential, the electrode material and, to some extent, on the choice of the concentration and the type of the supporting electrolyte. By taking these points into consideration, for the achievement of the detector maximum performance, the effect of the experimental parameters (such as the pH of the supporting electrolyte, the potential, the accumulation time and the potential scan rate) must be examined and optimized [70-76].
Table 2. Stability constants (logK) of light lanthanides with α-HIBA used as complexing agent at
20°C
Lanthanide logK
Lanthanum 5.53 Cerium 5.95 Praseodymium 6.21 Neodymium 6.30
3.2. Experimental parameter optimization
complex under different environmental conditions can be different.the log values of the stability constant for complexes of light lanthanides with HIBA vary from 5.53 for La (III) to 6.30 for Nd (III) that reported in the literature [78] are given in Table 2. These give only a qualitative picture of the behavior during separation of lanthanides; however the exact performance can be different.
3.2.1. Effect of pH of eluent on retention of lanthanide ions
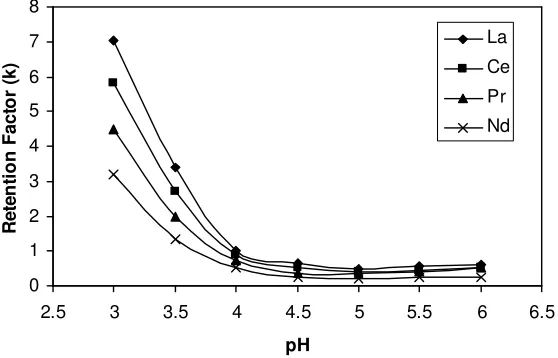
Effect of mobile phase pH on the elution pattern of a mixture of light lanthanide ions using HIBA is shown in figure 4. This effect was monitored using retention factor (K). The analytical expression for K is:
0 0)
( t
t t
K R −
=
(1)
In this equation t0 is retention time of non-retained peak and tR is retention tiome of the eluent retained. As can be seen, increasing pH from 3.0 to 6.0 caused decrease of retention factor (K) for lanthanide ions. The elution efficiency of carboxylic acids changes with pH. This factor of the carboxylic acid depends on its strength, which in turn depends on its pH. The α-hydroxycarboxylic acids tested were all weak acids and undergo only partial ionization and hence show poor eluting strength at low pH [15]. With increasing pH, the elusion efficiency increased due to greater ionization of the –COOH group. Against the low pH, at higher pH, the retention factors for different lanthanides are quite close. So, pH 4.0 was selected as the optimum pH, which gives adequate resolution in a shorter time. Furthermore this pH was chosen because it is near to that of the maximum buffer capacity for HIBA.
0 1 2 3 4 5 6 7 8
2.5 3 3.5 4 4.5 5 5.5 6 6.5
pH
R
e
te
n
ti
o
n
F
a
c
to
r
(k
)
La
Ce
Pr
Nd
Figure 4. Effect of pH of mobile phase on retention of light lanthanides DOWEX 50WX8 under
[image:9.612.147.426.483.662.2]
3.2.2. Effect of concentration of eluent on retention of lanthanide ions
The influence of the concentration of HIBA on retention of light lanthanides is shown in figure 5. In high concentrations of eluent, elution of lanthanides is faster. The effect of concentration of HIBA was studied at pH 4.0. Under this condition, HIBA is ~ 63% ionized (pKa =3.77) [79]. With the increase in concentration of α-HIBA, the concentration of α-hydroxyisobutyrate ions increases in the mobile phase and this results in faster elution of lanthanides on the column.
0 0.4 0.8 1.2 1.6 2 2.4 2.8
0.15 0.2 0.25 0.3 0.35 0.4 0.45
Concentration of HIBA [M]
R
e
te
n
ti
o
n
F
a
c
to
r
(k
)
La
Ce
Pr
[image:10.612.147.427.197.381.2]Nd
Figure 5. Effect of concentration of HIBA of pH 4.0 on retention of lanthanides on DOWEX 50WX8
3.2.3. Influence of sweep rate, accumulation potential and accumulation time
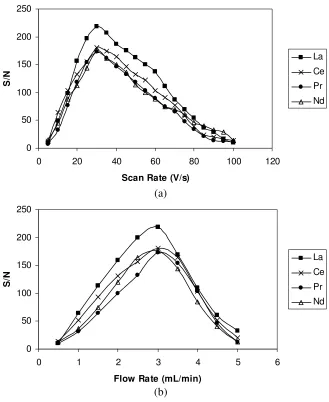
For the investigation of the scan rates influence and the eluent flow rate on the sensitivity of the detector response, solutions having a concentration of (1.0 ppm) in La3+, Ce3+, Pr3+ and Nd3+ were injected. At different scan rates (from 5 to 100 V/s) and eluent flow, the detector responses to the injected sample were recorded. These results are presented in figure 6. As it is clear from figure 6a, the detector exhibits the maximum sensitivity at the scan rate of (30 V/s) and figure 6b shows that flow rate of (3 mL/min) is the best. The sweep rate effects on the detection performance can be considered in three different aspects: firstly, speed in data acquisition; secondly, kinetic factors of the lanthanide ions adsorption and, finally, the eluent flow rate which controls the time window of the solution zone in the detector. The main reason for the application of high scan rates is prevention from desorption of the adsorbed lanthanide ions during the potential scanning (because under this condition, the inhibition outcome of the adsorbed lanthanide ions on the oxidation process can take place).
accumulation occurs at a potential that is greater or smaller than Ei. However, the sensitivity of the detection system mainly depends on the potential sweep rate, mostly because of the adsorption kinetic factors and the instrumental limitations. Notably, any changes in the parameters, related to the adsorption process and affecting the applied potential, the time and the potential of accumulation, severely influence the sensitivity of the measurement. For that reason, the influence of the accumulation potential and time on the response of the method for the injection of a solution of (1.0 ppm) La3+, Ce3+, Pr3+ and Nd3+ in 0.05 mol/L H
3PO4, was studied. Figure 7 shows the detector response over the accumulation potential ranges from (−800 to 600 mV) and the accumulation time range from (0.05 to 1.0 s). From figure 7a and 7b derives the conclusion that the optimum conditions to be chosen are accumulation potential of (-300 mV) and accumulation time of (300 ms), on the grounds that the electrode surface becomes lanthanide ions saturated within a (1300 ms) time window.
0 50 100 150 200 250
0 20 40 60 80 100 120
Scan Rate (V/s)
S
/N
La
Ce
Pr
Nd
(a)
0 50 100 150 200 250
0 1 2 3 4 5 6
Flow Rate (mL/min)
S
/N
La
Ce
Pr
Nd
(b)
Figure 6. (a) The effect of the sweep rate and (b) the effect of flow rate on the response of the Au
[image:11.612.145.474.267.669.2]
On the electrode, the lanthanide ions accumulation takes place during the accumulation step (assuming that an appropriate potential is selected). In fact, the difference in the saturation time of the various compounds can be related to the existing differences in their kinetics of the electron transfer and mass transport. As mentioned above, the surface of the gold ultra microelectrode is small and in a short time the electrode surface can be saturated.
0 50 100 150 200 250
-1000 -800 -600 -400 -200 0 200 400 600 800
Accumulation Potential (mV)
S
/N
La
Ce
Pr
Nd
(a)
0 50 100 150 200 250
0 0.2 0.4 0.6 0.8 1 1.2
Accumulation time (s)
S
/N
La
Ce
Pr
Nd
[image:12.612.145.479.162.584.2](b)
Figure 7. (a) The effect of the accumulation potential and (b) the effect of the accumulation time on
the electrode response to injections of 1.0 ppm La3+, Ce3+, Pr3+ and Nd3+ in 0.05 mol/L H3PO4.
3.3. Validation
(a)
(b)
150 170 190 210 230 250
0 5000 10000 15000 20000 25000 30000 35000
C(ppb)
S
/N
y = 0.0041x + 155.83 R2 = 0.9996
150 170 190 210 230 250
0 5000 10000 15000 20000 25000
C(ppb)
S
/N
120 140 160 180 200 220
0 5000 10000 15000 20000 25000 30000 35000
C(ppb)
S
/N
y = 0.0035x + 128.11 R2 = 0.9992
120 140 160 180 200 220
0 5000 10000 15000 20000 25000
C(ppb)
S
(c)
[image:14.612.118.502.97.655.2](d)
Figure 8. Calibration curves obtained for (a) La3+, (b) Ce3+, (c) Pr3+, (d) Nd3+ ions on the Au electrode
in 0.05 mol/L H3PO4.
100 120 140 160 180 200 220
0 5000 10000 15000 20000 25000 30000 35000
C(ppb)
S
/N
y = 0.0041x + 111.52 R2
= 0.9992
100 120 140 160 180 200 220
0 5000 10000 15000 20000 25000
C(ppb)
S
/N
90 110 130 150 170 190 210 230
0 5000 10000 15000 20000 25000 30000 35000
C(ppb)
S
/N
y = 0.0049x + 102.32 R2
= 0.9994
90 110 130 150 170 190 210
0 5000 10000 15000 20000 25000 C(ppb)
S
square regression method [84, 85]. The calibration curves, constructed for light lanthanide ions were linear over the concentration range of (250–21000 ppb). The peak areas of La3+, Ce3+, Pr3+ and Nd3+ were plotted versus its concentration and, then, linear regression analysis was carried out on the resultant curve. After this analysis, a correlation coefficient of R = 0.999 and %R.S.D. values, ranging from 0.18 to 3.85 % across the studied concentration range, were obtained. Typically, the regression equation for the calibration curve was found to be Y = 0.0041X + 155.83, Y = 0.0035X + 128.11, Y = 0.0041X + 111.52 and Y = 0.0049X + 102.32 for La3+, Ce3+, Pr3+ and Nd3+ respectively. Figure 8 depicts the calibration graphs that resulted from the monitoring of these lanthanide ions in a 0.05 mol/L H3PO4.
Concerning the LOD value, it was measured as the lowest analyte amount that may be detected to produce a response, which is significantly different from that of a blank one. The limit of detection was approved by calculations, based on the standard deviation of the response (δ) and the slope (S) of the calibration curve, at the levels approaching the limits according to the equation LOD = 3.3 (δ/S) [86]. The LOD for La3+, Ce3+, Pr3+ and Nd3+ was found to be 90 ppb. On the other hand, the LOQ was measured as the lowest analyte amount that can be reproducibly quantified above the baseline noise, for which triplicated injections resulted in an R.S.D. ≤1.49 %. A practical LOQ, giving a good precision and acceptable accuracy, was equivalent to 250 ppb.
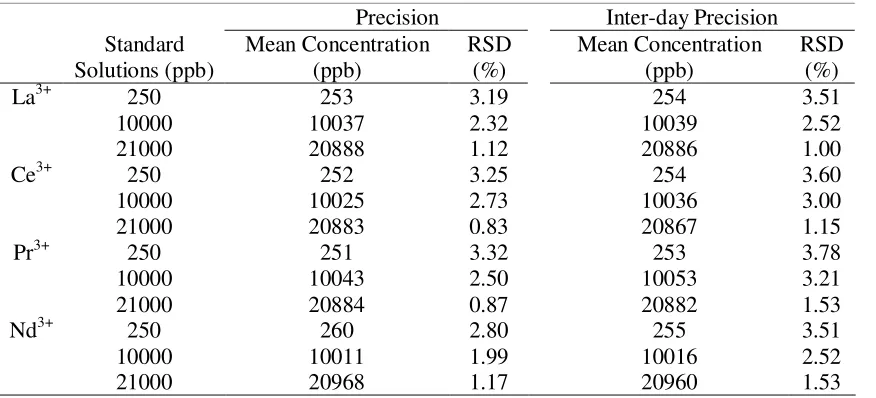
[image:15.612.92.530.474.673.2]The precision of the assay was investigated with respect to both repeatability and reproducibility. The repeatability was investigated by injecting nine replicate samples of each of the (250, 10000 and 21000 ppb) standards. Additionally, the inter-day precision was assessed by injecting the same three concentrations over 3 consecutive days. The results are written in Table 3.
Table 3. Precision and inter-day precision of the assay
Inter-day Precision Precision RSD (%) Mean Concentration (ppb) RSD (%) Mean Concentration (ppb) Standard Solutions (ppb) 3.51 254 3.19 253 250 La3+ 2.52 10039 2.32 10037 10000 1.00 20886 1.12 20888 21000 3.60 254 3.25 252 250 Ce3+ 3.00 10036 2.73 10025 10000 1.15 20867 0.83 20883 21000 3.78 253 3.32 251 250 Pr3+ 3.21 10053 2.50 10043 10000 1.53 20882 0.87 20884 21000 3.51 255 2.80 260 250 Nd3+ 2.52 10016 1.99 10011 10000 1.53 20960 1.17 20968 21000
[image:16.612.158.456.166.353.2]
as previously described. In each case, the relevant error percentage and the accuracy were calculated. Table 4 shows the resultant concentrations with their relevant error percentage.
Table 4. Accuracy of the assay
Relevant Error (%) Resultant Concentration (ppb) Standard Solutions (ppb) 2.40 256 ± 2.04
250 La3+
0.98 10098 ± 63.22
10000
.48 20899 ± 73.50
21000
3.20 258 ± 4.65
250 Ce3+
1.11 10111 ± 42.55
10000
0.44 20908 ± 66.66
21000
1.60 254 ± 3.12
250 Pr3+
0.67 10067 ± 25.01
10000
0.28 20942 ± 51.36
21000
3.60 259 ± 5.50
250 Nd3+
0.85 10085 ± 60.27
10000
0.38 20921 ± 24.17
[image:16.612.149.464.413.600.2]21000
Table 5. Influence of the changes in the experimental conditions on the performance of the FIA system
%Recovery Nd3+ Pr3+ Ce3+ La3+ Modification Parameter 99.6 100.2 99.9 100.6 3.9 pH 100.0 100.5 100.3 100.6 4.0 99.8 100.4 100.2 99.8 4.1 100.0 98.8 100.4 100.0 2.6 Flow Rate 100.0 100.6 100.3 100.2 2.8 (mL/min) 100.2 99.8 100.3 100.1 3.0 100.3 100.3 101.3 98.7 0.07 Buffer 102.0 101.7 102.0 99.9 0.06 Composition 99.1 100.0 100.0 100.1 0.05 (M) 100.0 101.8 99.4 101.1 20 Lab. 101.4 101.6 101.5 101.2 25 Temprature 101.4 99.7 101.2 101.1 30 (ºC)
Table 5, the light lanthanide ions recovery percentages were good under most conditions, not demonstrating any significant change when the critical parameters were modified.
3.4. Sensitivity comparison of the suggested method with other previously reported methods
Table 6 compares the detection limit of the proposed method with UV-Vis spectrometry, spectrofluorimetry, RI, ICP-AES and potentiometric methods. As can be seen, the sensitivity of FFT-CCV method is better than most of them.
Table 6. Comparison between the detection limits of the proposed method with the other reported
methods
Separation Method Detection Method Detection Limit Ref.
IEC Vis ~ 10 ppm 13
IEC Vis 5 ppm 16
IEC Spectrofluorimetry (mg Scale) 17 IEC Spectrofluorimetry (mg Scale) 18
CE UV 240 – 470 ppb 19
SPE-RP-Ion Pair-HPLC UV, RI 10 ppm 20
IEC ICP-AES 110 – 25 ppb 21
CE UV 530 – 960 ppb 22
RP-HPLC Diod Array Detector > 9 ppm 23
CE UV 4.8 ppm 24
IEC Vis 25 ppm 39
- Potentiometry 111 ppb 40
- Potentiometry 113 ppb 45
- Potentiometry 1 ppm 47
- Potentiometry 90 ppb 48
HPCIC Vis 4 ppm 58
IEC FFT-CCV 90 ppb This Work
ACKNOWLEDGEMENTS
The authors are grateful to the Research Council of University of Tehran for the financial support of this work.
References
1. M. R. Buchmeiser, Rev. Anal. Chem. 20 (2001) 161.
2. C. H. Knight, R. M. Cassidy, B. M. Recoskie and L. W. Green, Anal. Chem. 56 (1984) 474. 3. S .P. Verma, Lanthan. Actin. Res. 3 (1991) 237.
4. S .P. Verma, Geostand. Newslett. 15 (1991) 129.
[image:17.612.99.515.282.522.2]
7. Ş. Kutun and A. Akseli, J. Chromatogr. A, 874 (2000) 311. 8. N. Öztekin and F. B. Erim, J. Chromatogr. A, 895 (2000) 263.
9. M .R. Buchmeiser, G. Seeber and R. Tessadri, Anal. Chem. 72 (2000) 2595. 10. N. Öztekin and F. B. Erim, J. Chromatogr. A, 924 (2001) 541.
11. N. M. Raut, P. G. Jaison and S. K. Aggarwal, J. Chromatogr. A, 1052 (2004) 131. 12. A. Mazzucotelli, A. Dadone, R. Frache and F. Baffi, Chromatographia, 15 (1982) 697. 13. P .N. Nesterenko and P. N. Jones, J. Chromatogr. A, 804 (1998) 223.
14. N .M. Raut, P. G. Jaison and S. K. Aggarwal, J. Chromatogr. A, 959 (2002) 163.
15. E. Santoyo, R. García, K. A. Galicia-Alanis, S. P. Verma, A. Aparicio and A. Santoyo-Castelazo, J. Chromatogr. A, 1149 (2007) 12.
16. E. A. Jones, H.S. Bezuidenhout and J. F. Van Staden, J. Chromatogr. 537 (1991) 277. 17. R. Kuroda, T. Wada, Y. Kokubo and K. Oguma, Talanta, 40 (1993) 237.
18. M. C. Bruzzoniti, E. Mentasti and C. Sarzanini, Anal. Chim. Acta, 353 (1997) 239. 19. G. J. Sevenich and J. S. Fritz, Anal. Chem. 55 (1983) 12.
20. A. W. Al-Shawi and R. Dahl, Anal. Chim. Acta, 333 (1996) 23.
21. E. H. Borai, M. A. Eid and H. F. Aly, Anal. Bioanal. Chem. 372 (2002) 537. 22. P. Jones and P. N. Nesterenko, J. Chromatogr. A, 789 (1997) 413.
23. C. Y. Liu, N. M. Lee and T. H. Wang, Anal. Chim. Acta, 337 (1997) 173. 24. P. Dufek, M. Vobecky, J. Holik and J. Valasek, J. Chromatogr. 435 (1988) 249. 25. S. Elchuk and R. M. Cassidy, Anal. Chem. 51 (1979) 1434.
26. R. M. Cassidy, S. Elchuk, N. L. Elliot, L. W. Green, C. H. Knight and B. M. Recoskie, Anal. Chem. 58 (1986) 1181.
27. D. J. Barkley, M. Blanchette, R. M. Cassidy and S. Elchuk, Anal. Chem. 58 (1986) 2222. 28. J. M. Hwang, J. S. Shih, Y. C. Yeh and S. C. Wu, Analyst, 106 (1981) 869.
29. S. Elchuk, K. I. Burns, R. M. Cassidy and C. A. Lucy, J. Chromatogr. 558 (1991) 197. 30. R. Kuroda, T. Wada, G. Kishimoto and K. Oguma, Chromatographia, 32 (1991) 65. 31. L. E. Vera-Avila and E. Camacho, J. Liq. Chromatogr. 15 (1992) 835.
32. R. G. Fernández and J. I. G. Alonso, J. Chromatogr. A, 1180 (2008) 59. 33. C. Nuryono, G. Huber and K. Kleboth, Chromatographia, 48 (1998) 407.
34. H. Z. Wu, N. Watanabe, Y. Gohshi and R. Kotama, Fresenius J. Anal. Chem. 363 (1999) 424. 35. K. Yoshida and H. Haraguchi, Anal. Chem. 56 (1984) 2580.
36. J. I. Garcia Alonso, F. Sena, Ph. Arbore, M. Betti and L. Koch, J. Anal. At. Spectrom. 10 (1995) 381.
37. B. A. Haley and G. P. Klinkhammer, Mar. Chem. 82 (2003) 197. 38. M. Vaughan and G. Horlick, Appl. Spectrosc. 40 (1986) 434. 39. S. H. Tan and G. Horlick, Appl. Spectrosc. 40 (1986) 445.
40. M. R. Ganjali, Z. Memari, F. Faridbod, R. Dinarvand and P. Norouzi, Electroanalysis, 20 (2008) 2663.
41. M. B., Saleh, A. A. A. Gaber, M. M. R., Khalaf and A. M., Tawfeek, Anal. Lett. 39 (2006) 17. 42. V. K. Gupta, A. K. Singh and B. Gupta, Anal. Chim. Acta, 575 (2006) 204.
43. H. A. Zamani and M. Mohaddeszadeh, Anal. Lett. 41 (2008) 2710.
44. M. R. Ganjali, S. Rasoolipour, M. Rezapour, P. Norouzi and M. Adib, Electrochem. Commun. 7 (2005) 989.
45. M. R. Ganjali, P. Norouzi, F. S. Mirnaghi, S. Riahi and F. Faridbod, IEEE Sens. J. 115 (2007) 1138.
46. F. Faridbod, M. R. Ganjali, R. Dinarvand, P. Norouzi and S. Riahi, Sensors 8 (2008) 1645. 47. H. A. Zamani, M. R. Ganjali, P. Norouzi and S. Meghdadi, Anal. Lett. 41 (2008) 902.
48. H. Behmadi, H. A. Zamani, M. R. Ganjali and P. Norouzi, Electrochim. Acta, 53 (2007) 1870. 49. M. R. Ganjali, P. Norouzi, A. Daftari, F. Faridbod and M. Salavati-Niasari, Sens. Actuators B, 120
Electrochem. Sci. 3 (2008) 1559.
51. M. R. Ganjali, R. Nemati, F. Faridbod, P. Norouzi and F. Darviche, Int. J. Electrochem. Sci. 3 (2008) 1288.
52. M. R. Ganjali, F. Faridbod, P. Norouzi, and M. Adib, Sens. Actuator B 120 (2006) 119.
53. P. T. Kissinger and W. R. Heineman, Laboratory Techniques in Electroanalytical Chemistry, Marcel Dekker, New York, 1984.
54. L. Kristoffersen, A. Bugge, E. Lundanes and L. Slørdal, J. Chromatogr. B, 734 (1999) 229.
55. S. F. Y. Li, Capillary Electrophoresis, Principles Practice and Applications, Elsevier, Amsterdam, 1992.
56. R. M. Wightman and D. O. Wipf, in: A. J. Bard (Ed.), Electroanalytical Chemistry, vol. 15, Marcel Dekker, New York, 1989.
57. M. Paeschke, F. Dietrich, A. Ulig and R. Hintsche, Electroanalysis, 8 (1996) 891. 58. T. Dimitrakopoulos, P. W. Alexander and D. B. Hibbert, Electroanalysis, 8 (1996) 438.
59. R. Hintsche, M. Paeschke, U. Wollenberger, U. Schnakenberg, B. Wagner and T. Lisec, Biosens. Bioelectron. 9 (1994) 697.
60. V. Cosofret, M. Erdosy, T. A. Johnson, R. P. Buck, R. B. Ash and M. R. Neuman, Anal. Chem. 67 (1995) 1647.
61. A. S. Baranski, P. Norouzi and L. Nelsson, J. Proc. Electrochem. Soc. 96 (1996) 41. 62. CRC Handbook of Chemistry and Physics, 76th Edition, 1995.
63. P. Norouzi, M. R. Ganjali and P. Matloobi, Electrochem. Commun. 7 (2005) 33.
64. P. Norouzi, G. R. Nabi Bidhendi, M. R. Ganjali, A. Sepehri and M. Ghorbani, Microchim. Acta 152 (2005) 123.
65. M. R. Ganjali, P. Norouzi, M. Ghorbani and A. Sepehri, Talanta, 66 (2005) 1225.
66. P. Norouzi, M. R. Ganjali, M. Ghorbani and A. Sepehri, Sens. Actuators B, 110 (2005) 239. 67. P. Norouzi, M. R. Ganjali, T. Alizadeh and P. Daneshgar, Electroanalysis 18 (2006) 947.
68. J. Lipkowski and L. Stolberg, Adsorption of Molecules at Metal Electrodes, VCH, New York, 1992.
69. J. O. M. Bockris, B. E. Conway and E. Yeager, Comprehensive Treatise of Electrochemistry, Plenum, New York, London, 1980.
70. P. Norouzi, M. R. Ganjali, S. Shirvani-Arani and A. Mohammadi, J. Pharm. Sci. 96 (2007) 893. 71. P. Norouzi, S. Shirvani-Arani, P. Daneshgar and M. R. Ganjali, Biosens. Bioelectron. 22 (2007)
1068.
72. P. Norouzi, P. Daneshgar, M. R. Ganjali and A. A. Moosavi-Movahedi, J. Brazilian Chem. Soc. 18 (2007) 231.
73. P. Norouzi, M. R. Ganjali and P. Daneshgar, Anal. Lett. 40 (2007) 547. 74. P. Norouzi, M. R. Ganjali and L. Hajiaghababaei, Anal. Lett. 39 (2006) 1941. 75. P. Norouzi, M. R.Ganjali, S. Labbafi and A. Mohammadi, Anal. Lett. 40 (2007) 747. 76. P. Norouzi, M. R. Ganjali and P. Daneshgar, J. Pharm. Toxicol. Method, 55 (2007) 289. 77. S. P. Sinha, Complexes of Rare-Earth, 1st ed., Pergaman Oxford, London, 1966.
78. A. E. Martell and R. M. Smith, Critical StabilityConstants: Other Organic Ligands, Vol. 3, Plenum, New York, 1977, p.28.
79. H. P. Fuping, P. R. Haddad, P. E. Jackson and J. Carnevale, J. Chromatogr. 640 (1993) 187. 80. A. Mohammadi, I. Haririan, N. Rezanour, L. Ghiasi and R. B. Walker, J. Chromatogr. A, 1116
(2006) 153.
81. A. Mohammadi, I. Kanfer, V. Sewram and R. B. Walker, J. Chromatogr. B, 824 (2005) 148. 82. A. Mohammadi, N. Rezanour, M. Ansari Dogaheh, F. Ghorbani Bidkorbeh, M. Hashem and R. B.
Walker, J. Chromatogr. B, 846 (2007) 215.
84. J. C. Miller and J. N. Miller, Statistics for Analytical Chemistry, vol. 22, Ellis Horwood, Chichester, 1984, p. 82.
85. Z. Al-Kurdi, T. Al-Jallad, A. Badwanamd and A. M. Y. Jaber, Talanta 50 (1999) 1089.
86. International Conference on Harmonization (ICH) Topic Q2 B: Validation of Analytical Procedures: Methodology, The European Agency for the Evaluation of Medicinal Products, Geneva, 1996.
87. Y. V. Heyden, A. Nijhuis, J. Smeyers-Verbeke, B. G. M. Vandeginste and D. L. Massaret, J. Pharm. Biomed. Anal. 24 (2001) 723.