Int. J. Electrochem. Sci., 4 (2009) 1650 - 1671
International Journal of
ELECTROCHEMICAL
SCIENCE
www.electrochemsci.orgSeparation and Determination of Medium Lanthanides: A New
Experiment with Use of Ion-Exchange Separation and Fast
Fourier Transform Continuous Cyclic Voltammetry
Mohammad Reza Pourjavid,1 Parviz Norouzi,1,2,* Mohammad Reza Ganjali,1,2Ali Nemati,3 Hassan Ali Zamani,4Majid Javaheri3
1 Center of Excellence in Electrochemistry, Faculty of Chemistry, University of Tehran, Tehran, Iran
2 Medical Nanotechnology Research Centre, Tehran University of Medical Sciences, Tehran, P.O. Box, 14155-6451, Iran
3School of Chemistry, University College of Science, University of Tehran, Tehran, Iran 4 Department of Applied Chemistry, Quchan branch, Islamic Azad University, Quchan, Iran *E-mail: [email protected]
Received: 21 November 2009 / Accepted: 3 December 2009 / Published: 31 December 2009
Separation of medium lanthanides (Sm3+, Eu3+, Gd3+, Tb3+ and Dy3+) on Nucleosil 100-5-SA (an ion-exchange column) in the presence of α-hydroxyisobutyric acid (HIBA) as an elution agent was
investigated. Determinations were performed by Fast Fourier Transform Continuous Cyclic Voltammetry (FFT-CCV) in a flowing solution. It should be stressed that this technique is: simple, precise, accurate, time saving and economical. The influence of HIBA concentration and pH of the eluent was studied. The best performance obtained was at; pH 4.0, scan rate 30 V s-1, accumulation potential -300 mV, and accumulation time 0.3 s. The proposed method displays a linear dynamic range between 0.26-23 mg L-1 and a detection limit of 0.08 mg L-1. Precision, inter-day precision and accuracy of the assay have been presented too. A comparative evaluation of medium lanthanide distribution in sophisticated monazite and xenotime mineral solutions using both FFT-CCV and Inductively Coupled Plasma Atomic Emission Spectrometric (ICP-AES) techniques were carried out. In detail, the advantages this method illustrates in comparison with other reported methods are the following; no necessity for oxygen removal from test solution, a suitable detection limit and fast determination of any such compound in a wide variety of chromatographic methods. Potential waveform consisted of steps for cleaning, accumulation and potential ramp of the analyte, and it was continuously applied on an Au disk microelectrode (12.5 mm in radius).
Keywords: Medium lanthanides; α-hydroxyisobutyricacid; Flow injection; Continuous Cyclic
1. INTRODUCTION
Classification and separation of lanthanides is an extremely difficult task because of their: similarity to each other (equal charge and almost similar ionic radii) and presence of them at trace concentration levels in most geological materials [1]. A number of analytical techniques have been reported for the determination of lanthanides in various matrices [2]. Several methods have been reviewed on the utilization of chromatographic and electrophoresis techniques for lanthanide separation and determination [3-15]. These researches explained use of high performance liquid chromatography (HPLC), cation and/or anion exchange chromatography and capillary electrophoresis for separation of lanthanide ions. Detection of them can be found with use of: UV-Vis spectrometry, refractive index (RI) detectors, spectrofluorimetry, ICP-AES and diod array detectors.
As a result of the very similar characteristics of the group elements, the stability constants of metal ions with a particular ligand show only slight differences. Thus, in order to achieve good separation of lanthanides, it is necessary to choose a proper complexing agent. Molecules with structures that are flexible and have rigid coordination could decrease the stability constant of the ligand, but increase the lanthanide(III) ion size selectivity of the ligand due to varied coordination distances and different radii of the ions. Such compounds could provide improved materials for the separation of these ions [16].
Use of ion chromatography for lanthanide analysis is an attractive procedure. In this method, typically, stationary phases are low-capacity cation-exchange resins with aqueous solutions of complexing agents as mobile phases. The most useful eluents for separation of lanthanides are α
-hydroxyisobutyricacid (α -HIBA) [17,18], mandelic acid [19], oxalic acid [20], glycolic acid [21], and
Traditionally, lanthanides are detected by post-column spectrophotometric reaction with strongly absorbing chromophores such as PAR or Arsenazo-III [3,25]. Recently the separated lanthanides have been most commonly determined using ICP-AES and ICP-MS as an ion chromatography interface [26,27]. However, a serious problem in this case is a large amount of reagent is used as the mobile phase, and thus may cause spectral interferences duo to molecular bands such as CO, CN, OH or NH. Also, due to the high viscosity of concentrated salt solutions, they tend to influence the nebulization efficiency. In the case of ICP-MS, polyatomic ions cause major interferences.
Potentiometric sensors can offer an inexpensive and convenient analysis method of rare-earth ions in solution provided that acceptable sensitivity and selectivity are achieved. There are many reports about ion selective electrodes (ISEs) for lanthanide ions in last decade [28-35]. The aim of the present study is determination of samarium, europium, gadolinium, terbium and dysprosium by Fast Fourier Transform Continuous Cyclic Voltammetry (FFT-CCV). Detection of lanthanide ions with FFT-CCV is faster than other detection methods, especially UV-Vis spectrometry, because in these methods pre- or post- column derivatization is necessary which can be time consuming and expensive.
Applying the stripping voltammetric technique in flowing solutions allows movement of the analyte zone in an electrochemical flow cell, resulting in fast accumulation of the analyte and fast potential sweeping (which is not appropriate for large electrodes) [36]. In the case of irreversible systems, electrochemical measurements at solid electrodes are not suitable. This is because the easy deactivation (or poisoning) of the surfaces of the solid electrodes by products of the red/ox reactions of the desired species or impurities is present in the solution. However, most of the problems of such methods can be overcome by the application of ultra-microelectrodes (UMEs). The application of voltammetric techniques has been further stimulated by the advent of UMEs, e.g. their steady state currents, higher sensitivity due to increased mass transport, and their ability to be used in solutions with a very high resistance [37]. UMEs have been applied as sensors in various techniques like: Flow Injection Analysis (FIA) [38], cardiovascular monitoring and in the analysis of some organic compounds [39]. Another problem comes from the changes in the characteristics of the electrode surface during the potential scan. The electrode signal will have a large background current if the surface of the solid electrode is oxidized and reduced during voltammetric measurements (the response of the electrode will have a large background current), which is associated with high levels of noise due to the structural changes of the electrode surface. Currents like this can interfere with the electrode processes of interest and may adversely affect the detection limits of the methods used.
2. EXPERIMENTAL PART 2.1. Apparatus
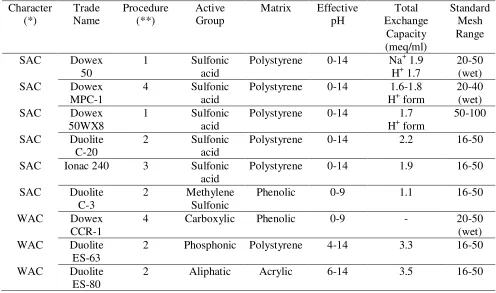
The model IC760 (Metrohm) was used during ion chromatographic experiments. Characterization of some useful cation exchangers was presented in Table 1 [41].However, in the case of separation of the medium lanthanides the ion-exchanger DOWEX 50WX8 was used. The operation was completed under the flow rate 1.5 mL min-1.
The equipment for flow injection analysis included a 10 roller peristaltic pump (UltrateckLabs Co., Iran) and a four-way injection valve (Supelco Rheodyne Model 5020) with a 50 µL sample
injection loop. Solutions were introduced in the sample loop by means of a plastic syringe. After opening the loop in the way of eluent flow, the sample passed over the working electrode. The electrochemical cell used in flow-injection analysis is shown in Fig. 1. The potentiostate applied a potential in the range of gold oxidation in acidic media and the potential waveform is shown in Fig 2. The volume of the cell was 100 µL. In all experiments described in this paper, the flow rate of eluent
solution was 3 mL min-1.
A Varian Liberty 150 AX Turbo model inductively coupled plasma-Atomic Emission spectroscopy (ICP-AES) was used for the determination of the lanthanide ion concentration.
[image:4.612.57.553.399.692.2]latinum.
Table 1. Characterization of cation-exchanger Character (*) Trade Name Procedure (**) Active Group
Matrix Effective pH Total Exchange Capacity (meq/ml) Standard Mesh Range
SAC Dowex
50
1 Sulfonic
acid
Polystyrene 0-14 Na+ 1.9 H+ 1.7
20-50 (wet)
SAC Dowex
MPC-1
4 Sulfonic
acid
Polystyrene 0-14 1.6-1.8 H+ form
20-40 (wet)
SAC Dowex
50WX8
1 Sulfonic
acid
Polystyrene 0-14 1.7
H+ form
50-100 SAC Duolite
C-20
2 Sulfonic
acid
Polystyrene 0-14 2.2 16-50
SAC Ionac 240 3 Sulfonic
acid
Polystyrene 0-14 1.9 16-50
SAC Duolite C-3
2 Methylene
Sulfonic
Phenolic 0-9 1.1 16-50
WAC Dowex
CCR-1
4 Carboxylic Phenolic 0-9 - 20-50
(wet) WAC Duolite
ES-63
2 Phosphonic Polystyrene 4-14 3.3 16-50
WAC Duolite ES-80
2 Aliphatic Acrylic 6-14 3.5 16-50
Solution
outlet
Teflon
tubing
Polypropylene
Reference
electrode
O-rings
Heat-shrink
tubing
Auxiliary electrode
Pt tubing)
Silicon
tubing
Au Ultramicroelectrode
[image:5.612.126.484.72.335.2]Solution Inlet
Figure 1. Diagram of the electrochemical cell
2.2. Reagents
For the experimental part of this research the oxide of lanthanides, hydrochloric acid and HIBA were of high purity available from Merck Chemicals and were used without further purification. HIBA 0.25 mol L-1 was buffered at pH 4.0 with sodium hydroxide. The reagents for the preparation of the eluent solution for flow injection analysis (0.05 mol L-1 H3PO4) and 1 mol L-1 NaOH (for the pH eluent adjustment), were obtained from Merck. All solutions were prepared in doubly distilled deionized water, filled with the background electrolyte solution and they were used without the removal of dissolved oxygen.
2.3. Background electrolyte (BGE) and standard solutions
The running buffer (BGE) was made by the addition of 8.7 mL of phosphoric acid (85% w/v) into a 1000 mL volumetric flask and diluted to a constant volume with distilled water. The pH was adjusted to 4.0 with sodium hydroxide and all solutions were freshly prepared and filtered using a Millipore filter (0.45 µm) each day.
2.4. Electrode preparation
Gold UMEs (12.5 µm in diameter) were prepared by sealing metal micro-wires (Good fellow
Metals Ltd., UK) into a soft glass capillary. The capillary was cut perpendicular to its length to expose the wire. Electrical contacts were made using silver epoxy (Johnson Matthey Ltd., UK). Before each experiment, the electrode surface was polished for 1 min using extra fine carborundum paper and then for 10 min with 0.3 µm alumina. Prior to being placed in the cell the electrode was washed with water.
In all measurements, an Ag(s)| AgCl(s)| KCl (aq, 1 mol L-1) reference electrode was used. The auxiliary electrode was made of a Pt wire, 1 cm length and 0.5 mm in diameter.
3. RESULTS AND DISCUSSION 3.1. Data acquisition and processing
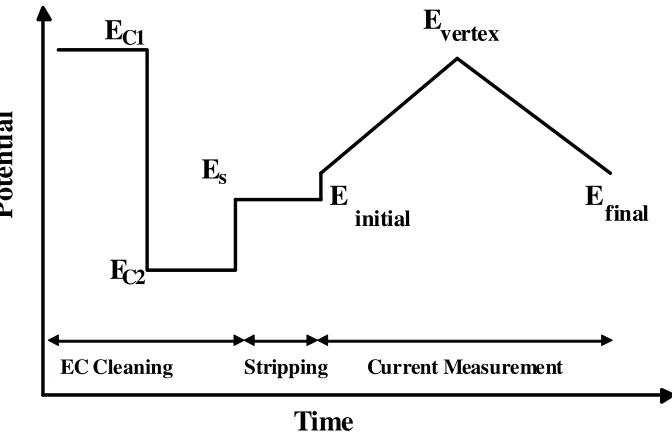
For the data acquisition a setup of a PC PIV Pentium 900 MHz microcomputer equipped with a data acquisition board (PCL-818HG, Advantech. Co.), and a custom made potentiostat was used. All data acquisition and data processing programs were developed in Delphi 6® program environment. In Fig. 2, the hypothetical applied waveform potential diagram during the cyclic voltammetric measurements is shown. The potential waveform consists of three parts; (a) potential steps, Ec1 and Ec2 (which are used for oxidation and reduction of the electrode surface, respectively), during which the electrochemical cleaning of the electrode surface takes place, (b) Ec, where the analyte accumulation takes place, and (c) the potential ramp where the current measurements occur.
E
C1E
C2E
initial
E
vertexE
final
P
o
te
n
ti
a
l
Time
E
s [image:6.612.141.477.457.676.2]EC Cleaning Stripping Current Measurement
During the scan some of the adsorbed analyte molecules are desorbed. Depending on the rate of those processes and the scan rate, the amount of the desorption analyte molecules (during the scan) can be changed. An important point to note is that: some of the adsorbed analyte molecules remain on the electrode surface inhibiting the red/ox process of the electrode surface. In this technique, ∆Q is calculated according with all current changes at the CVs [42-46].
One of the considerable aspects of this method is the application of a special digital filtration that is applied during the measurement. At first, an electrode CV was recorded and then by applying FFT on the collected data, the existing high frequency noises were determined. With the aid of this information the cutoff frequency of the analog filter was set at a certain value (where the noises were removed from the CV).
Since the crystal structure of a polycrystalline gold electrode is greatly affected by the condition of the applied potential waveform [37], different potential waveforms were examined in order to obtain a reproducible electrode surface (or a stable background signal). In fact, the application of cyclic voltammetry for the determination of electroactive compounds mainly faces low stability of the background signal due to the changes taking place on the surface crystal structure during the oxidation and reduction of the electrode in each potential cycle.
The electrochemical oxidation process on the gold surface starts with the hydroxyl ion electrosorption, which at more positive potentials results in the gold oxide formation undergoing structural rearrangement [47].
(b)
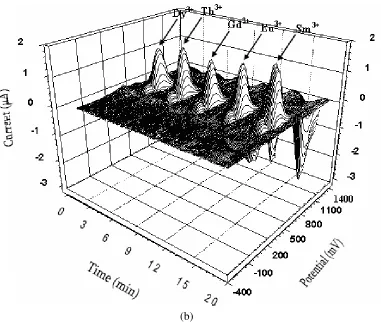
Figure 3. (a) Cyclic voltammogram at a 12.5 µm Au ultramicroelectrode recorded during a flow injection experiment. The eluent was 0.05 mol L-1 H3PO4, the flow rate was 100 µL s-1 and the sweep rate was 30 V s-1. Each scan was preceded by 100 ms (at 600 mV) and 100 ms (at -800 mV) conditioning, respectively. The accumulation time was 300 ms at -300 mV. The injected solution (50 µL) contained 1.0 mg L-1 Sm3+, Eu3+, Gd3+, Tb3+ and Dy3+ in 0.05 mol L-1 H3PO4. (b) Curves result from the subtraction of the CVs average (in the absence of the analytes) from the test of the CVs in (a).
[image:8.612.119.500.66.388.2]
Theoretically, the analyte response can be affected by the thermodynamic and kinetic parameters of adsorption, the mass transport rate and the electrochemical behavior of the adsorbed species. The free energy and the adsorption rate depend on the electrode potential, the electrode material and, to some extent, on the choice of the concentration and the type of the supporting electrolyte. By taking these points into consideration for the achievement of the detector maximum performance, the effect of the experimental parameters (such as pH of the supporting electrolyte, potential, accumulation time and potential scan rate) must be examined and optimized [47-52].
3.2. Experimental parameter optimization
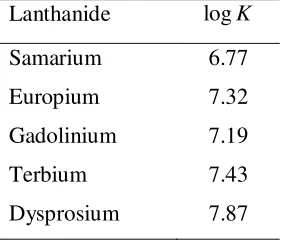
[image:9.612.236.377.466.588.2]Stability constants of the Ln-eluent complexes affect the elution pattern of lanthanides. If the stability constant of Ln-eluent complexes increases, its elution will be faster. The lesser the stability constant of complex, the slower the elution will be. Generally for all the eluents the stability constant increases from Sm to Dy and this explains the elution pattern in the order of decreasing atomic number from Dy to Sm in the cation-exchanger. The nature of the metal ion and eluent as well as the environmental factors such as solvent/medium, concentration, temperature and pressure can affect the formation of a complex between them. Hence, the stability constants for a given metal-eluent complex under different environmental conditions can be different. The log values of the stability constant for complexes of light lanthanides with HIBA vary from 6.77 for Sm(III) to 7.87 for Dy(III), and correspond to the reported literature [53] given in Table 2. These give a qualitative picture of the behavior during separation of lanthanides; however the exact performance can be different.
Table 2. Stability constants (logK) of medium lanthanides with α-HIBA used as complexing agent at
20°C
Lanthanide logK
Samarium 6.77 Europium 7.32 Gadolinium 7.19
Terbium 7.43
Dysprosium 7.87
3.3. Effect of pH of eluent on retention of lanthanide ions
0 0)
( t
t t
K R −
= (1)
In this equation t0 is retention time of the non-retained peak, and tR is retention time of the eluent retained. Increasing the pH from 3.0 to 6.0 caused a decrease in retention factor (K) for lanthanide ions. The elution efficiency of carboxylic acids changes with pH - this factor depends on the strength of carboxylic acid, which depends on its pH. The α-hydroxycarboxylic acids tested were weak
and undergo only partial ionization and show poor eluting strength at low pH [14]. With increasing pH, the elution efficiency increased due to greater ionization of the –COOH group. At higher pH, the retention factors for different lanthanides are quite close. So, pH 4.0 was selected as the optimum providing adequate resolution in a shorter time. Furthermore this pH was chosen because it is near to that of the maximum buffer capacity for HIBA.
0 1 2 3 4 5
2.5 3 3.5 4 4.5 5 5.5 6 6.5
pH
R
e
te
n
ti
o
n
F
a
c
to
r
(k
)
Sm Eu Gd Tb Dy
Figure 4. Effect of pH of mobile phase on retention of light lanthanides DOWEX 50WX8 under isocratic condition: 0.25 mol L-1 of HIBA. The injected solution (50 µL) contained 1.0 mg L-1 Sm3+, Eu3+, Gd3+, Tb3+ and Dy3+ in 0.05 mol L-1 H3PO4.
0 0.2 0.4 0.6 0.8 1 1.2
0.1 0.15 0.2 0.25 0.3 0.35 0.4
Concentration of HIBA (mol L-1)
R
e
te
n
ti
o
n
F
a
c
to
r
(k
)
Sm Eu Gd Tb
[image:10.612.164.414.272.429.2]Dy
[image:10.612.161.409.499.663.2]
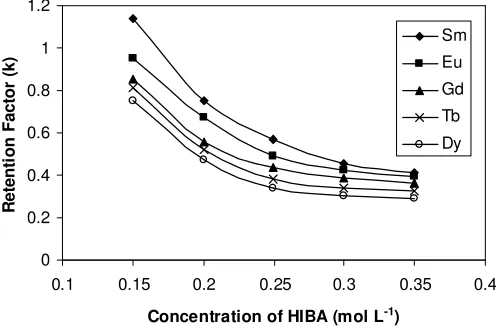
3.4. Effect of concentration of eluent on retention of lanthanide ions
The influence of the concentration of HIBA on retention of medium lanthanides is shown in Fig. 5. In high concentrations of eluent elution of lanthanides is faster. The effect of concentration of HIBA was studied at pH 4.0. Under this condition HIBA is ~ 63% ionized (pKa =3.77) [54]. With the increase in concentration of α-HIBA the concentration of α-hydroxyisobutyrate ions increases in
the mobile phase and results in faster elution of lanthanides on the column.
0 50 100 150 200 250
0 20 40 60 80 100 120
Scan Rate (V s-1)
S
ig
n
a
l/
N
o
is
e Sm
Eu
Gd
Tb
Dy
(a)
0 50 100 150 200 250
0 1 2 3 4 5 6
Flow Rate (mL min-1)
S
ig
n
a
l/
N
o
is
e Sm
Eu
Gd
Tb
Dy
(b)
[image:11.612.144.472.196.635.2]
0 50 100 150 200 250
-1000 -800 -600 -400 -200 0 200 400 600 800
Accumulation Potential (mV)
S
ig
n
a
l/
N
o
is
e Sm
Eu
Gd
Tb
Dy
(a)
0 50 100 150 200 250 300
0 0.2 0.4 0.6 0.8 1 1.2
Accumulation Time (s)
S
ig
n
a
l/
N
o
is
e Sm
Eu Gd
Tb
Dy
[image:12.612.142.474.74.521.2](b)
Figure 7. (a) The effect of the accumulation potential and (b) the effect of the accumulation time on the electrode response to injections of 1.0 mg L-1 Sm3+, Eu3+, Gd3+, Tb3+ and Dy3+ in 0.05 mol L-1 H3PO4.
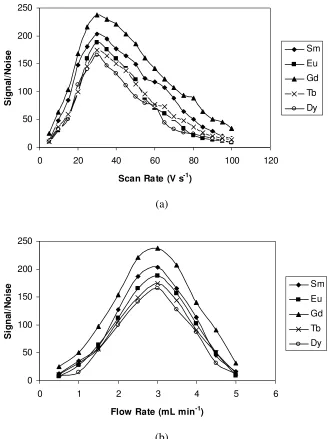
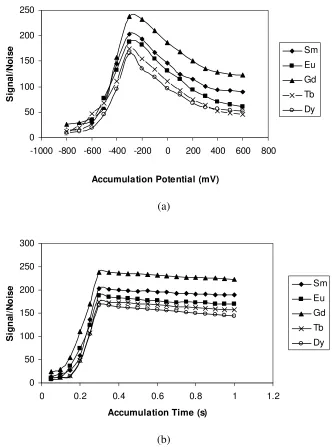
3.5. Influence of sweep rate, accumulation potential and accumulation time
different aspects: (a) speed in data acquisition, (b) kinetic factors of lanthanide ions adsorption and, (c) eluent flow rate which controls the time window of the solution zone in the detector. The main reason for application of high scan rates is prevention from desorption of the adsorbed lanthanide ions during the potential scanning (because under this condition, the inhibition outcome of the adsorbed lanthanide ions on the oxidation process can take place).
It is a fact that the employment of high scan rates is required for the use of this detection method in conjunction with fast separation techniques, such as capillary electrophoresis. From this point of view it is necessary to check how the method sensitivity is affected by the sweep rate. Therefore, high sweep rates must be employed to detect the amount of adsorbed analyte on the electrode surface so that the potential scanning step is short in comparison with the accumulation period. An important point to be taken into consideration is the time when the lanthanide ion accumulation occurs at a potential that is greater or smaller than Ei. However, the sensitivity of the
detection system mainly depends on the potential sweep rate mostly because of the adsorption kinetic factors and the instrumental limitations. Notably, any changes in the parameters related to the adsorption process affecting the applied potential, the time and the potential of accumulation severely influences the sensitivity of the measurement. For that reason the influence of the accumulation potential and time on the response of the method for the injection of a solution of (1.0 mg L-1) Sm3+, Eu3+, Gd3+, Tb3+ and Dy3+ in 0.05 mol L-1 H3PO4 was studied. Figure 7 shows the detector response over the accumulation potential ranges from −800 to 600 mV and the accumulation time range from 0.05 to 1.0 s. Figure 7a and 7b derives the conclusion that the optimum conditions to be chosen are accumulation potential of -300 mV and accumulation time of 300 ms, on the grounds that the electrode surface becomes lanthanide ions saturated within a (1300 ms) time window.
On the electrode the lanthanide ions accumulation takes place during the accumulation step (assuming that an appropriate potential is selected). The difference in the saturation time of the various compounds can be related to the existing differences in their kinetics of the electron transfer and mass transport. As mentioned above, the surface of the gold ultra microelectrode is small and in a short time the electrode surface can be saturated.
3.6. Validation
The method was validated in terms of: linearity, limit of quantitation (LOQ), limit of detection (LOD), precision, accuracy, ruggedness/robustness, recovery and selectivity.
30
50
70
90
110
0
5
10
15
20
25
30
35
40
C (mg L-1)
S
ig
n
a
l/
N
o
is
e
y = 2.0081x + 38.867
R2 = 0.9983
0 10 20 30 40 50 60 70 80 90 100
0 5 10 15 20 25
C (mg L-1)
S
ig
n
a
l/
N
o
is
e
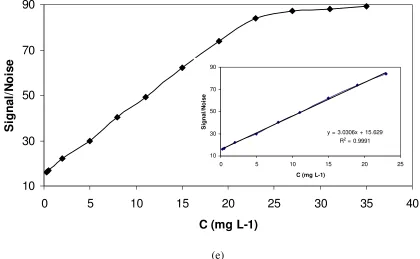
8 depicts the calibration graph that resulted from the monitoring of these lanthanide ions in a 0.05 mol L-1 H3PO4.
(a)
(b)
140
160
180
200
220
240
0
5
10
15
20
25
30
35
40
C (mg L-1)
S
ig
n
a
l/
N
o
is
e
y = 3.3942x + 151.58 R2 = 0.9995
140 160 180 200 220 240
0 5 10 15 20 25 C (mg L-1)
S
ig
n
a
l/
N
o
is
230 250 270 290 310 330 350
0 5 10 15 20 25 30 35 40
C (mg L-1)
S
ig
n
a
l/
N
o
is
e
y = 3.7313x + 243.72
R2 = 0.9987
240 260 280 300 320 340
0 5 10 15 20 25
C (mg L-1)
S
ig
n
a
l/
N
o
is
e
60
75
90
105
120
135
150
0
5
10
15
20
25
30
35
40
C (mg L-1)
S
ig
n
a
l/
N
o
is
e
y = 3.0985x + 66.052 R2 = 0.9994
60 70 80 90 100 110 120 130 140
0 5 10 15 20 25
C (mg L-1)
S
ig
n
a
l/
N
o
is
e
(c)
10 30 50 70 90
0 5 10 15 20 25 30 35 40
C (mg L-1)
S
ig
n
a
l/
N
o
is
e
y = 3.0306x + 15.629 R2 = 0.9991
10 30 50 70 90
0 5 10 15 20 25
C (mg L-1)
S
ig
n
a
l/
N
o
is
e
[image:16.612.88.508.90.349.2](e)
Figure 8. Calibration curves obtained for (a) Sm3+, (b) Eu3+, (c) Gd3+, (d) Tb3+, (e) Dy3+ ions on the Au electrode in 0.05 mol L-1 H3PO4 under isocratic condition: 0.25 mol L-1 of HIBA, Scan rate: 30 V s-1, Flow rate: 3 mL min-1.
Concerning the LOD value, it was measured as the lowest analyte amount that may be detected to produce a response that is significantly different from that of a blank one. The limit of detection was approved by calculations based on the standard deviation of the response (δ) and the slope (S) of the calibration curve at the levels approaching the limits according to the equation LOD=3.3 (δ/S) [55]. The LOD for Sm3+, Eu3+, Gd3+, Tb3+ and Dy3+ was found to be 0.08 mg L-1. On the other hand, the LOQ was measured as the lowest analyte amount that can be reproducibly quantified above the baseline noise for which triplicate injections resulted in an R.S.D. ≤1.3 %. A practical LOQ giving
good precision and acceptable accuracy was equivalent to 0.26 mg L-1.
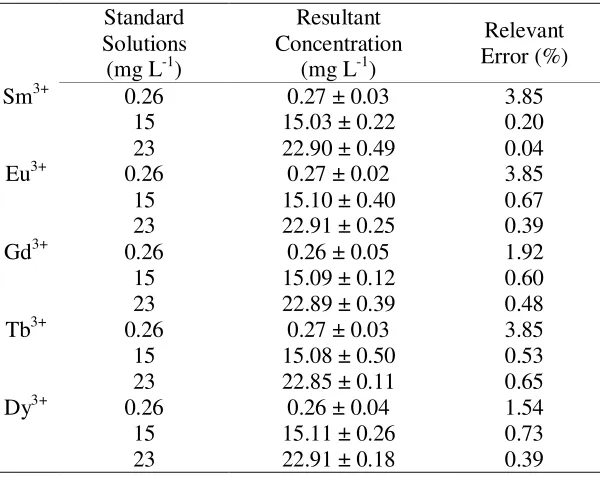
Table 3. Precision and inter-day precision of the assay
Table 4. Accuracy of the assay
The accuracy of the assay was determined by the interpolation of replicate (n=6) peak areas of
three accuracy standards (0.26, 15 and 23 mg L-1) from a calibration curve prepared as previously Inter-day Precision
Precision
RSD (%) Mean Concentration
(mg L-1) RSD
(%) Mean
Concentration (mg L-1) Standard
Solutions(mg L-1)
0.04 0.27 0.03 0.26 0.26 Sm3+ 0.04 15.03 0.03 15.02 15 0.02 22.87 0.01 22.88 23 0.05 0.27 0.04 0.26 0.26 Eu3+ 0.03 15.04 0.03 15.03 15 0.03 22.87 0.02 22.87 23 0.04 0.28 0.03 0.26 0.26 Gd3+ 0.04 15.05 0.02 15.04 15 0.02 22.87 0.01 22.88 23 0.04 0.27 0.04 0.27 0.26 Tb3+ 0.03 15.04 0.02 15.03 15 0.02 22.06 0.02 22.97 23 0.05 0.28 0.04 0.27 0.26 Dy3+ 0.03 15.05 0.02 15.05 15 0.02 22.05 0.01 22.05 23 Relevant Error (%) Resultant Concentration (mg L-1) Standard
Solutions (mg L-1)
3.85 0.27 ± 0.03
0.26 Sm3+
0.20 15.03 ± 0.22
15
0.04 22.90 ± 0.49
23
3.85 0.27 ± 0.02
0.26 Eu3+
0.67 15.10 ± 0.40
15
0.39 22.91 ± 0.25
23
1.92 0.26 ± 0.05
0.26 Gd3+
0.60 15.09 ± 0.12
15
0.48 22.89 ± 0.39
23
3.85 0.27 ± 0.03
0.26 Tb3+
0.53 15.08 ± 0.50
15
0.65 22.85 ± 0.11
23
1.54 0.26 ± 0.04
0.26 Dy3+
0.73 15.11 ± 0.26
15
0.39 22.91 ± 0.18
[image:17.612.160.460.427.666.2][image:18.612.133.485.148.334.2]
described. In each case the relevant error percentage and the accuracy were calculated. Table 4 shows the resultant concentrations with their relevant error percentage.
Table 5. Influence of the changes in the experimental conditions on the performance of the FIA system
Table 6. Comparison between the determination of medium lanthanide ions by FFT-CCV and ICP-AES
The ruggedness of the method was calculated by the comparison of the intra- and inter-day assay results for lanthanide ions undertaken by two analysts. The %R.S.D. values in the cited formulations performed in the same laboratory did not exceed 3.8 %, thus indicating the ruggedness of the method. Also, the robustness of the method was investigated under a variety of conditions such as small changes in the: pH of the eluent, flow rate, buffer composition and laboratory temperature. As seen in Table 5, the medium lanthanide ions recovery percentages were good under most conditions, not demonstrating any significant change when the critical parameters were modified.
Monazite [(Ln,Th)PO4] and Xenotime [(Y,Ln)PO4] are two important lanthanide ores and have large amounts of these elements. The first one is richer in earlier lanthanides and the second one is
%Recovery Dy3+ Tb3+ Gd3+ Eu3+ Sm3+ Modification Parameter 98.7 101.4 100.6 100.3 98.8 3.9 pH 100.0 100.9 1008 101.5 100.0 4.0 99.4 100.4 100.4 99.6 100.1 4.1 99.3 100.6 100.4 98.7 100.2 2.6 Flow Rate 100.8 101.0 101.1 99.8 101.2 2.8 (mL/min) 98.7 100.6 99.2 100.1 100.0 3.0 100.6 99.7 100.4 100.4 101.1 0.25 Buffer 100.3 100.1 99.9 100.8 101.1 0.24 Composition 100.3 98.7 100.0 100.2 99.8 0.23 (M) 101.2 99.2 100.6 98.6 100.3 20 Lab. 100.9 99.8 100.7 100.1 100.6 25 Temprature 100.4 99.8 100.6 99.7 100.1 30 (ºC) E le m en t Real Amount of Monazite Solution (mg L-1)
Found Amount of Monazite Solution
(mg L-1)
Real Amount of Xenotime Solution (mg L-1)
Found Amount of Xenotime Solution
(mg L-1)
FFT-CCV ICP-AES FFT-CCV ICP-AES
Sm 3.00 3.44±0.22 3.39±0.22 19.00 20.33±0.14 20.57±0.35
Eu 1.00 1.18±0.12 1.18±0.12 2.00 1.91±0.55 1.94±0.01
Gd 15.00 15.95±0.93 15.95±0.93 4.00 4.39±0.27 4.51±0.12
Tb 0.50 0.52±0.05 0.52±0.05 10.00 10.88±0.91 10.84±0.17
[image:18.612.75.538.412.550.2]
richer in later lanthanides. Ion-exchange separation is not of real commercial importance for large-scale production, but historically it was the method by which fast high-purity separation of lanthanides first became feasible [56]. So, two solutions were prepared with the same ingredients of monazite and xenotime and diluted 1000 times to provide sample solutions (due to the amounts of samarium in monazite and gadolinium, and terbium in xenotime being so large, they were inevitably diluted 10 times more). The results obtained for medium lanthanide ions in monazite and xenotime samples under investigation are given in Table 6. For these determinations five replicate analyses were performed for each sample. The standard deviation of the whole procedure is also given in Table 6. From the results it can be seen that within the precision of both measuring procedures the concentration values of these ions determined by FFT-CCV and ICP-AES are in fair agreement with each other.
3.7. Comparison of the sensitivity of the proposed method and other previously reported methods
[image:19.612.94.514.369.686.2]Table 7 compares the detection limit of the proposed method with UV-Vis spectrometry, spectrofluorimetry, RI, ICP-AES and potentiometric methods. The sensitivity of FFT-CCV method is better than most of them.
Table 7. Comparison between the detection limits of the proposed method with the other reported methods
Separation Method Detection Method Detection Limit
(mg L-1) Ref.
SPE-RP-Ion Pair-HPLC UV, RI 10 3
IEC Vis ~ 10 4
IEC Vis 5 5
HPCIC Vis 4 6
IEC Spectrofluorimetry > 50 7
IEC Spectrofluorimetry > 50 8
CE UV 0.24 – 0.47 9
CE UV 0.53 – 0.96 10
IEC RP-HPLC
ICP-AES UV-Vis
0.07 – 0.25 > 11
11 12
RP-HPLC Diod Array Detector > 9 13
CE UV 4.8 14
IEC Vis 25 15
- Potentiometry 0.47 28
- Potentiometry 0.09 29
- Potentiometry 0.10 30
- Potentiometry 0.97 31
- Potentiometry 0.75 33
- Potentiometry 0.09 34
- Potentiometry 0.09 35
- Potentiometry 0.13 36
4. CONCLUSIONS
1. In this work the cation exchange separation and determination of Samarium, Europium, Gadolinium, Terbium and Dysprosium ions was achieved for the first time by coupling of ion exchange separation and Fast Fourier Transform Continuous Cyclic Voltammetry (FFT-CCV) in a flowing solution, thereby enabling direct detection.
2. α-hydroxyisobutyricacid (HIBA) has found to be a successful eluent. Lanthanide ions form
complexes with HIBA, which lower the affinity of the lanthanide for the cation exchange resin. Lanthanide ions such as Dy3+ form a stable complex with HIBA, spend more time in the eluent and elute first. Lanthanide ions such as Sm3+ form a weaker complex with HIBA, spend relatively less time in eluent and elute later (the rate of transport being in the order Dy3+>Tb3+>Gd3+>Eu3+>Sm3+).
3. From the results described in this study it can be concluded that good separation of these ions can be achieved using isocratic elution with 0.25 M of HIBA at pH 4.0. The best values for accumulation potential and accumulation time were -300 mV and 0.3 s respectively and 30 V s-1 scan rate was necessary. The agreement between the results obtained by FFT-CCV and ICP-AES indicate the proposed method can lead to good accuracy.
ACKNOWLEDGEMENTS
This paper was supported by research council of university of Tehran.
References
1. M. R. Buchmeiser, Rev. Anal. Chem., 20 (2001) 161.
2. T. Prasada Rao, V. M. Biju, Crit. Rev. Anal. Chem.,30 (2000) 179.
3. M .R. Buchmeiser, G. Seeber and R. Tessadri, Anal. Chem., 72 (2000) 2595.
4. C. H. Knight, R. M. Cassidy, B. M. Recoskie and L. W. Green, Anal. Chem., 56 (1984) 474.
5. Y. Inoue, H. Kumagai and Y. Shimimura, Anal. Chem., 68 (1996) 1517. 6. P .N. Nesterenko and P. N. Jones, J. Chromatogr. A, 804 (1998) 223.
7. Ş. Kutun and A. Akseli, J. Chromatogr. A, 847 (1999) 261.
8. Ş. Kutun and A. Akseli, J. Chromatogr. A, 874 (2000) 311.
9. N. Öztekin and F. B. Erim, J. Chromatogr. A, 895 (2000) 263.
10.N. Öztekin and F. B. Erim, J. Chromatogr. A, 924 (2001) 541.
11.E. H. Borai, M. A. Eid and H. F. Aly, Anal. Bioanal. Chem., 372 (2002) 537. 12.E. Santoyo and S. P. Verma, J. Chromatogr. A, 997 (2003) 171.
13.N. M. Raut, P. G. Jaison and S. K. Aggarwal, J. Chromatogr. A, 1052 (2004) 131.
14.E. Santoyo, R. García, K. A. Galicia-Alanis, S. P. Verma, A. Aparicio and A. Santoyo-Castelazo,
J. Chromatogr. A, 1149 (2007) 12.
15.A. Mazzucotelli, A. Dadone, R. Frache and F. Baffi, Chromatographia, 15 (1982) 697. 16.P. Henderson, Rare Earth Element Geochemistry, Elsevier, Amsterdam, 1984.
17.R. M. Cassidy, S. Elchuk, N. L. Elliot, L. W. Green, C. H. Knight and B. M. Recoskie, Anal.
Chem., 58 (1986) 1181.
18.D. J. Barkley, M. Blanchette, R. M. Cassidy and S. Elchuk, Anal. Chem., 58 (1986) 2222.
20.E. A. Jones, H. S. Bezuidenhout and J. F. Van Staden, J. Chromatogr., 537 (1991) 277.
21.R. Kuroda, T. Wada, G. Kishimoto and K. Oguma, Chromatographia, 32 (1991) 65. 22.L. E. Vera-Avila and E. Camacho, J. Liq. Chromatogr., 15 (1992) 835.
23.R. G. Fernández and J. I. G. Alonso, J. Chromatogr. A, 1180 (2008) 59. 24.C. Nuryono, G. Huber and K. Kleboth, Chromatographia, 48(1998) 407.
25.S .P. Verma, Lanthan. Actin. Res., 3 (1991) 237.
26.K. Kawabata, Y. Kishi, O. Kawaguchi, Y. Watanabe and Y. Inoue, Anal. Chem., 63 (1991) 2137. 27.B. A. Haley and G. P. Klinkhammer, Mar. Chem., 82 (2003) 197.
28.F. Faridbod, M. R. Ganjali, R. Dinarvand, P. Norouzi and S. Riahi, Sensors, 8 (2008) 1645. 29.M. R. Ganjali, M. R. Pourjavid, M. Rezapour and S. Haghgoo, Sens. Actuators B,89(2003) 21. 30.M. R. Ganjali, A. Ghesmi, M. Hosseini, M. R. Pourjavid, M. Rezapour, M. Shamsipur and M.
Salavati-Niasari, Sens. Actuators B,105(2005) 334.
31.M. R. Ganjali, J. Ravanshad, M. Hosseini, M. Salavati-Niasari, M. R. Pourjavid and M. R. Baezzat,
Electroanalysis,16 (2004) 1771.
32.M. R. Ganjali, P. Norouzi, A. Daftari, F. Faridbod and M.Salavati-Niasari, Sens. Actuators B,120
(2007) 673.
33.H. A. Zamani, G. Rajabzadeh, M. R. Ganjali and P. Norouzi, Anal. Chim. Acta,598 (2007) 51. 34.M. R. Ganjali, Z. Memari, F. Faridbod, R. Dinarvand and P. Norouzi, Electroanalysis, 20 (2008)
2663.
35.H. A. Zamani, M. R. Ganjali, P. Norouzi, A. Tadjarodi and E. Shahsavani, Mater. Sci. Eng. C, 28
(2008) 1489.
36.P. T. Kissinger and W. R. Heineman, Laboratory Techniques in Electroanalytical Chemistry, Marcel Dekker, New York, 1984.
37.R. M. Wightman and D. O. Wipf, in: A. J. Bard (Ed.), Electroanalytical Chemistry, vol. 15, Marcel Dekker, New York, 1989.
38.M. Paeschke, F. Dietrich, A. Ulig and R. Hintsche, Electroanalysis, 8 (1996) 891.
39.G. Sreenivas, S. S. Ang, I. Fritsch, W. D. Brown, G. A. Gerhardt and D. Woodward, J. Anal.
Chem., 68 (1996) 1858.
40.A. S. Baranski, P. Norouzi and L. Nelsson, J. Proc. Electrochem. Soc., 96 (1996) 41.
41.CRC Handbook of Chemistry and Physics, 76th Edition, 1995.
42.P. Norouzi, M. R. Ganjali and P. Matloobi, Electrochem. Commun.,7 (2005) 33.
43.P. Norouzi, G. R. Nabi Bidhendi, M. R. Ganjali, A. Sepehri and M. Ghorbani, Microchim. Acta, 152 (2005) 123.
44.M. R. Ganjali, P. Norouzi, M. Ghorbani and A. Sepehri, Talanta,66 (2005) 1225.
45.P. Norouzi, M. Qomi, A. Nemati, M. R. Ganjali, Int. J. Electrochem. Sci., 4 (2009) 1248-1261. 46.P. Norouzi, A. Nemati, N. Tajarod and M. R. Ganjali, Int. J. Electrochem. Sci., 4 (2009)
1109-1115.
47.J. Lipkowski and L. Stolberg, Adsorption of Molecules at Metal Electrodes, VCH, New York,
1992.
48.J. O. M. Bockris, B. E. Conway and E. Yeager, Comprehensive Treatise of Electrochemistry,
Plenum, New York, London, 1980.
49.P. Norouzi, S. Shirvani-Arani, P. Daneshgar and M. R. Ganjali, Biosens. Bioelectron., 22 (2007)
1068.
50.P. Norouzi, M. R. Ganjali and P. Daneshgar, Anal. Lett., 40 (2007) 547.
51.P. Norouzi, M. R. Ganjali, S. Labbafi and A. Mohammadi, Anal. Lett.,40 (2007) 747.
52.P. Norouzi, M. R. Ganjali and P. Daneshgar, J. Pharm. Toxicol. Method,55 (2007) 289.
53.A. E. Martell and R. M. Smith, Critical StabilityConstants: Other Organic Ligands, Vol. 3,
Plenum, New York, 1977, p.28.
55.International Conference on Harmonization (ICH) Topic Q2 B: Validation of Analytical
Procedures: Methodology, The European Agency for the Evaluation of Medicinal Products,
Geneva, 1996.
56.Lanthanide and Actinide Chemistry, Simon Cotton, John Wieley & Sons, Ltd, 2006.