Int. J. Electrochem. Sci., 6 (2011) 4048 - 4058
International Journal of
ELECTROCHEMICAL
SCIENCE
www.electrochemsci.org
Study on Adsorption and Complexation Behavior of Thiourea
on Copper Surface
Jie Zhao1,* , Guofeng Cui2
1
School of Mechanical & Automotive Engineering, South China University of Technology, Guangzhou 510641, China
2
Key Laboratory of Low-carbon Chemistry & Energy Conservation of Guangdong Province, School of Chemistry and Chemical Engineering, Sun-Yat Sen University, GuangZhou, 510275, P.R. China
*
E-mail: [email protected]
Received: 14 April 2011 / Accepted: 25 July 2011 / Published: 1 September 2011
The reaction behaviors of various concentrations of thiourea (TU) on copper surface in 0.5 mol/L H2SO4 solution were investigated by electrochemical methods and single crystallogram. Weak
interaction occurs at low concentration of TU. TU is first oxidized to formamidine disulphide (FDS), which adsorbs on copper surface and produces an obvious inhibition of copper electrodissolution. At high concentration (≥0.1 mol/L), TU is bonded to copper via its sulphur atom to form Cu2(NH2CSNH2)62+ complex ion. Moreover, the enhancement of TU concentration can accelerate the
formation of metal complex and lead to final irreversible complex process, which promotes corrosion reaction to proceed smoothly.
Keywords: Copper, thiourea, corrosion, complexation, cyclic voltammetry, single crystallogram
1. INTRODUCTION
Until now, the reactivity of TU on copper surface is the subject of a number of electrochemical, spectroscopic and radiochemical studies [11-14]. Alodan [15] and Bolzán [16] proposed by analysis of EIS and EDAX data that the main reactions depend on the applied potential and initial thiourea concentration. The oxidation of TU to FDS follows intermediate kinetics governed by TU diffusion from solution towards copper surface [17].
Despite a very large number of investigations, the concentration of TU discussed is comparatively low (<10 mmol/L), the effect of higher TU concentration on copper is still not well understand. Especially, the adsorption and complexation processes of TU on copper are obscure. And the structural information of the metal complex was not obtained. Therefore, for an in-depth discussion of the reaction behaviors of TU on copper surface becomes crucial.
In this paper, the adsorption and complexation behaviors of TU on copper in 0.5 mol/L H2SO4
solutions were investigated by cyclic voltammetry, Tafel plots and single crystallogram. The reason of TU accelerating corrosion reaction was analysized as well. Meanwhile, the reaction path of TU on copper surface was depicted. It is helpful to reveal the mechanism of TU corrosion, and select excellent additive of copper chemical polishing and electropolishing
2. EXPERIMENTAL SECTION
2.1. Electrochemical experiment measurement
The electrochemical experiments were performed on Gamry electrochemical workstation in a conventional three-compartment Pyrex cell. A Pt foil was used as the auxiliary electrode and a saturated Hg2SO4 electrode (MSE) was used as a reference. All electrode potentials were referred to
MSE if not stated especially. The Luggin capillary was placed close to the working electrode to minimize the solution resistance. Working electrodes were copper sheets (defined area of 2.0 cm2 exposed to the electrolyte). The working electrodes were firstly degreased with 10% NaOH and acetone. Subsequently, they were deoxidized and rinsed with 5% H2SO4 and deionized water
respectively. The working solutions were freshly prepared by varing TU concentration range from 0.0 to 1.0 mol/L using 0.5 mol/L sulphuric acid as support electrolyte. All reagents used were of analytical grade. Solutions were prepared using Mill-Q deionized water with resistance of 17 MΩ or higher. All experiments were carried at 25oC.
2.2. Crystal structure measurement
After electrochemical measurement, the electrolyte nearby working electrode was sucked by an injector, and the colorless crystals were obtained after the solvent evaporated.
3.29≤θ≤27.46o with Rint = 0.0263, of which 5215 observed reflections with I > 2σ(I) were used in the
succeeding structure calculations. Correction for Lp factors and empirical absorption correction were applied to intensity data. The structure was solved by direct methods and difference Fourier syntheses. All calculations were carried out with SHELX 97 program [18].
The crystal belongs to orthorhombic system, space group is Pbca, with the unit cell parameters a = 1.9230(4) nm, b = 1.2323(3) nm, c = 2.1478(4) nm. V = 5.0896(18) nm3, Z = 8, Mr = 697.89, Dc =
1.822 g/cm3, μ = 2.290 mm-1, F(000) = 2848, R = 0.0219, wR = 0.0535 (w = 1/ [σ 2 (Fo 2) + (0.0327P)2 + 2.4450P], where P = (Fo2+ 2Fc2)/3), S = 1.029, (∆/σ)max = 0.001, (∆ρ)max = 0.348 and (∆ρ)min = -
0.350 e/Å3
.
3. RESUITS AND DISCUSSIONS
3.1. Effect of various concentrations thiourea on (Cu /Cu )
The effects of TU on
Cu /Cu
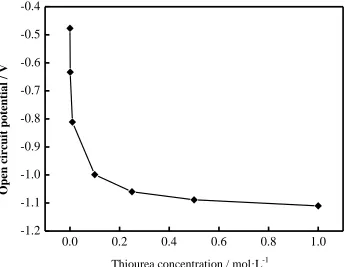
were investigated in Fig.1. Firstly, it is clear that Cu /Cu decreases noticeably with the increasing of TU. Initially Cu /Cu is -0.48V, and it is decreased to -0.81V after 0.01mol/L TU added, even to -1.0V for 0.1mol/L TU. With the further improvement of TU concentration, the potential of Cu+/Cu is more negative. Afterwards the Cu /Cu reached a steady value of -1.06–-1.11V. It shows that the corrosion of copper is more prone to happen with the increasing of TU. Therefore, the high concentration of TU can promote corrosion reaction to proceed smoothly.
0.0 0.2 0.4 0.6 0.8 1.0
[image:3.596.113.458.466.733.2]-1.2 -1.1 -1.0 -0.9 -0.8 -0.7 -0.6 -0.5 -0.4
Figure 1. Effect of TU concentration on
Cu /Cu
Thiourea concentration / mol·L-1
Op
en
c
irc
u
it pote
n
tial
/
V
3.2. The reaction process of thiourea on copper surface by cyclic voltammetry
In order to elucidate the reaction process of TU on copper surface, the cyclic voltammograms were explored in 0.5 mol/L H2SO4 containing various concentrations of TU. This enables us to reveal
the mechanism that might be obscured by corrosion process.
-1.05 -0.90 -0.75 -0.60 -0.45 -0.30 -0.15
[image:4.596.142.429.177.395.2]-0.05 0.00 0.05 0.10 0.15 0.20 0.25
Figure 2. Voltammogram for copper in aqueous 0.5 mol/L H2SO4. v= 0.01V s-1, 298K.
-1.4 -1.2 -1.0 -0.8 -0.6 -0.4 -0.2
-0.03 -0.02 -0.01 0.00 0.01 0.02 0.03
IIa
Ic Ic
0.001 mol/L 0.01 mol/L
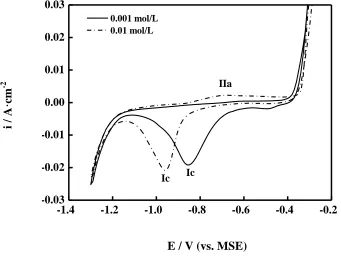
Figure 3. Cyclic voltammogram of copper in 0.5 mol/L H2SO4 + x mol/L TU, (a) x = 0.001, (b) x =
0.01. v = 0.01V s-1, 298K.
E / V (vs. MSE)
i
/
A
·cm
-2
E / V (vs. MSE)
i
/
A
·cm
[image:4.596.108.449.462.721.2]
-1.4 -1.2 -1.0 -0.8 -0.6 -0.4 -0.2
-0.06 -0.03 0.00 0.03 0.06 0.09
IIc
Ic
IIa Ia
0.1 mol/L 0.25 mol/L
Figure 4. Cyclic voltammogram of copper in 0.5 mol/L H2SO4 +x mol/L TU, (c) x = 0.1, (d) x = 0.25.
v = 0.01V s-1, 298K.
-1.4 -1.2 -1.0 -0.8 -0.6 -0.4 -0.2
-0.06 0.00 0.06 0.12 0.18 0.24 0.30
IIa IIa
[image:5.596.142.430.72.290.2]0.5 mol/L 1 mol/L
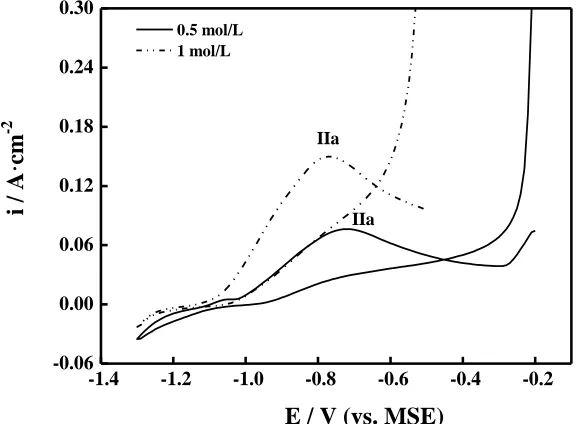
Figure 5. Cyclic voltammogram of copper in 0.5 mol/L H2SO4 +x mol/L TU, (e) x = 0.5, (f) x =1. v=
0.01V s-1, 298K.
A cyclic voltammogram of copper in aqueous 0.5 mol/L H2SO4 at a scan rate of 0.01 V/s is
given in Fig.2. An increasing anodic current starts from 0.48 V in the positive direction due to Cu (0) = Cu (II) + 2e. The subsequent reverse potential scan shows a negative peak at -0.49 V attribution to the deposition of Cu (II) ions formed in the preceding scan.
There are significant changes in cyclic voltammetry with the addition of TU as shown in Fig.3. For CTU = 0.001 mol/L, the positive potential scan exhibits an anodic current from -0.8 V upwards
related to the oxidation of TU to FDS. There is a cathodic peak (Ic) due to the reduction of FDS to TU E / V (vs. MSE)
i
/
A
·cm
-2
E / V (vs. MSE)
i
/
A
·cm
[image:5.596.141.430.360.572.2]
at -0.85V, and a hump at -0.49 V to the deposition of Cu (II) ions in the reverse scan. When the concentration of TU is 0.01 mol/L, peak Ic is shifted to more negative potential.
As seen from the comparison of Figs.2 and 3 at -0.49 V, the presence of TU produces a remarkable inhibition of copper dissolution. It is as the result that TU and FDS adsorb on the copper surface.
As increasing the concentration of TU, several new anodic and cathodic peaks appear in Fig.4. For 0.1 mol/L TU, the positive potential scan shows two peaks at -0.71 V (IIa) and -0.89 V (Ia) respectively. The reverse scan exhibits peak Ic at 1.13 V and a broad current peak at approximately -0.81 V (IIc). The conjugated pair of peaks Ia / Ic is related to the TU ↔ FDS + 2H+ + 2e- reaction. And that peaks IIa / IIc are assigned to the reduction of Cu(I)-TU complex. When TU is increased to 0.25 mol/L, the intensity of peak IIa amplifies.
It is noted that the peak IIa potential is the function of TU concentration. The peak is strongly affected and gradually enhances with the concentration of TU, which indicates the higher concentration TU is favor to the formation of Cu(I)-TU complex. Furthermore, it can be seen that the complexation of Cu (I) and TU is the main reaction in this case.
When large amount of TU is added in the solution, some of the interesting features can be observed in Fig.5.
The i-E profile corresponding to the solution containing 0.5 mol/L TU displays a broad peak (IIa) at -0.78 V in the anodic sweep. And the height of the peak gradually enhances as TU concentration further improving. Meanwhile, the peaks Ia, Ic and IIc disappear. The potentiodynamic behavior shows the complexation of Cu(I) and TU is irreversible and accelerated with increasing the concentration of TU.
Combined with Fig.1, higher concentration TU can accelerate the formation of Cu(I)-TU complex and lead to final irreversible complex process. The irreversibility enhance the stability of the Cu(I)-TU complex, which greatly promote copper corrosion.
3.3. Effect of various concentrations thiourea on Tafel plots
Anodic and cathodic Tafel curves for copper in 0.5 mol/L H2SO4 containing different
concentrations of TU were studied. And the values for corrosion current densities (icorr) and corrosion
potentials (Ecorr) were estimated by Tafel extrapolation method.
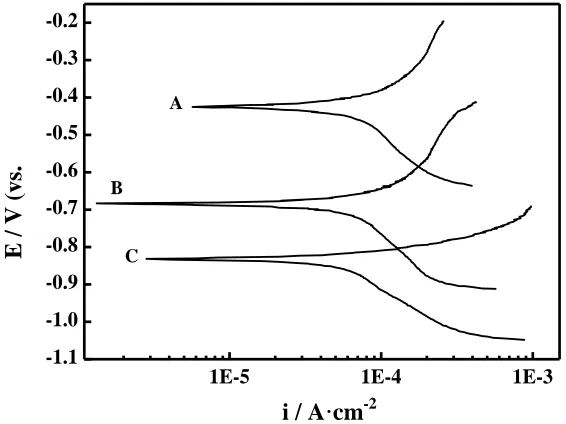
Fig.6 shows the Tafel curves for copper in the absence and present of 0.001 and 0.01 mol/L TU. The corrosion parameters are listed in table 1. The inhibition efficiency (ε%) is calculated using the equation:
Inhibition efficiency (ε%) = corr corr inh( )
corr
i i
i
(1)
where icorr and icorr(inh) are the corrosion current density value without and with TU,
1E-5 1E-4 1E-3
-1.1 -1.0 -0.9 -0.8 -0.7 -0.6 -0.5 -0.4 -0.3 -0.2
C B
A
Figure 6. Anodic and cathodic Tafel curves for copper in 0.5 mol/L H2SO4 containing different
concentrations of TU at 298K. (A) blank; (B) 0.001 mol/L; (C) 0.01 mol/L.
It can be seen that the addition of TU reduces the current density, which inhibits copper corrosion. On the other hand, Ecorr is more negative compared to the free TU system, indicating that
TU is mainly cathodic inhibitor. From table 1, it is clear that ε% increases with the concentration of TU. It is interpreted that TU can adsorb on the metal surface and block the active sites of base metal, which inhibits the corrosion of copper. With the increasing of TU, enough molecules for the complete coverage of copper surface enhance the inhibition efficiency.
Table 1. Corrosion parameters for copper in 0.5 mol/L H2SO4 containing different concentrations of
TU at 298K calculated by the Tafel extrapolation method.
Solution Ecorr (mV) icorr (A·cm-2) ε%
0.5 mol/L H2SO4 -0.5171 1.0120 × 10 -4 -
0.5 mol/L H2SO4 + 0.001 mol/L
TU
-0.7170 7.1000 × 10 -5 45.6
0.5 mol/L H2SO4 + 0.01 mol/L
TU
-0.8638 6.1028 × 10 -5 53.3
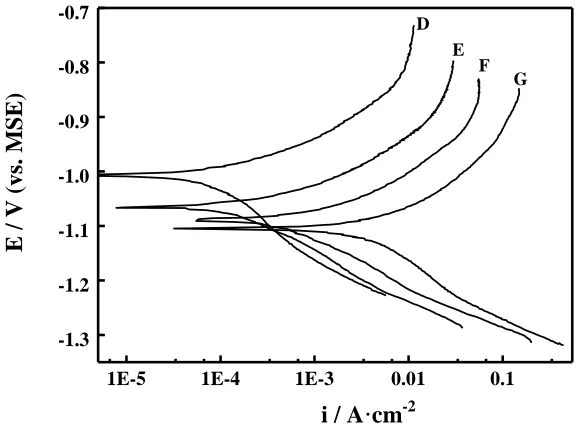
To examine the effect of TU on copper in more detail, Tafel curves containing 0.1~1 mol/L TU were investigated in Fig. 7 and table 2. It is observed that the corrosion current densities increase with the concentration of TU improving. When 1 mol/L TU is added in the solution, the corrosion current density sharply reaches at 5.0040 × 10 -3 A cm-2. Moreover, the corrosion potential shifts negatively.
i / A·cm-2
E
/ V (
vs.
M
S
E
)
[image:7.596.146.429.74.286.2] [image:7.596.82.512.523.665.2]
The results indicate that high concentration of TU progressively promotes copper corrosion. The phenomenon can be attributed to the formation of Cu-TU complexes which accelerates the dissolution of copper.
1E-5 1E-4 1E-3 0.01 0.1
-1.3 -1.2 -1.1 -1.0 -0.9 -0.8 -0.7
G F E D
Figure 7. Anodic and cathodic Tafel curves for copper in 0.5 mol/L H2SO4 containing different
concentrations of TU at 298K. (D) 0.1 mol/L; (E) 0.25 mol/L; (F) 0.5 mol/L; (G) 1 mol/L.
Table 2. Corrosion parameters for copper in 0.5 mol/L H2SO4 containing different concentrations of
TU at 298K calculated by the tafel extrapolation method
Solution Ecorr ( mV) icorr (A·cm-2)
0.5 mol/L H2SO4 -0.5171 1.0120 × 10 -4
0.5 mol/L H2SO4 + 0.1 mol/L TU -1.0392 1.4305 × 10 -4
0.5 mol/L H2SO4 + 0.25 mol/L
TU
-1.0770 4.2359 × 10 -4
0.5 mol/L H2SO4 + 0.5 mol/L TU -1.1257 1.6543 × 10 -3
0.5 mol/L H2SO4 + 1 mol/L TU -1.1268 5.0040 × 10 -3
3.4. Structure analysis of the Cu(I)-TU complex
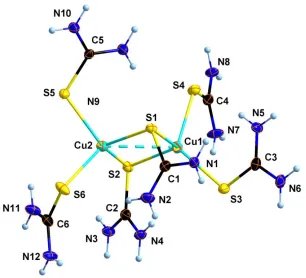
The structure of the Cu(I)-TU complex ion is measured by single crystallogram in Fig. 8. The complex ion consists of two Cu(I) cations, six TU molecules. The two TU molecules are bonded to the Cu(I) ion with monodentate fashion. And the adjacent Cu(I) ions are bridged by S1 and S2 from the two different TU molecules through bidentate chelating modes. Each Cu(I) is four-coordination, and the coordination environment around the Cu(I) ion can be described as a distorted tetrahedral geometry. According to the analysis, the structure of the complex ion is [Cu2(NH2CSNH2)6]2+.
i / A·cm-2
E
/ V (
vs. M
S
E
)
[image:8.596.139.427.151.363.2] [image:8.596.76.516.476.599.2]
Figure 8. Structural diagram of the Cu(I)-TU complex ion with 30% probability ellipsoid.
3.5. The reaction path of thiourea on copper surface in corrosion process
TU as the complexing agent is the key factor influencing the whole reaction. The reaction path of TU on copper surface in corrosion process from the above consideration is depicted as followed:
(1) CTU≤0.01 mol/L
For low concentration TU-containing 0.5 mol/L sulphuric acid, TU is first oxidized to FDS according to the reaction
+
-TUFDS+2H +2e (2)
And the electrochemical processes are influenced by the adsorption of TU and the presence of FDS in the solution. And then TU is mainly corrosion inhibitor.
(2) 0.25 mol/L≥CTU≥0.1 mol/L
In this case, TU is bonded to copper via its sulphur atom accompanied by the weak interaction of TU to FDS.
2+-2 6
The formation of metal complex decreases the potential of Cu+/Cu.
(3) CTU≥0.5 mol/L
The enhancement of TU concentration can accelerate the formation of complex [Cu2(TU)6]2+
and lead to final irreversible complex process, which is favor to corrosion reaction. Meanwhile, the irreversible reactivity enhances the stability of the Cu(I)-TU complex, and greatly promotes the corrosion of copper by TU. And then TU is mainly corrosion accelerant.
4. CONCLUSIONS
The reaction behaviors of various concentrations TU on copper surface in 0.5 mol/L H2SO4
solutions were investigated by cyclic voltammetry, Tafel plots and single crystallogram. The low concentration TU is oxidized to FDS and adsorbs on the copper surface, which was as a corrosion inhibitor. With the improving of TU concentration, TU is bonded to copper via its sulphur atom, which can act as corrosion accelerant to drives corrosion reaction to proceed smoothly. Moreover, the high concentration of TU can accelerate the formation of [Cu2(NH2CSNH2)6]2+ and lead to final irreversible
complex process. It will remarkable promote the corrosion of copper by TU.
ACKNOWLEDGMENT
The authors gratefully acknowledges the financial support by National Natural Science Foundation of China (50801070), Plant Nursery Projects of Guangdong Province (31000-3211602), the Fundamental Research Funds for the Central Universities (2009ZM0284 and 11lgpy08) and industry-university-research cooperation projects of Guangdong Province (2009A080301012 and 2009A090100045).
References
1. G. F. Cui, N. Li, D. Y. Li, M. L. Chi, J. Electrochem. Soc. 152 (2005) C669. 2. Z. J. Liu, G. Z. Wu, Chem. Phys. Lett. 389 (2004) 298.
3. J. Z. Zheng, B. Ren, D. Y. Wu, Z. Q. Tian, J. Electroanal. Chem. 574 (2005) 285. 4. E. Bradley, K. Banerji, IEEE T. Compon. Pack. T. Part B 19 (1996) 320.
5. Y. Tomita, T. Morifuji, M. Tomisaka, M. Sunohara, Y. Nemoto, T. Sato, K. Takahashi, M. Bonkohara, J. Chem. Eng. Jpn. 36 (2003) 119.
6. M. Arra, D. Shangguan, D. Xie, J. Sundelio, J. Electron. Mater. 33 (2004) 977. 7. A.Łukomska, J. Sobkowski, Electrochim. Acta 51 (2006) 2247.
8. A.E. Bolzán, A. S. M. A. Haseeb, P. L. Schilardi, R. C. V. Piatti, R. C. Salvarezza, A. J. Arvia, J. Electroanal. Chem. 500 (2001) 533.
9. J. Zhao, N. Li, G. F. Cui, J. W. Zhao, J. Electrochem. Soc. 153 (2006) C848. 10.N. Tantavichet, M. Pritzker, Electrochim. Acta 50 (2005) 1849.
11.C. H. Ting, M. Paunovic, P. L. Pai, G. Chiu, J. Electrochem. Soc. 136 (1989) 456. 12.L. Vázquez, R. C. Salvarezza, A. J. Arvia, Phys. Rev. Lett. 79 (1997) 709.
15.M. Alodan, W. Smyrl, Electrochim. Acta 44 (1998) 299.
16.L. M. Gassa, J. N. Lambi, A. E. Bolzán, A. J. Arvia, J. Electroanal. Chem. 527 (2002) 71. 17.V. S. Martín, S. Sanllorente, S. Palmero, Electrochim. Acta 44 (1998) 579.
18.G. M. Sheldrick, SHELXL97 and SHELXS97, Program for the Refinement of Crystal Structure, Göttingen University, Germany, 1997.