This is a repository copy of
Enhanced control of the ionization rate in radio-frequency
plasmas with structured electrodes via tailored voltage waveforms
.
White Rose Research Online URL for this paper:
http://eprints.whiterose.ac.uk/123899/
Version: Accepted Version
Article:
Doyle, Scott James, Lafleur, Trevor, Gibson, Andrew Robert
orcid.org/0000-0002-1082-4359 et al. (3 more authors) (2017) Enhanced control of the
ionization rate in radio-frequency plasmas with structured electrodes via tailored voltage
waveforms. Plasma sources science & technology. ISSN 0963-0252
https://doi.org/10.1088/1361-6595/aa96e5
[email protected] https://eprints.whiterose.ac.uk/ Reuse
This article is distributed under the terms of the Creative Commons Attribution-NonCommercial-NoDerivs (CC BY-NC-ND) licence. This licence only allows you to download this work and share it with others as long as you credit the authors, but you can’t change the article in any way or use it commercially. More
information and the full terms of the licence here: https://creativecommons.org/licenses/
Takedown
If you consider content in White Rose Research Online to be in breach of UK law, please notify us by
Enhanced control of the ionization rate in radio-frequency plasmas
with structured electrodes via tailored voltage waveforms
Scott J. Doyle1, Trevor Lafleur2, Andrew R. Gibson1,2, Peng Tian3, Mark J. Kushner3, and
James Dedrick1
1York Plasma Institute, Department of Physics, University of York, Heslington, York, YO10
5DD, UK
2LPP, CNRS, Ecole Polytechnique, UPMC Univ, Paris 06, Univ. Paris-Sud, Observatoire de
Paris, Universite Paris-Saclay, Sorbonne Universites, PSL Research University, 91128 Palaiseau, France
3University of Michigan, Dept. of Electrical and Computer Engineering, 1301 Beal Ave., Ann
Arbor, MI 48109-2122, USA
1E-mail: [email protected]
November 10, 2017
Abstract
Radio-frequency (rf) capacitively coupled plasmas that incorporate structured electrodes
en-able increases in the electron density within spatially localised regions through the hollow cathode
effect. This enables enhanced control over the spatial profile of the plasma density, which is useful
for several applications including materials processing, lighting and spacecraft propulsion.
How-ever, asymmetries in the powered and grounded electrode areas inherent to the hollow cathode
geometry lead to the formation of a time averaged dc self-bias voltage at the powered electrode.
This bias alters the energy and flux of secondary electrons leaving the surface of the cathode and
consequentially can moderate the increased localized ionization afforded by the hollow cathode
discharge. In this work, two-dimensional fluid-kinetic simulations are used to demonstrate control
of the dc self-bias voltage in a dual-frequency driven (13.56 MHz, 27.12 MHz), hollow cathode
enhanced, capacitively coupled argon plasma over the 66.6 - 200 Pa (0.5 - 1.5 Torr) pressure range.
By varying the phase offset of the 27.12 MHz voltage waveform, the dc self-bias voltage varies by
10-15 % over an applied peak-to-peak voltage range of 600-1000 V, with lower voltages showing
cavity vary by a factor of 3 at constant voltage amplitude, demonstrating the ability to control
1
IntroductionThe hollow cathode effect (HCE), generated in capacitively coupled plasmas through the use of
struc-tured electrodes, offers the capability to locally increase the plasma density. To achieve this, hollow
cathode discharges are typically characterized by a cylindrical electrode cavity electrically connected
to a larger grounded area and can be operated with radio-frequency1 (rf) or dc2 power. They are
employed over a wide range of pressures from atmospheric3 to high vacuum4–6 and can form part of
the gas source7 or operate external to it8. Hollow cathodes are being researched for use in a large
variety of industrial processes including etching and deposition1,9, CO2 dissociation10, light sources11 and spacecraft propulsion12–14. Forpd (pressure× distance) values in the range of 0.01 - 10 Torr cm
the hollow cathode effect (HCE) can be initiated, resulting in a large increase in plasma density for a
given voltage2,15.
One of the proposed mechanisms of the HCE arises from the pendular motion of electrons
pro-duced within the electrode cavity, resulting in an increased number of ionization events per secondary
electron5. Positive ions impacting on the inside surface of the hollow cathode produce secondary
elec-trons that are subsequently accelerated through the plasma sheath16. These electrons typically have
non-thermal ‘beam-like’ energy distributions with a mean energy much higher than electrons produced
through collisions in the plasma bulk. These high energy electrons reflect from the opposite cathode
sheath, return to the original sheath, and reflect again leading to pendular motion within the cavity.
They predominately slow by ionization collisions which, when coupled with the higher specific power
deposition of the pendular motion, produces a high plasma density5,15. Hollow cathodes operated at
low pressures (≤13 Pa ) can also enforce higher electron energies by enhancing the maximum sheath
expansion within/above the hollow cathode cavities8. At higher pressures, where the electron collision
frequency is high, pendular electron motion within the cavity is inhibited and collisionless heating at
the sheath expansion decreases in efficiency. Under these conditions, control of secondary electron
energies via tailoring the sheath voltage drop represents a promising mechanism to control the plasma
density in hollow cathodes.
In capacitively coupled plasmas operating at rf voltages, an electrical asymmetry may result when
the powered and grounded electrodes have different current collecting areas. This physical asymmetry
gives rise to a dc self-bias voltage forming at the powered electrode, which ensures that the
time-averaged current reaching each electrode is zero17. Implementing a hollow cathode structure into
the powered electrode introduces, or exaggerates, this geometrical asymmetry between the powered
and grounded electrode surface areas. The formation of a dc self-bias voltage creates challenges for
negative dc bias increases the time averaged voltage drop, while a positive dc bias decreases the
time-averaged voltage drop. A reduction in the voltage drop at the powered electrode may decrease the
ion energies at the electrode surface, which for sufficiently high ion energy, may reduce the probability
of producing secondary electrons15. Additionally, for a positive dc bias, secondary electrons are
accelerated through a smaller sheath potential, compounding the reduction of the HCE. On the other
hand, a negative dc bias will increase both the incident ion energy, which may increase the secondary
electron emission coefficient, and will increase the secondary electron energy entering the bulk plasma,
which will increase ionization. Both lead to an enhancement in the HCE.
Recent investigations employing hollow cathode geometries in capacitively coupled plasmas19,20
have operated with a relatively small powered electrode surface area compared to that of the grounded
vacuum chamber, ensuring a negative dc self-bias. However, in large scale industrial processes, for
example plasma deposition of soft materials, it is often the case that the powered electrode may have
the larger area21,22. In reactors of this type the implementation of a hollow cathode structure would
increase the surface area of the powered electrode, leading to an increasingly positive dc self-bias
voltage which inhibits the HCE. It would therefore be beneficial to regulate the dc self-bias voltage
and hence more effectively control the formation of the HCE.
The dc self-bias is dependent upon the electrode areas and sheath width asymmetry23,24, secondary
electron emission coefficient asymmetry25, and electrical asymmetries26. Of these, the electrical
asym-metry is the only property that does not depend on reactor geoasym-metry and material choice and can
therefore be controlled for a given reactor configuration.
Introducing non-sinusoidal waveforms can induce an electrical asymmetry effect (EAE), allowing
control over the dc self-bias voltage17. The application of the EAE to enhance process control in
capacitively coupled plasmas has been a topic of growing interest over the last decade26–28. Applying a dual-frequency voltage waveform, e.g. the fundamental at frequency ω0 and first harmonic at frequency 2ω0, allows for the creation of asymmetric waveforms, the specific shape of which can be tailored by varying the phase offset between the fundamental and first harmonic voltages29. Varying
the phase offset while maintaining the applied waveform amplitude results in a controllable dc self-bias
voltage, which has been demonstrated to provide effective control over the ion energy and fluxes to
surfaces30,31. The application of additional harmonics with specific phase shifts allows for production
of sawtooth-like and pulse-like waveforms to enable additional control32,33.
In this work, we use two-dimensional numerical simulations to demonstrate enhanced control over
the dc self-bias in a hollow cathode geometry excited by dual-frequency electrically asymmetric
the fundamental frequency (13.56 MHz) and its first harmonic (27.12 MHz), achieving a maximum
variation of one eighth of the peak-to-peak voltage. The model used in this investigation is described
in section 2, and results for 1 Torr argon hollow cathode discharges operated with 800 Vpp single and dual-frequency waveforms are presented in sections3.1and3.2, respectively. Section3.3presents
dual-frequency results for a wider range of pressures; 0.5 Torr, 1.0 Torr and 1.5 Torr, and voltages;
600 Vpp, 800 Vpp and 1000 Vpp.
2
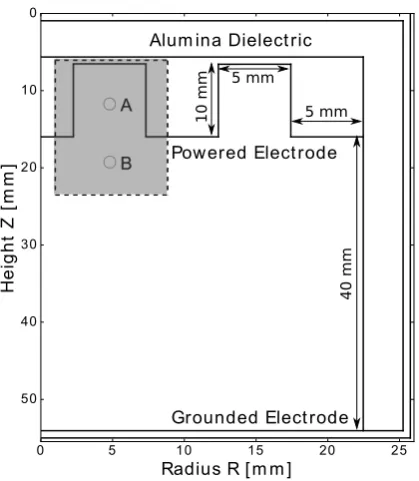
Description of the ModelThe hollow cathode reactor configuration used in this investigation is illustrated in figure 1. An
external circuit comprising of an rf voltage source and blocking capacitor is connected to the powered
electrode (not shown in figure1), where the blocking capacitor prevents a dc current back to the power
source and maintains the time averaged dc self-bias voltage on the powered electrode. The voltage
waveform, φrf(t), is applied either as a single frequency sinusoidal waveform or a dual-frequency non-sinusoidal waveform.
Two-dimensional, fluid-kinetic simulations were undertaken using the Hybrid Plasma Equipment
Model (HPEM)34. The simulation domain, shown in figure1, consisted of a cylindrically symmetric
chamber 25.5 mm in radius, layered with 3 mm of alumina on the radial and top walls. A gap of 40 mm
separates the grounded and powered electrodes, which are 22.5 mm in radius. The powered electrode
incorporates two, 10 mm deep cavities spaced 5 mm apart radially. Two cavities and a dielectric layer
were employed such that interference from the wall on the inner cavity was minimized. The dielectric
layer also acted to shield the grounded side wall from the plasma, and therefore increase the physical
symmetry of the reactor. The focus of the investigation was on the inner cavity centred at 5 mm,
denoted by the shaded region in figure1.
Points A (R = 5 mm, Z = 12 mm) and B (R = 5 mm, Z = 20 mm) mark locations from which
ionization due to secondary electrons and plasma density were investigated. These were chosen to be
0 5 10 15 20 25
Radius R [ m m ]
0
10
20
30
40
50
H
e
ig
h
t
Z
[
m
m
]
A
B
Alum ina Dielect ric
Pow ered Elect rode
Grounded Elect rode
5 mm
5 mm
1
0
m
m
4
0
m
m
[image:7.595.187.397.77.318.2]A
Figure 1: Illustration of the simulation domain (not to scale), radially symmetric around theZ-axis. The shaded area shows the region-of-interest where the centre of the hollow cathode cavity and a point representative of the plasma bulk are denoted by A and B, respectively. Z = 0 mm is located in the top-left corner.
The reactor was operated with a fixed pressure of argon at 66.6 Pa, 133.3 Pa, 200 Pa (0.5 Torr,
1 Torr or 1.5 Torr). The discussion of plasma properties in sections 3.1 and 3.2 are for 133.3 Pa
(1 Torr), while discussion in section 3.3 addresses all three. The charged particle species included in
the simulation are Ar+, Ar+2 and e−, with secondary electrons solved for separately from electrons
created in the plasma bulk. Neutral species included are: Ar, Ar(4s), Ar(4p), Ar(4d) and Ar∗
2 where the reaction mechanism is the same as discussed in Ref. 35. All particle species densities, with the
exception of secondary electrons, are obtained from the solution to mass, momentum and energy
conservation equations. The electron energy distribution function (EEDF) for electrons created in
the plasma bulk is determined using the two-term approximation of the Boltzmann equation. At the
pressures employed, the plasma is considered to be collisional and therefore the ion and neutral energy
distribution functions can reasonably be considered to be Maxwellian. Poisson’s equation is solved to
obtain the temporally and spatially resolved potential.
Secondary electron emission is introduced through an energy independent model with an emission
coefficient of γ = 0.2 at the powered electrode15and γ = 0.0 at the grounded electrode and dielectric
surfaces. It is important to note that the particular values of γ used at powered and grounded
electrodes have an influence on the symmetry of the plasma and therefore the value of the dc self-bias.
As a result, the magnitude of the effects considered in this work will depend on these values, however,
the powered electrode and a Monte Carlo method is then used to track the trajectories of secondary
electrons emitted from the powered electrode in proportion to the ion flux and secondary electron
emission coefficient36. Secondary electron pseudo-particles are launched at the powered electrode
surface with an initial energy of 4 eV and are accelerated through the local potential gradient. As
this is the outcome of a Monte-Carlo simulation there are no further assumptions made regarding the
shape of the secondary electron energy distribution37.
Electron-neutral collisions included in the model include elastic, excitation and ionization reactions,
the interaction cross-sections for which are obtained from Refs. 38–42, full details are given in Ref. 35.
Ion-neutral charge exchange collisions are employed with a rate coefficient of 5.66×10⁻¹⁰cm−3(Tg/300)0.5
whereTg is the neutral-gas temperature43.
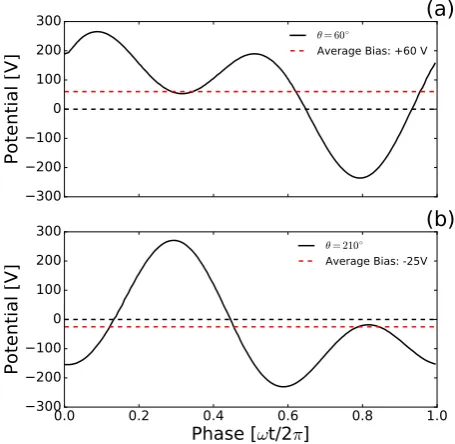
Dual-frequency voltage waveforms, constructed through the superposition of 13.56 MHz and 27.12 MHz
sinusoids with a variable phase delay, are generated using equation 1 and an example of a
dual-frequency waveform is shown in figure2.
φrf(t) = n X
k=1
φ0
n
cos(kω0t +θk) (1)
Here, φrf(t) is the voltage amplitude of the combined waveform, φ0 is the maximum amplitude,
ω0 = 2πf0 is the fundamental angular frequency, θk is the k’th harmonic offset and n is the total number of applied frequencies. Here n = 2, θ1 = 0 and 0◦ < θ2 < 360◦, from this point forward θ2
will be referred to as θ.
Figures2 (a) and (b) show two examples of dual-frequency waveforms generated using equation1
−300 −200 −100 0 100 200 300
Po
te
nt
ia
l [
V
]
(a)
θ = 60◦
Average Bias: +60 V
0.0 0.2 0.4 0.6 0.8 1.0
Phase [ωt/2π] −300
−200 −100 0 100 200 300
Po
te
nt
ia
l [
V
]
(b)
θ = 210◦
[image:9.595.175.403.70.292.2]Average Bias: -25V
Figure 2: Examples of dual-frequency, 13.56 MHz, 27.12 MHz, waveforms generated using equation 1with the 27.12 MHz waveform applied with a phase offsetθof (a) 60◦ and (b) 210◦. Zero potential is shown with a black
dotted line and the mean of the waveform (denoted as average bias) is shown with the red dotted line.
As the phase offset of the 27.12 MHz harmonic is varied the time-averaged bias of the waveform is
altered, this results in a time-averaged electrical asymmetry over an rf cycle and provides a mechanism
for controlling the electrode dc self bias voltage. However, due to the phase offset, such asymmetric
voltage waveforms do not have a single voltage amplitude, it is therefore often easier to discuss them
in terms of the absolute peak-to-peak voltage, Vpp, defined as follows:
Vpp = maxφrf(t)−minφrf(t) (2)
In sections 3.2and 3.3 the fundamental frequency 13.56 MHz and first odd harmonic 27.12 MHz
were employed, each with an amplitude of φ0/2 to enable an effective comparison with the single
frequency case.
3
Hollow Cathode Effects in a Radio-Frequency Powered Discharge
3.1 Single Frequency Operation
A single frequency control case was performed to confirm the presence of the HCE and establish a
baseline for the resulting dc self-bias voltage formation. The control case employed a 400 V amplitude
(800 Vpp), 13.56 MHz driving voltage and an argon pressure of 133.3 Pa (1 Torr). The time-averaged spatial distributions of the plasma density and ionization rate due to secondary electrons are shown
2.5 5.0 7.5 Radius R [mm] 10.0 15.0 20.0 He igh t Z [m m]
A
B
(a)
Plasma Density [m−3]2.5 5.0 7.5 Radius R [mm] 10.0 15.0 20.0 He igh t Z [m m]
A
B
(b)
Secondary Ionization Rate [m−3s−1] [image:10.595.183.414.65.183.2]0.0 0.6 1.2 1.8 2.4 1e17 0.00 0.25 0.50 0.75 1.00 1e23
Figure 3: Time-averaged spatial distributions of (a) plasma density and (b) secondary-electron ionization rates in a 133.3 Pa (1 Torr) argon discharge driven by a single-frequency 13.56 MHz voltage waveform at 400 V amplitude (800 Vpp). The boundary of the hollow cathode cavity is shown by the solid line.
The time-averaged plasma density shows little variation between the cavity (A) and bulk (B), with
maximum values of 2.0 ×10¹⁷ m−3 and 2.3×10¹⁷ m−3, respectively. The hollow cathode effect can
be observed in figure 3(b) as an increased rate of ionization by secondary electrons within the cavity
region (point A) as compared to the discharge bulk (point B). The powered electrode dc self-bias
voltage is 98 V with a peak plasma potential of 224 V. These results qualitatively agree with previous
particle-in-cell simulations using a similar reactor configuration at 34 Pa (0.258 Torr)15.
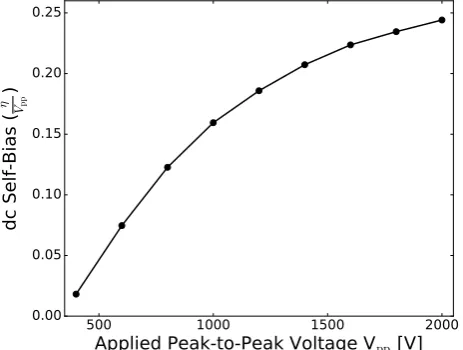
500 1000 1500 2000
Applied Peak-to-Peak Voltage Vpp [V] 0.00 0.05 0.10 0.15 0.20 0.25 dc S el f-Bi as (
η ) Vpp
Figure 4: Normalized powered electrode dc self-bias voltage with respect to applied voltage amplitude. Single-frequency operation at 13.56 MHz, in 133.3 Pa (1 Torr) of argon.
The dc self-bias voltageη, normalized toVpp, increased for increasing applied voltage amplitude as shown in figure4. This trend is consistent with a previously developed analytical model as summarized
in equation 317:
η=−1−ǫ
1 +ǫφ0 where ǫ∝
Ap Ag 2 ¯ nsp ¯ nsg (3)
[image:10.595.183.415.392.567.2]powered and grounded electrode surface areas, and ¯nsp and ¯nsg are the spatially averaged ion densities
in the powered and grounded sheaths, respectively. For a single frequency discharge the symmetry
parameter, and hence dc self-bias voltage, increases due to the increasing asymmetry in ion density
between the powered and grounded electrode sheaths.
Note that the dc self-bias in equation 3is defined with respect to the voltage waveform amplitude,
however results presented here are normalized to Vpp. This is necessitated as asymmetric waveforms do not have a single voltage amplitude. The result is that the dc selfbias is normalized from
-0.5≤η≤0.5, as opposed to -1≤η≤1.
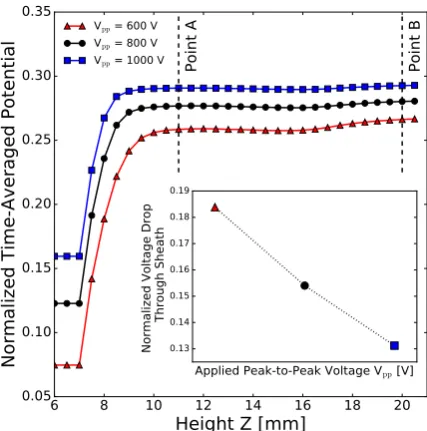
As the ratio of the dc self-bias voltage to applied voltage increases, and the dc self-bias is positive,
the resulting normalized voltage drop through the powered electrode sheath decreases as shown in
figure 5.
6 8 10 12 14 16 18 20
Height Z [mm]
0.05 0.10 0.15 0.20 0.25 0.30 0.35
No
rm
ali
ze
d T
im
e-A
ve
rag
ed
Po
ten
tia
l
Po
int
A
Po
int
B
Vpp = 600 V
Vpp = 800 V
Vpp = 1000 V
[image:11.595.180.394.320.536.2]Applied Peak-to-Peak Voltage Vpp [V] 0.13 0.14 0.15 0.16 0.17 0.18 0.19 No rm ali ze d V olt ag e Dr op Th rou gh Sh ea th
Figure 5: Plasma potential profiles along the inner cavity central axis (R = 5 mm), normalized to Vpp, with
respect to applied voltage amplitude. Inset displays normalized voltage drop from point A to the electrode surface (Z = 7 mm) for the voltage amplitudes shown. Single-frequency operation at 13.56 MHz, 133.3 Pa (1 Torr) argon.
This decrease in sheath voltage drop reduces the HCE through a decrease in the acceleration of
secondary electrons through the powered electrode sheath. Since the dc self-bias voltage increases
with increasing applied voltage amplitude, this behaviour limits the range of applied voltages for a
given reactor geometry for which the HCE can be effectively employed when operated using a single
3.2 Dual-Frequency Operation
To increase control over the HCE through regulation of the dc self-bias voltage two driving frequencies,
13.56 MHz and 27.12 MHz, were applied to the powered electrode using the waveform of equation1.
The applied voltage amplitude was maintained at 400 V, however due to the phase shift between the
two harmonics they add such that Vpp ≤ 800 V. The resulting variation in the dc self-bias voltage, secondary electron ionisation rate and electron density within the cavity (point A) and bulk (point B)
with respect to first harmonic phase offset θare shown in Figure 6.
−0.04 0.00 0.04 0.08 0.12 dc S el f-Bi as
(
η
)
Vpp(a)
max
θ = 60◦
min
θ = 210◦
0.0 0.2 0.4 0.6 0.8 1.0
Se
co
nd
ary
Io
niz
ati
on
Ra
te
[m
− 3s
− 1]
1e23(b)
Cavity (Point A) Bulk (Point B)
0 30 60 90 120 150 180 210 240 270 300 330
Phase Offset
θ◦1.0 1.5 2.0 2.5 3.0 3.5 4.0
Pla
sm
a
De
nsi
ty
[m
− 3]
1e17(c)
[image:12.595.181.411.221.456.2]Cavity (Point A) Bulk (Point B)
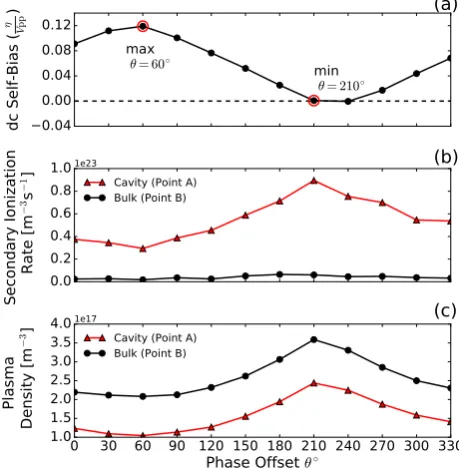
Figure 6: Variation in (a) normalized powered electrode dc self-bias voltage, (b) ionisation rate due to secondary electrons and (c) plasma density as a function of first harmonic phase offset within the hollow cathode cavity (point A) and in the discharge bulk (point B). The dashed line in figure (a) represents zero dc self-bias voltage, solid lines added for clarity.
Figure6(a) shows that the powered electrode dc self-bias voltage varies approximately sinusoidally
with respect to θ. Note that the dc self-bias has been reduced to approximately zero for phase angles
of 210◦ and 240◦. The difference between the maximum and minimum self-bias, indicated by the
red circles, is 96 V, corresponding to approximately 1/8 Vpp. The waveforms resulting in the most positive and negative dc self-bias voltages, θ = 60◦ and θ = 210◦, are shown in figures 2 (a) and
(b), respectively. This trend in dc self-bias modulation qualitatively agrees with a previous analytical
model making use of a physically symmetric geometry26,44. The variation in dc self-bias voltage is not
symmetric about zero due to the existing physical asymmetries within the reactor44.
Figure 6 (b) and 6 (c) show the secondary electron ionization rates and plasma density at points
A and B as a function of the phase offset between the 13.56 MHz and 27.12 MHz voltage waveforms.
The maximum values for plasma density and secondary electron ionization rate both coincide with
secondary electrons emitted will appear at the bottom of a larger potential well if the electrode has a
less positive bias, and will be subsequently accelerated to higher energies resulting in a higher power
coupling efficiency to the electrons. Further, the higher energy secondaries are more efficient ionizers,
not only penetrating deeper into the bulk plasma but also capable of generating a greater number
of ionization events. As previously described, the fraction of the waveform for which the voltage is
less than zero decreases as the dc self-bias becomes more positive. It follows that the least positive
self-bias voltage, i.e. θ = 210◦ in Figure 6 (a), will correspond to the largest number of secondary
electrons with sufficient energy to contribute to the HCE.
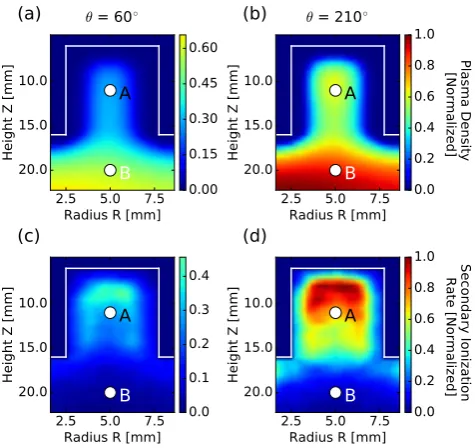
Contour plots of the plasma densities at the extrema in dc self-bias voltage,θ= 60◦ and θ= 210◦,
respectively, are shown in figure 7 (a) and (b) and the corresponding secondary electron ionization
rates are shown in7 (c) and (d).
2.5 5.0 7.5 Radius R [mm] 10.0 15.0 20.0 He igh t Z [m m]
A
B
(a)
θ = 60◦2.5 5.0 7.5 Radius R [mm] 10.0 15.0 20.0 He igh t Z [m m]
A
B
(b)
θ = 210◦2.5 5.0 7.5 Radius R [mm] 10.0 15.0 20.0 He igh t Z [m m]
A
B
(c)
[image:13.595.179.417.307.531.2]2.5 5.0 7.5 Radius R [mm] 10.0 15.0 20.0 He igh t Z [m m]
A
B
(d)
0.00 0.15 0.30 0.45 0.60 0.0 0.2 0.4 0.6 0.8 1.0 Plasm a De nsi ty [No rm aliz ed] 0.0 0.1 0.2 0.3 0.4 0.0 0.2 0.4 0.6 0.8 1.0 Sec ond ary Ion izat ion Ra te [No rm aliz ed]Figure 7: Spatial distributions of time-averaged plasma density for (a)θ= 60◦ and (b)θ= 210◦and ionization
rates due to secondary electrons at (c)θ = 60◦ and (d)θ = 210◦. Images are normalized to maximum value
in theθ= 210◦ case where,θ= 60◦ andθ= 210◦ represent the minimum and maximum dc self-bias voltages,
−0.4 V and +95 V, respectively shown in figure 6 (a). Dual-frequency operation at 800 Vpp with 133.3 Pa
(1 Torr) argon.
The secondary electron ionization rates in the cavity, at point A, vary by a factor of 3 as the phase
offset is varied over 0◦ < θ <360◦, reaching a maximum of 9.0×10²² m−3 at 210◦ offset. Secondary
electron ionization rates outside the cavity, point B, are not significantly influenced by the variation in
dc self-bias voltage, remaining at approximately 1.7 ×10²² m−3s−1 for all phase angle offsets, shown
previously in figure 6 (b).
In figures 7 (d) and (b) it should be noted that although the peak secondary ionization rate was
found within the cavity at point A, the peak plasma density was found within the discharge bulk
secondary electron ionization rate, reaching a maximum value at θ = 210◦, corresponding to the
minimum dc self-bias voltage. The maximum plasma density at point B increases to 3.6 ×10¹⁷ m−3
atθ= 210◦ and is modulated by 40 % over the full range of phase offsets.
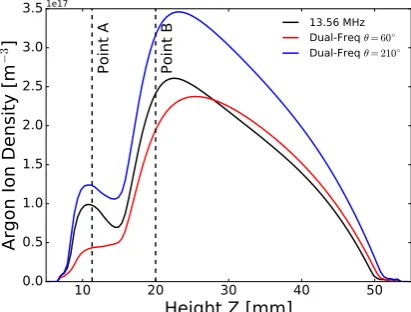
Argon ion (Ar+) density profiles, centered along the inner cavity central axis (R = 5 mm), between the powered and grounded electrodes are shown in figure8for 13.56 MHz operation and dual-frequency
operation at the maximum and minimum dc self-bias voltages,θ= 60◦ and θ= 210◦, respectively.
10 20 30 40 50
Height Z [mm]
0.0 0.5 1.0 1.5 2.0 2.5 3.0 3.5
Ar
go
n I
on
De
nsi
ty
[m
−
3
]
1e17Po
int
A
Po
int
[image:14.595.186.392.205.361.2]B 13.56 MHzDual-Freq θ = 60◦ Dual-Freq θ = 210◦
Figure 8: Time-averaged argon ion (Ar+) density profiles centered along the inner cavity central axis (R = 5 mm)
for single frequency 13.56 MHz operation, and dual-frequency operation withθ= 60◦ andθ= 210◦, where,θ=
60◦ andθ= 210◦ represent the minimum and maximum dc self-bias voltages,−0.4 V and +95 V, respectively.
Performed at 800Vpp with 133.3 Pa (1 Torr) argon.
A localized increase in argon ion density within the cavity at point A (Z = 12 mm) can be observed
as well as an increase in the density in-front of the powered electrode at point B (Z = 20 mm) where
the density peaks at approximately Z = 25 mm. The enhanced argon ion densities achieved for the,
most negative, 210◦ case can be seen to extend until the grounded electrode surface at Z = 55 mm.
The extent of the enhancement is greatest between 15 mm≤Z ≤30 mm.
Note that, although performed at approximately constant peak-to-peak voltage, the power
de-posited varies by 32 % over the range of phase offsets. Resulting argon ion densities vary by 60 % in
the HC cavity (point A) and 40 % in the discharge bulk (point B) respectively.
3.3 Voltage and Pressure Dependence
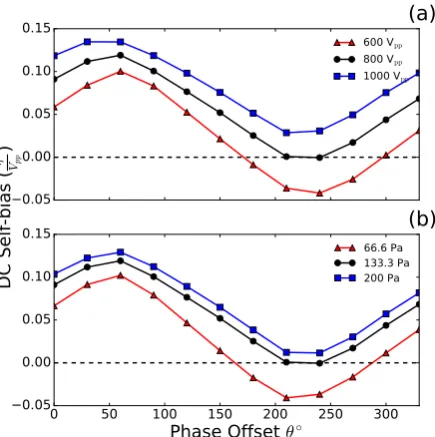
The first harmonic phase offset was varied as described in section3.2for values of Vpp of 600 V, 800 V and 1000 V at a fixed pressure of 133.3 Pa (1 Torr) and also for pressures of 66.6 Pa, 133.3 Pa, 200 Pa
−0.05 0.00 0.05 0.10
0.15 (a)
600 Vpp
800 Vpp
1000 Vpp
0 50 100 150 200 250 300
Phase Offset θ◦ −0.05
0.00 0.05 0.10
0.15 (b)
66.6 Pa 133.3 Pa 200 Pa
DC
S
el
f-bi
as
(
[image:15.595.182.400.55.274.2]η )Vpp
Figure 9: Normalized powered electrode dc self-bias voltage as a function of first harmonic phase offset for varying (a) applied peak-to-peak voltage and (b) argon pressure. The dashed lines represent zero dc self-bias voltage, solid lines added for clarity. Dual-frequency operation, Pressure varied for Vpp= 800 V, Voltage varied
for a pressure of 133.3 Pa (1 Torr).
An increase in Vpp results in a higher average dc self-bias, this agrees with the single frequency case shown in figure 4. The achievable modulation in dc self-bias is 14.2 % at 600 Vpp as compared to 12.0 % at 800 Vpp and 10.6% at 1000 Vpp suggesting that the EAE is more pronounced at lower voltages. This variation in the modulation is found to be approximately linear for changes in voltage
which suggests that it may be dominated by variation in the sheath width asymmetry between the
powered and grounded electrode as described in equation 3.
The effects of varying reactor pressure, figure 9 (b), show that increased pressures result in more
positive dc self-biases. The dc self-bias modulations are 14.3 % at 66.6 Pa (0.5 Torr), 12.0 % at
133.3 Pa (1.0 Torr) and 11.8 % at 200 Pa (1.5 Torr). The decrease in achievable modulation with
increasing pressure is not as pronounced as with increasing voltage. The change in modulation varies
non-linearly with pressure, with a sharp change in modulation observed between 133.3 Pa (1.0 Torr)
and 66.6 Pa (0.5 Torr) where the dc self-bias becomes negative.
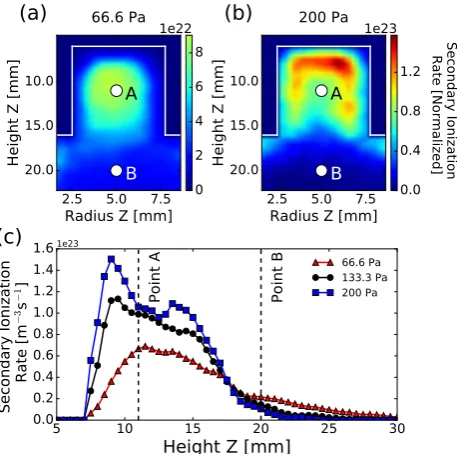
The secondary ionization rate increases for increasing pressure as can be seen in figures10 (a) and
(b). The spatial distribution of secondary ionization moves from the centre of the hollow cathode at
2.5 5.0 7.5
Radius Z [mm]
10.0 15.0 20.0 He igh t Z [m m]
A
B
(a)
66.6 Pa2.5 5.0 7.5
Radius Z [mm]
10.0 15.0 20.0 He igh t Z [m m]
A
B
(b)
200 Pa5 10 15 20 25 30
Height Z [mm]
0.0 0.2 0.4 0.6 0.8 1.0 1.2 1.4 1.6 Se co nd ary Io niz ati on Ra te [m − 3s − 1] 1e23
(c)
Po int B Po intA 66.6 Pa
133.3 Pa 200 Pa 0 2 4 6 8 1e22 0.0 0.4 0.8 1.2 Second
ary Ion izat ion Ra te [No rm aliz ed] 1e23
Figure 10: Spatial distributions of time-averaged secondary ionization rates at θ = 210◦ for (a) 66.6 Pa
(0.5 Torr) and (b) 200 Pa (1.5 Torr). Profiles of the secondary ionization rates along the inner cavity cen-tral axis (R = 5 mm) are shown in (c) for varying reactor pressures. Dual-frequency operation at 800 Vpp.
The location of maximum secondary ionization rate can be seen more clearly in 10 (c). These
locations are 11.5 mm, 9.5 mm and 9 mm for 66.6 Pa, 133.3 Pa, 200 Pa (0.5 Torr, 1 Torr or 1.5 Torr)
respectively. The magnitude of the ionization rate and the location of peak ionization both change
most between 66.6 Pa and 133.3 Pa. This correlates with the large difference in the dc self-bias
between these two pressures, as compared to 133.3 Pa and 200 Pa, shown in figure9(b). The peak in
secondary ionization rate is also much more pronounced for 133.3 Pa and and 200 Pa than the lower
66.6 Pa case. This is attributed to the decreased electron mean free path at these pressures, with
the region of peak ionization shifting from the centre of the cavity to just beyond the sheath edge
in figure 10 (b). However, distances beyond Z = 17 mm in the bulk region show the opposite trend
in secondary ionization, which is observed to increase with decreasing pressure. This is attributed
to an increased electron mean-free path at lower pressures leading to a reduced diffusive (collisional)
confinement within the cathode.
The increase in secondary ionization rate with increasing pressure arises from a combination of a
reduced secondary electron mean-free pathλd∝n−Ar1 and a reduced sheath widthSx ∝n− 0.5
Ar at higher pressures, whereSxis the sheath width23. This non-linear relationship between pressure and secondary
ionization rate within the hollow cathode cavity will lead to a non-linear change in the relative plasma
densities at the powered and grounded electrode surfaces as described by the symmetry parameter ǫ
in equation 3. This explains the non-linear dc self-bias modulation observed for changes in pressure,
[image:16.595.186.415.60.287.2]4
ConclusionsTwo-dimensional, fluid-kinetic simulations have been undertaken to investigate a capacitively coupled,
hollow cathode enhanced discharge driven by a dual-frequency voltage waveform. Control over the
dc self-bias voltage has been demonstrated by varying the phase offset between the fundamental
frequency (13.56 MHz) and 1st harmonic (27.12 MHz). This is in contrast to discharges driven by
single rf frequencies where only limited control can be achieved for a constant peak-to-peak voltage.
The dc self-bias modulation was found to vary by 10-15 % over an applied peak-to-peak voltage range
of 600-1000 V. This modulation was found to decrease approximately linearly with increasing voltage
and decrease non-linearly with increasing reactor pressure. Resulting secondary ionization rates within
the cavity can be regulated by a factor of 3 and plasma densities were demonstrated to increase by
40 % over a 360◦ range of phase offsets. As a result of the enhanced control over the dc self-bias
voltage, and resultant ionization rate, increased flexibility in the design of plasma processing reactors
is achieved through the hollow cathode effect.
5
Acknowledgements
The authors would like to thank Timo Gans, Erik Wagenaars, Christopher Murphy and Peter Hill for
useful discussions. The work presented herein was funded by the Engineering and Physical Sciences
Research Council (EPSRC), grant reference number: EP/m508196/1.
6
References[1] L. B´ardoˇs. Radio frequency hollow cathodes for the plasma processing technology.Surface and Coatings Technology,
86-87(PART 2):648–656, 1996. ISSN 02578972. doi:10.1016/S0257-8972(96)03056-3.
[2] K. H. Schoenbach, R. Verhappen, T. Tessnow, F. E. Peterkin, and W. W. Byszewski. Microhollow cathode
dis-charges. Applied Physics Letters, 13(1996):13, 1995. ISSN 00036951. doi:10.1063/1.116739.
[3] M. J. Kushner. Modeling of microdischarge devices: Pyramidal structures. Journal of Applied Physics, 95(3):
846–859, 2004. ISSN 00218979. doi:10.1063/1.1636251.
[4] R. Mavrodineanu. Hollow Cathode Discharges - Analytical Applications.Journal of Research of the National Bureau
of Standards, 89(2):143, 1984. ISSN 0160-1741. doi:10.6028/jres.089.009.
[5] K. H. Schoenbach, A. El-habachi, W. Shi, and M. Ciocca. High-pressure hollow cathode discharges.Plasma Sources
Science and Technology, 6:468–477, 1997. doi:10.1088/0963-0252/6/4/003.
self-pulsing regime of a micro hollow cathode discharge in argon gas. European Physical Journal D, 60(3):555–563,
2010. ISSN 14346060. doi:10.1140/epjd/e2010-00259-4.
[7] S. Dixon, C. Charles, R. W. Boswell, W. Cox, J. Holland, and R. Gottscho. Interactions between arrayed
hol-low cathodes. Journal of Physics D: Applied Physics, 46(14):145204, 2013. ISSN 0022-3727. doi:
10.1088/0022-3727/46/14/145204.
[8] N. Schmidt, U. Czarnetzki, E. Sch¨ungel, and J. Schulze. The effect of structured electrodes on heating and plasma
uniformity in capacitive discharges. Journal of Physics D: Applied Physics, 46:505202, 2013. ISSN 0022-3727.
doi:10.1088/0022-3727/46/50/505202.
[9] C. M. Horwitz. Hollow cathode etching and deposition. Journal of Vacuum Science & Technology A: Vacuum,
Surfaces, and Films, 6(3):1837, 1988. doi:http://dx.doi.org/10.1116/1.575265.
[10] O. Taylan and H. Berberoglu. Dissociation of carbon dioxide using a microhollow cathode discharge plasma reactor:
effects of applied voltage, flow rate and concentration.Plasma Sources Science and Technology, 24(1):015006, 2015.
ISSN 0963-0252. doi:10.1088/0963-0252/24/1/015006.
[11] S. Takashima, M. Hori, T. Goto, A. Kono, M. Ito, and K. Yoneda. Vacuum ultraviolet absorption spectroscopy
employing a microdiacharge hollow-cathode lamp for absolute density measurements of hydrogen atoms in reactive
plasmas.Applied Physics Letters, 75(1999):3929, 1999. ISSN 00036951. doi:10.1063/1.125497.
[12] C. Charles, A. Bish, R. W. Boswell, J. Dedrick, A. Greig, R. Hawkins, and T. S. Ho. A Short Review of
Experi-mental and Computational Diagnostics for Radiofrequency Plasma Micro-thrusters.Plasma Chemistry and Plasma
Processing, 2015. ISSN 0272-4324. doi:10.1007/s11090-015-9654-5.
[13] R. A. Arakoni, J. J. Ewing, and M. J. Kushner. Microdischarges for use as microthrusters: modelling and scaling.
Journal of Physics D: Applied Physics, 41(10):105208, 2008. ISSN 0022-3727. doi:10.1088/0022-3727/41/10/105208.
[14] L. Blackhall and J. Khachan. A simple electric thruster based on ion charge exchange. Journal of Physics D:
Applied Physics, 40:2491–2494, 2007. ISSN 0022-3727. doi:10.1088/0022-3727/40/8/011.
[15] T. Lafleur and R. W. Boswell. Particle-in-cell simulations of hollow cathode enhanced capacitively coupled radio
frequency discharges. Physics of Plasmas, 19(2), 2012. ISSN 1070664X. doi:10.1063/1.3685709.
[16] A. V. Phelps and Z. Lj. Petrovic. Cold-cathode discharges and breakdown in argon: surface and gas phase
pro-duction of secondary electrons. Plasma Sources Science and Technology, 8(3):R21–R44, 1999. ISSN 0963-0252.
doi:10.1088/0963-0252/8/3/201.
[17] B. G. Heil, U. Czarnetzki, R. P. Brinkmann, and T. Mussenbrock. On the possibility of making a geometrically
symmetric RF-CCP discharge electrically asymmetric.Journal of Physics D: Applied Physics, 41(16):165202, 2008.
ISSN 0022-3727. doi:10.1088/0022-3727/41/16/165202.
[18] H. Bar´ankov´a and L. B´ardoˇs. Effect of gas and cathode material on the r.f. hollow cathode reactive PVD. Surface
and Coatings Technology, 120-121:704–708, 1999. ISSN 02578972. doi:10.1016/S0257-8972(99)00362-X.
[19] Y. Ohtsu and Y. Kawasaki. Criteria of radio-frequency ring-shaped hollow cathode discharge using H2 and Ar gases
[20] Y. Ohtsu, N. Matsumoto, J. Schulze, and E. Sch¨ungel. Capacitive radio frequency discharges with a single
ring-shaped narrow trench of various depths to enhance the plasma density and lateral uniformity.Physics of Plasmas,
23(3), 2016. ISSN 10897674. doi:10.1063/1.4943964.
[21] K. J. Kanarik, T. Lill, E. A. Hudson, S. Sriraman, S. Tan, J. Marks, V. Vahedi, and R. A. Gottscho. Overview of
atomic layer etching in the semiconductor industry.Journal of Vacuum Science & Technology A: Vacuum, Surfaces,
and Films, 33(2):020802, 2015. ISSN 0734-2101. doi:10.1116/1.4913379.
[22] S. Samukawa, M. Hori, S. Rauf, K. Tachibana, P. Bruggeman, G. Kroesen, J. C. Whitehead, A. B. Murphy,
A. F. Gutsol, S. Starikovskaia, U. Kortshagen, J.-P. Boeuf, T. J. Sommerer, M. J. Kushner, U. Czarnetzki, and
N. Mason. The 2012 Plasma Roadmap.Journal of Physics D: Applied Physics, 45(25):253001, 2012. ISSN 0022-3727.
doi:10.1088/0022-3727/45/25/253001.
[23] P. Chabert and N. Braithwaite. Physics of Radio-Frequency Plasmas. Cambridge University Press, Cambridge, 3rd
edition, 2014.
[24] C. M. O. Mahony, R. Al Wazzan, and W. G. Graham. Sheath dynamics observed in a 13.56 MHz-driven plasma.
Applied Physics Letters, 71(5):608, 1997. ISSN 00036951. doi:10.1063/1.119808.
[25] T Lafleur, P Chabert, and J P Booth. Secondary electron induced asymmetry in capacitively coupled plasmas.
Journal of Physics D: Applied Physics, 46(13):135201, 2013. ISSN 0022-3727. doi:10.1088/0022-3727/46/13/135201.
[26] T Lafleur. Tailored-waveform excitation of capacitively coupled plasmas and the electrical asymmetry effect.Plasma
Sources Science and Technology, 25(1):013001, 2016. ISSN 0963-0252. doi:10.1088/0963-0252/25/1/013001.
[27] E. Sch¨ungel, D. Eremin, J. Schulze, T. Mussenbrock, and U. Czarnetzki. The electrical asymmetry effect in
geometrically asymmetric capacitive radio frequency plasmas. Journal of Applied Physics, 112(5), 2012. ISSN
00218979. doi:10.1063/1.4747914.
[28] T Lafleur and J P Booth. Control of the ion flux and ion energy in CCP discharges using non-sinusoidal voltage
waveforms. Journal of Physics D: Applied Physics, 45(39):395203, 2012. ISSN 0022-3727. doi:
10.1088/0022-3727/45/39/395203.
[29] J. Schulze, E. Sch¨ungel, U. Czarnetzki, and Z. Donko. Optimization of the electrical asymmetry effect in
dual-frequency capacitively coupled radio dual-frequency discharges: Experiment, simulation, and model. Journal of Applied
Physics, 106(6), 2009. ISSN 00218979. doi:10.1063/1.3223310.
[30] J. K. Lee, O. V. Manuilenko, N. Yu. Babaeva, H. C. Kim, and J. W. Shon. Ion energy distribution control in single
and dual frequency capacitive plasma sources. Plasma Sources Science and Technology, 14(1):89–97, 2005. ISSN
0963-0252. doi:10.1088/0963-0252/14/1/012.
[31] Z. Donk´o, J. Schulze, B. G. Heil, and U. Czarnetzki. PIC simulations of the separate control of ion flux and energy
in CCRF discharges via the electrical asymmetry effect.Journal of Physics D: Applied Physics, 42(2):025205, 2009.
ISSN 0022-3727. doi:10.1088/0022-3727/42/2/025205.
[32] B. Bruneau, T. Novikova, T. Lafleur, J.-P. Booth, and E. V. Johnson. Control and optimization of the slope
asymmetry effect in tailored voltage waveforms for capacitively coupled plasmas. Plasma Sources Science and
[33] B. Bruneau, T. Lafleur, T. Gans, D. O’Connell, A. Greb, I. Korolov, A. Derzsi, Z. Donk´o, S. Brandt, E. Sch¨ungel,
J. Schulze, P. Diomede, D. J. Economou, S. Longo, E. Johnson, and J.-P. Booth. Effect of gas properties on the
dynamics of the electrical slope asymmetry effect in capacitive plasmas: comparison of Ar, H2 and CF4. Plasma
Sources Science and Technology, 25(1):01LT02, 2016. ISSN 0963-0252. doi:10.1088/0963-0252/25/1/01LT02.
[34] M. J. Kushner. Hybrid modelling of low temperature plasmas for fundamental investigations and equipment design.
Journal of Physics D: Applied Physics, 42(19):194013, 2009. ISSN 0022-3727. doi:10.1088/0022-3727/42/19/194013.
[35] P. Tian and M. J. Kushner. Controlling VUV photon fluxes in low-pressure inductively coupled plasmas. Plasma
Sources Science and Technology, 24:34017, 2015. ISSN 0963-0252. doi:10.1088/0963-0252/24/3/034017.
[36] M. A. Furman and M. T. F. Pivi. Probabilistic model for the simulation of secondary electron
emis-sion. Physical Review Special Topics - Accelerators and Beams, 5(12):82–99, 2002. ISSN 10984402.
doi:10.1103/PhysRevSTAB.5.124404.
[37] S.-H. Song and M. J. Kushner. Control of electron energy distributions and plasma characteristics of dual frequency,
pulsed capacitively coupled plasmas sustained in Ar and Ar/CF4/O2. Plasma Sources Science and Technology, 21
(5):55028, 2012. ISSN 0734-2101. doi:10.1088/0963-0252/21/5/055028.
[38] M. Hayashi. Report No. IPPJ-AM-19. Technical report, Nagoya Institute of Technology, 1991.
[39] K. Tachibana. Excitation of the 1s5, 1s4, 1s3 and 1s2 levels of argon by low-energy electrons. Physical Review A,
34(2), 1986. doi:10.1103/PhysRevA.34.1007.
[40] D. Rapp and P. EnglanderGolden. Total Cross Sections for Ionization and Attachment in Gases by
Elec-tron Impact. I. Positive Ionization. The Journal of Chemical Physics, 43(5):1464–1479, 1965. ISSN 0021-9606.
doi:10.1063/1.1696957.
[41] N. A. Dyatko, Y. Z. Ionikh, I. V. Kochetov, D. L. Marinov, A. V. Meshchanov, A. P. Napartovich, F. B. Petrov,
and S. A. Starostin. Experimental and theoretical study of the transition between diffuse and contracted. J. Phys.
D: Appl. Phys, 41:055204, 2008. doi:10.1088/0022-3727/41/5/055204.
[42] A. Bogaerts, R. G. V. Serikov, and V. V. Serikov. Calculation of gas heating in direct current argon glow discharges.
Journal of Applied Physics, 87, 1999. doi:10.1063/1.373545.
[43] H. W. Ellis, R Y Pai, E. W. Mcdaniel, E. A. Mason, and L. A. Viehland. Transport Properties of Gaseous Ions Over a
Wide Energy Range.Atomic Data and Nuclear Data Tables, 17(3):177–210, 1976. doi:
10.1016/0092-640X(76)90001-2.
[44] J. Schulze, E. Sch¨ungel, U. Czarnetzki, M. Gebhardt, R. P. Brinkmann, and T. Mussenbrock. Making a geometrically
asymmetric capacitive rf discharge electrically symmetric.Applied Physics Letters, 98(3):7–10, 2011. ISSN 00036951.