R E S E A R C H A R T I C L E
Open Access
Evaluation of biases present in the cohort
multiple randomised controlled trial design:
a simulation study
Jane Candlish
1,2*, Alexander Pate
1, Matthew Sperrin
1, Tjeerd van Staa
1,3on behalf of GetReal Work Package 2
Abstract
Background:The cohort multiple randomised controlled trial (cmRCT) design provides an opportunity to
incorporate the benefits of randomisation within clinical practice; thus reducing costs, integrating electronic healthcare records, and improving external validity. This study aims to address a key concern of the cmRCT design: refusal to treatment is only present in the intervention arm, and this may lead to bias and reduce statistical power. Methods:We used simulation studies to assess the effect of this refusal, both random and related to event risk, on bias of the effect estimator and statistical power. A series of simulations were undertaken that represent a cmRCT trial with time-to-event endpoint. Intention-to-treat (ITT), per protocol (PP), and instrumental variable (IV) analysis methods, two stage predictor substitution and two stage residual inclusion, were compared for various refusal scenarios.
Results:We found the IV methods provide a less biased estimator for the causal effect when refusal is present in the intervention arm, with the two stage residual inclusion method performing best with regards to minimum bias and sufficient power. We demonstrate that sample sizes should be adapted based on expected and actual refusal rates in order to be sufficiently powered for IV analysis.
Conclusion:We recommend running both an IV and ITT analyses in an individually randomised cmRCT as it is
expected that the effect size of interest, or the effect we would observe in clinical practice, would lie somewhere between that estimated with ITT and IV analyses. The optimum (in terms of bias and power) instrumental variable method was the two stage residual inclusion method. We recommend using adaptive power calculations, updating them as refusal rates are collected in the trial recruitment phase in order to be sufficiently powered for IV analysis.
Keywords:Trials within cohorts, Cohort multiple randomised controlled trial, Pragmatic trial, Instrumental variable
Background
Clinical trials are facing increasing costs, complexities, and poor accrual, all threatening the viability of the current clinical trial model [1]. There is a vital need for trial designs that promote increased external validity and cost efficiency so we can continue to deliver medical benefits to patients [2]. To this end, there have been fre-quent calls for more pragmatic generalizable trials [3, 4].
A simplification of trial eligibility criteria and integration of routine electronic health records to monitor trial out-comes should play a key role in the development of prag-matic trials [1, 3]. The cohort multiple randomised controlled trial design [5] (cmRCT, also referred to as trial within cohorts design) is a simple and efficient pragmatic trial design that could address some of the issues dis-cussed. In a cmRCT design we identify a large observa-tional cohort, and at the outset consent is obtained from participants both for random allocation to interventions in the future, and to use their medical records data. For a given intervention, eligible patients are identified from the cohort and a random selection are offered the interven-tion. The remaining eligible patients are assigned to the * Correspondence:[email protected]
1Health eResearch Centre, Farr Institute for Health Informatics Research,
University of Manchester, Vaughan House, Portsmouth Road, Manchester M13 9PL, UK
2School of Health and Related Research, University of Sheffield, 30 Regent St,
Sheffield S1 4DA, UK
Full list of author information is available at the end of the article
control group and are not formally recruited into the trial, thus addressing some of the issues with trial accrual.
The cmRCT design offers several advantages. First, the use of a large observational cohort enables multiple trials over time and as patients all come from the same cohort comparability of these trials is improved [5]. Second, elec-tronic healthcare records reduce recruitment and follow-up costs [6], making it possible to have a large control arm requiring minimal additional costs for follow-up. Third, both the intervention and standard of care are delivered at the point of care enabling us to assess the effectiveness of both interventions in real life conditions as opposed to under strict trial conditions.
A cmRCT design has several limitations [5, 7]. The use of routine data will require a mix of skill sets from both clinical trial and observational research, possibly in-creasing costs. Loss to follow-up may be a significant issue if linkage of routine data linkage is not possible. The com-parator is standard of care, this may contain a variety of treatments with some self-selected by the patient so is somewhat an unknown. The feasibility of standardised outcome measures may also be challenging when using routine data. Blinding of participants in the intervention is not possible in the cmRCT design. If the cohort of eligible patients is too small in a cmRCT and refusal is high, it is not possible to keep recruiting until the required power is achieved as this will start oversampling from the control arm leading to a less powerful trial than the standard two arm. A notable limitation is that only patients randomly selected to receive the experimental intervention have the option to refuse the allocated treatment. This refusal may differ from the refusal we see in routine care due to the experimental nature of the study. Refusal can potentially lead to bias in the treatment effect estimate and loss of power. Though the cmRCT design is a recent proposal, its uptake has been fairly broad in application [8–12] and on-going cmRCTs have scarcely considered the matter of re-fusal. Where mention of intended analysis methods were available, intention-to-treat was always used. Only one trial made explicit assumptions about the proportions of refusers in the intervention arm, assuming a 20% refusal rate and planned to use complier average causal effect (CACE) [13] analysis if refusal in the intervention arm was large [10], another noting CACE analysis as a secondary analysis method [9]. CACE analysis provides an unbiased treatment effect estimate for individuals who comply with the protocol, unlike intention-to-treat or per-protocol; however, there is generally a loss of power.
The effects of non-uptake of the experimental inter-vention in cmRCT are unclear. In this study, we under-took a simulation study to test the validity of the cmRCT design in the presence of treatment refusal. The objectives were to assess the bias present in the cmRCT design due to differential refusals and any loss in
statistical power. We identify scenarios where cmRCT are viable designs for point-of-care trials and suggest al-ternate statistical methods, such as instrumental variable analysis, which can be used to reduce bias.
Randomised trials are often divided into two types, in-dividually randomised –individuals randomized to trial arm - or cluster randomized trials – clusters (groups of individuals or communities) randomized to trial arm. In certain scenarios cluster trials can be more appropriate (for instance when we anticipate contamination between trial arms), they can also improve accrual and reduce costs. However, cluster trials require specific design, stat-istical analysis and interpretation and are not always beneficial. In cluster trials we generally anticipate an inflation of the variance due to correlation among indi-viduals in the same cluster, therefore, they require larger sample sizes than individually randomized trials de-signed to answer the same research question (if an indi-vidually randomized trial is possible) and more complex analysis to account for the correlation of outcomes within a cluster. This paper focusses on individually ran-domised cmRCTs, representative of the randomization used in the original cmRCT design and existing cmRCT studies [5]. The case of a cluster cmRCT has been investigated by Pate et al. [14]; differing effects of the refusal on power were found between the cluster and individual trial scenarios. As sample sizes for trials using the cmRCT design will be limited to the size of the cohort, the benefits and requirements for cluster level randomization should be considered with caution.
Methods
Analysis methods
We assessed the bias and variance of effect estimators associated with different analysis methods when treat-ment refusal was present in the intervention arm of a cmRCT study. The methods included: intention-to-treat (ITT), per protocol (PP) and two instrumental variable (IV) analysis techniques. Current trial guidance recom-mends ITT analysis [15]; however, this dilutes the treat-ment effect in the presence of refusal which may result in biased estimates of the causal effect of a treatment, according to our specific definition of treatment effect above [16]. PP analysis excludes people from the study who do not follow protocol, generally yielding biased re-sults as adherence to protocols is often non-random [17]. IV analysis estimates the effect of exposure (X) on the outcome (Y), accounting for all unmeasured confounding. The IV technique is a two stage analysis; the first stage assesses how an unbiased in-strument (randomisation, Z) predicts the exposure (treatment received, X); the second stage uses this in-formation to understand how the exposure predicts the outcome (Y). The performance measures used to assess the four methods were the bias of the estimate of treatment effect, statistical power and standard error.
Figure 1 represents the causal relationships required for an IV analysis in a trial. The three main assumptions for the validity of an instrumental variable are: it is strongly associated with exposure, it has no effect on the outcome other than through the exposure, and it is in-dependent of confounders of the exposure outcome rela-tionship [18]. In an RCT randomisation (Z) meets these assumptions; however, the strength of association with exposure depends upon the non-compliance rates. The performance of two IV approaches were compared, the two stage predictor substitution (2SPS) method and the two stage residual inclusion (2SRI) method [19, 20]. The 2SPS method is a straightforward two stage regression approach. First, regress IV on exposure,Z onX, and let
^
X¼E Xð jZÞ. In the second stage fit a model for the out-come,Y, including X as a covariate. The coefficient of^ X^ from the second stage model is the IV estimated treat-ment effect of interest. Similarly, in the first stage of the 2SRI method regress Z on X, and then calculate the
residual term R=X−E(X|Z). In the second stage, fit a model for the outcome,Y, including both treatment re-ceived, X, and residuals, R, as covariates in the model. The coefficient ofXin the second stage model is the IV estimated treatment effect.
Simulation overview
Simulations were undertaken using statistical software SAS version 9.4 (SAS Institute Inc, Cary, NC) and plots in R version 3.1.2 followed standard guidelines [21]. Sim-ulations replicated a cmRCT study evaluating the effect of an intervention compared with standard of care for patients at risk of CVD [14]. The outcome was time until CVD event, which is of direct importance to the patient, as opposed to some surrogate endpoints [22]. Simulated patient characteristics included: baseline risk of a CVD event (for example, acute myocardial infarc-tion/stroke (fatal or non-fatal) and death attributable to CVD), time to non-CVD mortality, and probability of re-fusing the intervention. If non-CVD mortality event oc-curred before the CVD they were treated as censored. Clinician probability of refusing to offer the intervention was also simulated. The data generating models for time to both CVD event and mortality were Weibull distribu-tions, with distribution parameters chosen to give a cor-relation of 0.25 between CVD and mortality to represent informative censoring. The distribution parameters were chosen so the mean and standard deviation of the ten year CVD risk were representative of the population eli-gible for lipid lowering drugs, 21.1 and 8.7% respectively [14]. Refusal was only present in the intervention arm. We assume the treatment has no effect on the compet-ing risk of death from other causes than CVD event.
We used Weibull baseline hazard functions for all in-dividuals for time until CVD event,Tc, and time until mortality,Tm. Individual risks were created by
incorpor-ating individual random effects to the Weibull baseline hazard function. Given that the shape parameter of a Weibull distribution is fixed, then the proportional hazards assumption holds. The intervention effect used was an average reduction in ten year CVD risk by 25%. The trial follow-up used, Tmax, was three years as a plausible follow-up period in a survival trial. All simula-tion variables are presented in Table 1.
[image:3.595.56.541.640.722.2]Different trial scenarios were generated through varying both the average refusal probability and the correlation of refusal with individual risk. The average patient refusal probability, p, and average clinician re-fusal probability, q, took values of 0.1, 0.2, or, 0.3. Dif-ferent correlation scenarios were created by defining an upper limit (UL) and lower limit (LL) that all indi-viduals’ refusal probability lies between and assigning refusal probabilities equally spaced between these values. Patients were ordered (ascending or descend-ing) by their individual random effect εi. Correlation
between CVD risk and refusal probability took values defined as zero, low, medium, or high using upper and lower limits for individual refusal probabilities ðLL;ULÞ∈
p;p ð Þ; 2p
3 ; 4p
3
; p3; 5p
3
;ð0;2pÞ
. For each scenario we simu-lated 1000 realisations of the trial data.
Sample sizes were calculated under two different re-cruitment methods: rere-cruitment without refusal assumed no refusal and recruitment with refusal used the expected refusal rate in the sample size calculation (this assumes re-fusal is non-informative for the sample size calculation–
not for estimating effects). Both recruitment methods were used for all simulated trial scenarios. We calculated the required sample size using bootstrap methods [23], an unequal randomisation method of 4:1 standard of care:in-tervention, 0.80 statistical power, a type I error rate of 0.05 and a minimum treatment effect tested of an average re-duction in ten year CVD risk by 25% (taken as the mini-mum clinically important effect). If a trial budget is fixed but there is no limitation to the total sample size then an increased statistical power can be obtained by sampling more patients from the control arm [24], hence the un-equal randomisation ratio. Cox proportional hazard sur-vival models were used to provide effect estimates under each analysis method.
Simulation steps
We simulated 1000 trials each with sizeNobs,i= 1,…,Nobs
for each different combination of parameters. Forj= 1,…, 1000 the following procedure was undertaken to simulate hypothetical time to event trial data:
1) Individuals risks: Generate individual random effects,
εis for each patient,i= 1,…,Nobs.
2) Refusal probabilities: Order patients by their individual random effect,εi. Generate refusals either randomly or related to underlying CVD risk by relating them with individual random effect order εi. The probability of a patient refusing intervention if offered it is pi and the
probability of clinician refusing to offer the intervention to the patient isqi.
3) Randomisation: Randomise to standard of care Zi =0, or intervention, Zi =1, on a 4:1 basis.
4) Treatment: Generate the treatment actually received,Xi=0/1 for standard of care/intervention. All those in control arm (Zi= 0) receive standard of
care (Xi= 0) and those randomised to intervention
arm (Zi= 1) receive either intervention or standard
of care dependent upon their refusal,Xi= min
{Bernoulli(1−pi),Bernoulli(1−qi)}.
5) Hazard rate: Apply intervention effect,β¼ 0:32, and individual random effects to the Weibull baseline hazard function to give
h tð Þ ¼ic h0ð Þtc eðβXiþεiÞ;and h tð Þ ¼im h0ð Þtm eð Þεi:
6) Time to event: Simulate individual time to eventTic
andTimfrom corresponding Weibull distributions. 7) Censoring: GenerateCithe censoring indicatorCi
=0/1 if outcome is an observed event/censored. We observe the continuous outcomeYi= min(Tic,Tim, Tmax) and the observed trial data is then {Yi,Ci,Zi,
Xi}, a set of censored survival data, treatment
allocations, and treatments received.
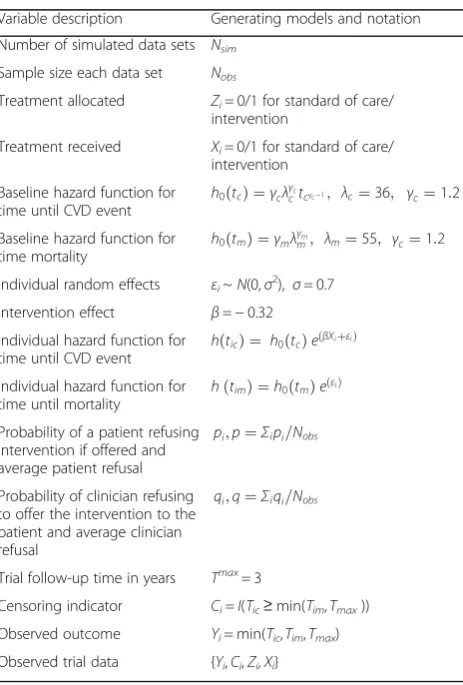
[image:4.595.58.290.390.733.2]8) Analysis: Using ITT, PP, 2SPS, and 2SRI methods fit a Cox proportional hazards model to estimate Table 1Variables included in the simulation study, generating
models, and notation
Variable description Generating models and notation
Number of simulated data sets Nsim
Sample size each data set Nobs
Treatment allocated Zi= 0/1 for standard of care/
intervention
Treatment received Xi= 0/1 for standard of care/
intervention
Baseline hazard function for time until CVD event h
0ð Þ ¼tc γcλγcctcγc−1; λc¼36; γc¼1:2
Baseline hazard function for
time mortality h
0ð Þ ¼tm γmλγmm; λm¼55; γc¼1:2
Individual random effects εi~N(0,σ2), σ= 0.7
Intervention effect β=−0.32
Individual hazard function for
time until CVD event h tð Þ ¼ic h
0ð Þtc eðβXiþεiÞ
Individual hazard function for time until mortality
h tð Þ ¼im h0ð Þtm eð Þεi
Probability of a patient refusing intervention if offered and average patient refusal
pi;p¼Σipi=Nobs
Probability of clinician refusing to offer the intervention to the patient and average clinician refusal
qi;q¼Σiqi=Nobs
Trial follow-up time in years Tmax= 3
Censoring indicator Ci=I(Tic≥min(Tim,Tmax))
Observed outcome Yi= min(Tic,Tim,Tmax)
the effect estimate β^j and the corresponding p-value, sj for each of the four different
estimators.
The same set of simulated data sets were used to com-pare different methods for the same scenario; however, for each scenario a different set of data sets was gener-ated [21]. This enables differences between methods to be detected. The mean effect estimate β¼X
j
^
βj=1000 ,
relative bias β−β=β, and statistical power Ij(pj< 0.05)/
1000 were calculated for each scenario where j= 1,…, 1000. The empirical standard error of the mean effect estimate, β; over all simulations was calculated as S:E:
β ¼S:D: β^j =1000.
[image:5.595.56.539.351.692.2]Results
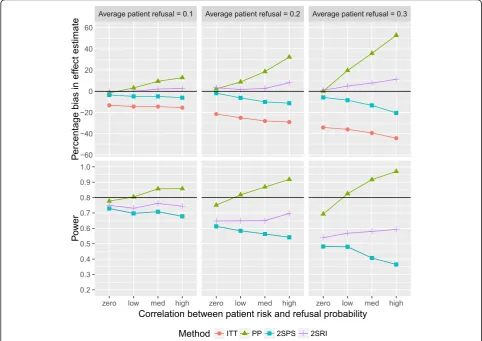
Figure 2 shows the influences of refusal on the causal ef-fect estimate of the treatment (taken per protocol) on
hazard of outcome and power (using recruitment with-out refusal). This was done for a positive correlation be-tween refusal probability and underlying risk for the outcome. PP increasingly overestimates the effect esti-mate as correlation strengthens, refusal probabilities of 0.1 correlated to risk led to bias of between 3.3 and 12.8%; the corresponding power increased. ITT esti-mates were biased; average refusal probabilities of 0.2 underestimated the treatment effect by between 21.5 and 29.0%. As the correlation between refusal and risk strengthened the ITT estimate underestimated the effect with increasing magnitude. Both IV methods were less biased than PP or ITT estimates in all scenarios in Fig. 2. An average refusal of 0.2 and high correlation resulted in bias of −11.2% with 2SPS and 8.1% with 2SRI, com-pared to−29.0% with PP and 32.3% with ITT. The 2SRI method provided the most accurate effect estimate in all scenarios when there was correlation between refusal and risk. The IV and ITT analyses resulted in a lower power than the expected 0.80, the power of 2SRI fluctu-ated between a 0.65 and 0.70. Statistical power of both
Fig. 2Percentage bias (top) and power (bottom) against correlation patient risk and refusal probability using recruitment without refusal and positive correlation between refusal and risk: both plots are paneled by the refusal probabilities and present results for all four analysis methods.
2SPS and ITT were equal and generally decreased as re-fusal and correlations increased.
The bias of the effect estimate and statistical power for negative correlations between refusal and event risk are presented in Fig. 3 (using recruitment without refusal). PP analysis provides underestimated effect estimates, increas-ing as both refusal and correlation increased; the corre-sponding power decreased. An average refusal of 0.1 negatively correlated with risk yielded an underestimate of the effect estimate of between 4.0 and 13.4%, respective power between 0.78 and 0.68. The ITT analysis again underestimated the effect estimate, however, here with decreasing magnitude as correlations strengthened. Both IV methods followed similar patterns to one another, overestimation and power generally increasing as correl-ation strengthened. It is the correlcorrel-ation that most affects the IV analyses, with bias only reaching greater than 10% when refusal is 0.3 and correlation is high.
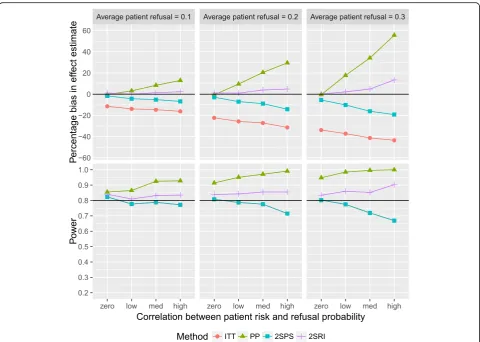
Figure 4 presents the bias of the effect estimate of in-creasing refusal probabilities and positive correlations under recruitment with refusal. The biases are consistent
with those under recruitment without refusal, with some slight variation between the two due to random variation in the sample. However, the main effect of recruitment with refusal compared to recruitment without refusal is, understandably, an increase in statistical power. The 2SRI analyses resulted in overestimation of the effect by between 0.06 and 13.5% and a power which fluctuated between 0.81 and 0.90. Figure 5 shows the effects on bias and power when increasing refusal probabilities and strengthening negative correlations under recruitment with refusal. Again, the biases follow consistent patterns across both re-cruitment methods. The ITT and IV analyses were above the desired statistical power for all scenarios. Of all ap-proaches the 2SPS performed best in terms of minimum absolute bias, between−4.9 and 11.7%.
Scenarios with both clinician refusal and patient re-fusal greater than zero were simulated, with IV methods again providing the least biased effect estimates. The bootstrapped standard Fs were calculated to estimate precision of the effect estimate. For both IV analyses standard errors were greater than the ITT and PP
Fig. 3Percentage bias (top) and power (bottom) against correlation patient risk and refusal probability using recruitment without refusal and negative correlation between refusal and risk: both plots are paneled by the refusal probabilities and present results for all four analysis methods.
[image:6.595.55.539.350.691.2]analyses in all scenarios, with little difference between the standard errors of 2SPS and 2SRI. Considering re-fusal at only the patient level, as seen in Figs. 2, 3, 4, 5, recruitment without refusal produced standard errors of up to 0.11 under ITT analysis and 0.16 under 2SPS and 2SRI analyses. Recruitment with refusal produced con-sistent standard errors regardless of the correlation of around 0.08 under ITT analysis and 0.11 under 2SPS and 2SRI analyses.
Discussion
ITT and PP analysis are equivalent and unbiased with perfect compliance and IV analysis not necessary. When refusal is present, the intervention arm comprises both individuals on intervention and individuals on standard of care. When this refusal is random and uncorrelated with event risk, ITT estimates were biased through dilu-tion bias, bias increasing as refusal rates increased. The makeup of the event risks of the individuals in the inter-vention arm depends upon the direction and strength of the correlation between refusal and event risk thus
inducing bias in the effect estimates. Therefore, the bias in effect estimate when using ITT analysis is also af-fected by this correlation between refusal and risk, small refusal rates resulted in large bias and reduction in power if correlation was high.
IV analyses provided more accurate effect estimates when refusal was correlated to event risk. Effect esti-mates with the smallest absolute bias of all methods were given by the 2SRI method when correlation be-tween refusal and risk was positive and the 2SPS method when correlation between refusal and risk was negative. However, when 2SPS is less biased, it is only by a small amount, and when its more biased it is by a large amount. The 2SPS estimate was also highly effected by direction of correlation, whereas, 2SRI was relatively similar irrespective of correlation direction. The stand-ard errors of IV estimates are larger than ITT or PP due to the two stage modelling procedure.
Sample size ignoring refusal did not provide the de-sired power for all methods and all scenarios, except the PP analysis and positive correlation. The large decrease
[image:7.595.58.539.86.428.2]or increase in statistical power under PP analyses as correlations strengthened was actually indicative of the large bias present in the effect estimate. Sample size acknowledging refusal maintained statistical power for all scenarios when using the 2SRI method and relatively small bias, only greater than 10% when correlation between risk and refusal was high.
The simulation results from this study have relevance to clinical research. Since the development of the cmRCT design uptake has been increasing in conjunction with the movement towards developing more pragmatic trial ap-proaches in order to tackle some of the current challenges present in the clinical trial model [1]. As new cmRCT co-horts continue to emerge it is crucial that the design and analysis of these novel trials remains rigorous. Refusal of an intervention is pragmatic in the sense that that there will likely be some level of refusal to treatment in clinical practice. A certain proportion of the refusal present in a cmRCT trial will be present in real life, some individuals would refuse said treatment whether it was offered as part
of a trial or not. However, refusal may be related to the fact that the intervention is offered as part of a trial. It is expected that the effect size of interest, or the effect we would observe in clinical practice, would be somewhere between that estimated with ITT and IV analyses. All present cmRCT planned ITT as the main analysis method; future research would benefit from using actual refusal rates seen in these trials and thus considering if the refusal rates used in these simulations are realistic.
It is expected that there will be patients who do not refuse the intervention, but are noncompliant to some degree. If the non-compliance present in a trial is also expected in clinical practice, we believe the intervention effect estimate can just ignore it, it is realistic of clinical practice. In a cmRCT, given the passive follow-up of the control arm, it would not make sense to use any compli-ance increasing tactics for the intervention arm, and its likely it would be hard to assess compliance using the routinely collected data, so lack of compliance should ideally be treated as part of treatment effect.
Fig. 5Percentage bias (top) and power (bottom) against correlation patient risk and refusal probability using recruitment with refusal and negative correlation between refusal and risk: both plots are paneled by the refusal probabilities and present results for all four analysis methods.
[image:8.595.58.539.86.429.2]A key limitation of this study is that heterogeneous treatment effects were not considered and such results are not generalizable to studies with a heterogeneous treatment effect. Secondly, adding time dependent co-variates to the risks may provide a more realistic sce-nario of how individual risks change over time. Further work could consider more complex trial scenarios that may occur in the cmRCT design. For example, when the new treatment or control treatment is harmful in terms of non-CVD mortality and how this competing risk affects the effect estimate and power of the trial mortality. The effect of multiple trials within the same cohort, which is an interesting design feature of the cmRCT, could also be investigated to assess how pos-sible correlation of control arm affects hypothesis test-ing and error rates [25]. Due to the use of a cohort in a cmRCT for recruitment it would also be of interest to investigate more closely the effect of refusal on power. For example, considering a trial simulation with a fixed cohort of size n and different refusal rates, this could be used to provide an idea of scenarios when it may be more powerful to do a standard two arm trial than a cmRCT and thus preferable. As previously discussed if the cohort of eligible patients in a cmRCT is too small and the refusal high, there is the risk of oversampling the control arm leading to a less powerful trial than the standard two arm RCT.
Conclusion
We have presented simulation results that show both the biases and statistical power of a cmRCT design are altered through refusal, particularly non-random refusal. We recommend a cmRCT design to assess probable re-fusal rates at the outset as well as the effect estimate, and to incorporate these into power calculations. We recommend using adaptive power calculations, updating them as refusal rates are collected in the trial recruit-ment phase. The instrurecruit-mental variable methods provide a less biased effect estimate when refusal is present in the intervention arm. On average the 2SRI method pro-vides effect estimates with the smallest absolute bias of all methods and sufficient power when using recruit-ment with refusal. We recommend running both an ITT and 2SRI analyses as it is expected that the effect size of interest, or the effect we would observe in clinical prac-tice, would lie somewhere between those estimated with ITT and IV analyses. We demonstrate that sample sizes should be adapted based on expected and actual refusal rates in order to be sufficiently powered for instrumental variable analysis.
Abbreviations
2SPS:Two stage predictor substitution; 2SRI: Two stage residual inclusion; cmRCT: Cohort multiple randomised control trial; CVD: Cardiovascular
disease; ITT: Intention-to-treat; IV: Instrumental variable; PP: Per-protocol; RCT: Randomised controlled trial; TwiCs: Trials within cohorts
Acknowledgements
The research leading to these results was conducted as part of Work Package 2 of the GetReal consortium. For further information please refer to http://www.imi-getreal.eu/. This paper only reflects the personal views of the stated authors.
Funding
The work leading to these results has received support from the Innovative Medicines Initiative Joint Undertaking under grant agreement number 115546, resources of which are composed of financial contribution from the European Union’s Seventh Framework Programme (FP7/20072013) and EFPIA companies' in-kind contribution. The study was also partly supported by the University of Manchester's Health eResearch Centre (HeRC) funded by the Medical Research Council (MRC) Grant MR/K006665/1.
Availability of data and material
All data used was simulated, simulations code is available from [email protected] on request.
Authors’contributions
The idea for the paper was originally developed by TvS. JC ran the simulations and drafted the manuscript. MS provided consultation when running the simulations. AP provided assistance and consultation in running the simulations. TvS, MS, and AP revised the paper critically. TvS, JC, AP and MS approved the final version.
Competing interest
The authors declare that they have no competing interests.
Consent for publication
Not applicable.
Ethics approval and consent to participate
Not applicable.
Author details
1Health eResearch Centre, Farr Institute for Health Informatics Research,
University of Manchester, Vaughan House, Portsmouth Road, Manchester M13 9PL, UK.2School of Health and Related Research, University of Sheffield, 30 Regent St, Sheffield S1 4DA, UK.3Utrecht Institute for Pharmaceutical Sciences, Utrecht University, Utrecht, The Netherlands.
Received: 21 July 2016 Accepted: 18 January 2017
References
1. Vickers AJ. Clinical trials in crisis: four simple methodologic fixes. Clin trials. 2014;11(6):615–21.
2. Institue of Medicine. The Learning Healthcare System: Workshop Summary (IOM Roundtable on Evidence-Based Medicine). Washington, DC: National Academies Press (US); 2007.
3. van Staa T-P, Klungel O, Smeeth L. Use of electronic healthcare records in large-scale simple randomized trials at the point of care for the documentation of value-based medicine. J Intern Med. 2014;275(6):562–9. 4. Treweek S, Zwarenstein M. Making trials matter: pragmatic and explanatory
trials and the problem of applicability. Trials. 2009;10(1):37. 5. Relton C, Torgerson D, O’Cathain A, Nicholl J. Rethinking pragmatic
randomised controlled trials: introducing the‘cohort multiple randomised controlled trial’design. BMJ. 2010;340(7753):963–7.
6. Van Staa T-P, Goldacre B, Gulliford M, Cassell J, Pirmohamed M, Taweel A, Delaney B, Smeeth L. Pragmatic randomised trials using routine electronic health records: putting them to the test. BMJ. 2012;344:e55.
7. Clegg A, Relton C, Young J, Witham M. Improving recruitment of older people to clinical trials: use of the cohort multiple randomised controlled trial design. Age and Ageing. 2015;44(4):547–550.
Youth.”[Online]. Available: https://clinicaltrials.gov/ct2/show/study/ NCT01980147. Accessed 29 June 2015.
9. Kwakkenbos L, Jewett LR, Baron M, Bartlett SJ, Furst D, Gottesman K, Khanna D, Malcarne VL, Mayes MD, Mouthon L, Poiraudeau S, Sauve M, Nielson WR, Poole JL, Assassi S, Boutron I, Ells C, van den Ende CH, Hudson M, Impens A, Körner A, Leite C, Costa Maia A, Mendelson C, Pope J, Steele RJ, Suarez-Almazor ME, Ahmed S, Coronado-Montoya S, Delisle VC, Gholizadeh S, Jang Y, Levis B, Milette K, Mills SD, Razykov I, Fox RS, Thombs BD. The
Scleroderma Patient-centered Intervention Network (SPIN) Cohort: protocol for a cohort multiple randomised controlled trial (cmRCT) design to support trials of psychosocial and rehabilitation interventions in a rare disease contex. BMJ Open. 2013;3(8):1–11.
10. Burbach JPM, Verkooijen HM, Intven M, Kleijnen J-PJ, Bosman ME, Raaymakers BW, van Grevenstein WM, Koopman M, Seravalli E, van Asselen B, Reerink O. RandomizEd controlled trial for pre-operAtive dose-escaLation BOOST in locally advanced rectal cancer (RECTAL BOOST study): study protocol for a randomized controlled trial. Trials. 2015;16(1):58.
11. M. van Vulpen,“Randomized Trial Comparing Conventional Radiotherapy With Stereotactic Radiotherapy in Patients With Spinal Metastases - VERTICAL Study - Full Text View - ClinicalTrials.gov.”[Online]. Available: https://www.clinicaltrials. gov/ct2/show/NCT02364115. Accessed 13 July 2015.
12. Mitchell N, Hewitt C, Adamson J, Parrott S, Torgerson D, Ekers D, Holmes J, Lester H, McMillan D, Richards D, Spilsbury K. A randomised evaluation of CollAborative care and active surveillance for Screen-Positive EldeRs with sub-threshold depression (CASPER): study protocol for a randomized controlled trial. Trials. 2011;12(1):225.
13. Hewitt CE, Torgerson DJ, Miles JNV. Is there another way to take account of noncompliance in randomized controlled trials? CMAJ. 2006;175(4):347–8. 14. Wu J, Zhu S, Yao GL, Mohammed MA, Marshall T. Patient factors influencing
the prescribing of lipid lowering drugs for primary prevention of cardiovascular disease in UK general practice: a national retrospective cohort study. PLoS One. 2013;8(7):1–10.
15. Cobos-Carbó A, Augustovski F. CONSORT 2010 Declaration: updated guideline for reporting parallel group randomised trials. Med Clin (Barc). 2011;137(5):213–5.
16. Nagelkerke N, Fidler V, Bernsen R, Borgdor M. Estimating treatment effects in randomized clinical trials in the presence of non-compliance. Stat Med. 2000;19:1849–64.
17. Sussman JB, Hayward RA. An IV for the RCT: using instrumental variables to adjust for treatment contamination in randomised controlled trials. BMJ. 2010;340:c2073.
18. Ali MS, Uddin MJ, Groenwold RHH, Pestman WR, Belitser SV, Hoes AW, de Boer A, Roes KCB, Klunge OH. Quantitative falsification of instrumental variables assumption using balance measures. Epidemiology. 2014;25(5):770–2. 19. Tchetgen EJ, Walter S, Vansteelandt S, Martinussen T, Glymour M.
Instrumental variable estimation in a survival context. Epidemiology. 2015; 26(3):402–410.
20. Terza JV, Basu A, Rathouz PJ. Two-stage residual inclusion estimation: addressing endogeneity in health econometric modeling. J Health Econ. 2008;27(3):531–43.
21. Burton A, Altman DG, Royston P, Holder RL. The design of simulation studies in medical statistics. Stat Med. 2006;35:4279–92.
22. Weintraub WS, Lüscher TF, Pocock S. The perils of surrogate endpoints. Eur Heart J. 2015;36(33):2212–8.
23. K. Kleinman and S. S. Huang,“Calculating power by bootstrap, with an application to cluster-randomized trials,”arXiv:1410.3515v1 [stat.AP], 2014. 24. Torgerson DJ, Campbell MK. Use of unequal randomisation to aid the
economic efficiency of clinical trials. BMJ. 2000;321(7263):759. 25. Howard DR, Brown JM, Todd S, Gregory WM. Recommendations on
multiple testing adjustment in multi-arm trials with a shared control group. Stat Methods Med Res; 2016.
• We accept pre-submission inquiries
• Our selector tool helps you to find the most relevant journal
• We provide round the clock customer support
• Convenient online submission
• Thorough peer review
• Inclusion in PubMed and all major indexing services
• Maximum visibility for your research
Submit your manuscript at www.biomedcentral.com/submit