affect aphid community composition
SUZIB. CLAFLIN ,1,5, NATALIEHERNANDEZ,2RUSSELLGROVES,3JENNIFERS. THALER,1AND ALISONG. POWER4
1
Department of Entomology, Cornell University, Ithaca, New York 14850 USA 2
USDA APHIS CBP, San Francisco, California 94111 USA 3
Department of Entomology, University of Wisconsin, Madison, Wisconsin 53706 USA 4
Department of Ecology and Evolutionary Biology, Cornell University, Ithaca, New York 14850 USA
Citation: Claflin, S. B., N. Hernandez, R. Groves, J. S. Thaler, and A. G. Power. 2019. Intra-annual variation and landscape composition interactively affect aphid community composition. Ecosphere 10(5):e02710. 10.1002/ecs2.2710
Abstract. Agricultural intensification impacts local arthropod communities. The temporal and spatial
variation of agricultural environments can have a significant impact on insect pest populations, yet little
work has been done to date on the effect of intra-annual variation (within season) or spatiotemporal effects on arthropod functional community composition. The aim of this research was to evaluate the effects of intra-annual variation and landscape composition on the aphid community. To that end, we investigated the following research question: How do intra-annual variation and landscape composition affect aphid
abun-dance, species richness, and functional community composition? In this study, we quantified landscape
com-position as percent cropland, intra-annual variation as sampling week measured throughout the growing
season, and aphid functional community composition as crop virus transmission—or vectoring—ability. We
collected data in two agricultural regions: a diversified agricultural region in New York State (NY) and an
agriculturally intense potato-growing region in Wisconsin (WI). We found that the interactive effect of
land-scape composition and intra-annual variation significantly affected aphid abundance and species richness in
both study regions, and functional community composition in NY. These results indicate that
spatiotempo-ral shifts in agroecosystems have significant implications for aphid functional community composition.
Key words: agroecology; insect-vectored pathogen; landscape epidemiology; vector ecology.
Received3 March 2019; accepted 11 March 2019. Corresponding Editor: Debra P. C. Peters.
Copyright:©2019 The Authors. This is an open access article under the terms of the Creative Commons Attribution License, which permits use, distribution and reproduction in any medium, provided the original work is properly cited.
5Present address: Menzies Institute for Medical Research, University of Tasmania, 17 Liverpool Street, Hobart, Tasmania
7000 Australia.
E-mail: suzi.clafl[email protected]
I
NTRODUCTIONThe effect of landscape composition on local communities often varies over time, with tempo-ral shifts and landscape structure interactively shaping local communities. Tscharntke et al. (2012) describe this phenomenon in their land-scape-moderated concentration and dilution hypothesis, which posits “spatial and temporal changes in landscape composition can cause tran-sient concentration or dilution of populations with functional consequences.”Most research in
interactions (Tylianakis et al. 2007). Both effects could impact the functional composition of the community, and similar effects could occur within a growing season. Yet to date, little work has been done on intra-annual (within season) shifts or their impact on the functional composi-tion of local communities (Tscharntke et al. 2012), despite their possible implications for agricultural pest pressure and vector-borne crop disease spread. In this study, we compare data from two potato-producing areas to explore the interactive effects of landscape composition and intra-annual variation on local insect pest abundance, species richness, and functional community composition. This work is informed by our previous research, which demonstrated a direct relation-ship between the percentage of cropland in the surrounding landscape and end-of-season Potato virus Y (PVY, a non-persistent aphid-borne crop virus) prevalence on small-scale farms in New York State (Claflin et al. 2016). Greater percent-ages of cropland within radiuses ranging from 500 m to 1500 m had significantly higher PVY prevalence, and this relationship appeared to be mediated by the direct effect of the landscape on the aphid community. In this study, we delve deeper into the data we collected in New York State, as well as data collected in Wisconsin, to further develop our understanding of the rela-tionship between landscape composition and the aphid vectors of PVY, with particular emphasis on spatiotemporal and functional trait effects.
Spatiotemporal effects are likely inherent in this system, because agricultural systems are fragmented both spatially and temporally and are subject to high levels of disturbance and vari-ation. Because landscape composition in the sur-rounding area affects the connectivity and permeability of the landscape for agricultural pests (Margosian et al. 2009), these shifts can affect the abundance and composition of the local arthropod assemblage. Shifts in landscape com-position over time associated with agricultural intensification, such as habitat loss and fragmen-tation, increased chemical inputs, and increased crop cover, can affect insect pest abundance, and these effects are often species-specific (Banks 1998, Braschler et al. 2003, Weibull and Ostman€ 2003, Grez et al. 2008, O’Rourke et al. 2011, Zhao et al. 2015). Land use, vegetation type, and man-agement style have also been found to affect the
composition of arthropod assemblages in groups ranging from bees to spiders (Rusch et al. 2014, Torma et al. 2014, Woodcock et al. 2014). For example, Woodcock et al. (2014) found that the amount of arable crop production and semi-nat-ural habitat cover had opposing effects on the functional diversity of ground beetles and bees. The arable crop production was negatively corre-lated with functional diversity, while the semi-natural habitat cover was positively correlated with functional redundancy.
Temporal shifts, such as seasonal variation in weather, precipitation, and environmental dis-turbance, such as raking, desiccation, or other management practices, can affect insect pest abundance and movement (Cocu et al. 2005, Narayandas and Alyokhin 2006, Krauss et al. 2011, Davis et al. 2014). Cardinale et al. (2006) found that the asynchronous mowing of alfalfa fields caused a difference of several orders of magnitude in pea aphid (Acyrthosiphon pisum
Harris) density among alfalfa fields, resulting in significant spatial and temporal variation. Sea-sonal insect pest movement is not random; Via-latte et al. (2006) found that aphids have preferred routes and that most of the aphids col-onizing wheat came from another crop, maize. By changing the proportion of each species in the insect pest assemblage, seasonal shifts in species abundances could alter the species composition, and possibly the functional composition of the community.
The diverse community of aphid vectors sug-gests that functional community composition may also play an important role in the PVY pathosystem. A large suite of aphid species vec-tor PVY. Aphid vecvec-tor species vary widely in transmission efficiency (the probability of virus transmission from an infected to an uninfected host plant) and life history (Gray et al. 2010). Many aphid vector species are non-colonists (do not settle and reproduce) on potato. Although the most efficient PVY vector, the green peach aphid (Myzus persicaeSulz.), is a potato-coloniz-ing species (i.e., settles and reproduces on potato), the large vector assemblage is mostly comprised of non-colonists (Gray et al. 2010).
and (2) the proportion of aphids that were unde-fined PVY vector species (with no published transmission efficiency), and the proportion with low and high transmission efficiencies. In this context, altering the aphid functional community composition could have significant implications for predicting pest pressure and PVY risk.
The aim of this study was to evaluate the effects of intra-annual variation and landscape composition on the aphid community. To explore this, we investigated the following sequential research predictions: (1) Spatiotemporal effects, as measured in the interactive effect of landscape composition and intra-annual variation, will have a significant impact on the aphid commu-nity; (2) as predicted by the landscape-moderated concentration and dilution hypothesis, those spa-tiotemporal effects will impact aphid functional community composition; and (3) based on our previousfindings linking landscape composition and PVY prevalence, we predict that sites sur-rounded by greater amounts of cropland will have higher proportions of efficient PVY vectors in the aphid community throughout the season. To address these predictions and assess the con-sistency of our results, we evaluated two study regions. We analyzed data collected in two 2-yr surveys of the aphid community in potatofields: one in an agriculturally intense region in central Wisconsin (WI) in 2010 and 2011 and the other in the diversified Finger Lakes region of New York State (NY) in 2012 and 2013.
M
ETHODSStudy system
Aphids are a major crop pest and cause signifi-cant crop damage, both directly through phloem feeding and indirectly by vectoring crop patho-gens (Dedryver et al. 2010). Because plants infected with PVY are difficult to identify and rogue (remove) in the field, and PVY has a very rapid period of inoculation (e.g., within seconds of initial probing behavior), effective mitigation strategies are limited, and insecticide use offers little advantage (Gray et al. 2010). There is also an unusually large (>40 species) suite of known vector species. These characteristics make the aphid community tractable for exploring ques-tions about functional community composition and abundance, with respect to PVY spread.
Farm sites
In NY, sampling took place at 19 farms in 2012 and 21 farms in 2013 (including 17 of those sam-pled in 2012). The farms were located throughout the Finger Lakes region and grew multiple culti-vars of potatoes. Field management practices varied between the farms. However, all but three farms used little to no pesticides. The sites consti-tuted a gradient of landscape composition, rang-ing from 3.6% cropland within 500 m to 92.3% cropland within 500 m (Appendix S1: Table S1).
In WI, sampling took place at 9 sites in 2010 and 9 sites in 2011. One 2010 site was excluded from analyses because there was significant over-lap in the surrounding landscape (i.e., it was too near) with other sites. The sites constituted a gra-dient of landscape composition, ranging from 41.5% cropland within 500 m to 95.6% (Appendix S1: Table S1).
Land use within 500 m of the site was calcu-lated using the 2010, 2011, 2012, and 2013 Crop-land Data Layers (USDA National Agricultural Statistics Service, Cropland Data Layer), respec-tively, and ArcGIS software (ArcMap 10.2; ESRI, Redlands, California, USA) and was divided into three categories: cropland, unmanaged land, and other. The data layer is a remotely sensed, categor-ical description of crop and semi-natural land using georeferenced 30930 m squares (raster pixels) that can be used to measure spatial pat-terns of crop production. Detailed accuracy assess-ment estimates are published for individual crops in both NY and WI, and the large area row crops have accuracies ranging between 85% and 95% accuracy. All managed land, including pasture, was included as cropland. Fallow or idle cropland and forested land categories were included as unmanaged land. Developed land, barren land, and open water were categorized as other. The sites were at least 1 km apart. Mantel tests were used to test for spatial autocorrelation of land-scape simplification. The results for the Mantel tests were not significant (Appendix S1: Table S2), indicating that our measure of landscape simplifi-cation was not spatially autocorrelated.
Sampling schedule
during the growing season (8 farms in 2012 and 9 in 2013). For the sites sampled each week, the insect traps (see below) were collected and replaced at each visit. The traps were collected and removed after a week at the sites sampled periodically. In WI, all sites were sampled weekly through the sampling interval.
Sampling insect abundance and community
composition
To sample the aphid community in NY, nine pan traps were placed at each farm approxi-mately 3–4 weeks after planting, when plants were emerging, with three traps in each of three rows. The traps were placed in the two periph-eral rows and the center row of each site. The pan traps were made in the style of green tile traps: a hard 17.5 9169 9 cm plastic box with green plastic that mimics the reflectance of leaves (4430 Filter; Rosco, Markham, Ontario, Canada) glued to the bottom of the pan. Each trap was filled with water containing two drops of dish soap to lessen the surface tension of the water into which alate aphids would drop and not escape. Traps were suspended approximately 1 m off the ground on a rebar stake (Boiteau 1990). The traps were placed approximately mid-way down the length of a potato row, with 2 m between traps.
In WI, sampling was conducted in a similar manner, except that the pan traps contained a green tile—instead of plastic material—to mimic the surrounding plants. They also contained a mixture of 50:50 propylene glycol: water, instead of a water–soap mixture. Twenty-one traps were set at each site along four transects of five traps per transect at each sampling location. Each tran-sect was aligned in each cardinal direction with traps positioned at 3.05 m outside the potato field in the weedy margin, at the field edge (0 m), between the weedy margin and potatoes, 3.05 m into the potato field, 7.62 m into the potato field, and 15.24 m into the potato field. Thefinal trap was positioned as close to the cen-ter of the field as possible. Trap positioning within the row and above the canopy was similar to NY and was adjusted weekly to remain just above the developing potato canopy.
Each trap was collected and replaced after one week. The water traps were sieved using a 1 mm2mesh screen, and the collected specimens
were stored at room temperature in 70% ethanol for later identification. Following collection, aphids were identified to species using morpho-logical characters (Pike et al. 2003, key; D. Voeg-tlin and D. Lagos,personal communication). In NY, 72% (1240) of aphid specimens were identified to species, 21% (366) were identified to genus, and the remaining 7% (113) could not be resolved. Aphid abundance was calculated as a surrogate term for magnitude of capture, by dividing the total number of aphids collected at a site by the number of water traps. In WI, 79% (3604) of the aphid specimens were identified to species, 18% (809) were identified to genus, and the remaining 3% (130) could not be resolved. Aphid species richness was calculated as the number of species collected over the season at a site. As most gen-era only included one or a few aphids, each genus was treated as a unique species in these analyses. Unidentified specimens were excluded from analyses.
All aphid specimens were categorized in three ways, according to their species or genus func-tional traits (Halbert et al. 2003, Verbeek et al. 2010, Boquel et al. 2011, Mello et al. 2011, Pel-letier et al. 2012):
1. colonization status (binary distinction between potato colonizer or non-colonizer),
2. vector status (binary distinction between PVY vector or non-vector),
3. transmission efficiency (non-binary distinc-tion between non-vector, undefined vector (no accepted transmission efficiency), low-transmitting vector (transmission efficiency <0.1 probability), or high-transmitting vector (transmission efficiency >0.1 probability)).
Analysis
greater than zero. The hurdle models included two predictor variables: time period (defined below) and the percentage of agricultural land within 500 m. The results of the hurdle models dictated the type of regression model that was used to evaluate possible interaction between time period and land use. Probit models were used to evaluate response variables where there was a significant difference between zero and non-zero values, and truncated linear regression was used where there was no significant differ-ence between the two.
Because hurdle models do not allow for an interaction term, probit or truncated generalized linear regression models were used to determine if there was an interaction between spatial and temporal predictor variables. Intra-annual varia-tion was measured as time period (early, weeks 1–4; midseason, weeks 5–8; late, weeks 9–12; and end of season, weeks 13–15), in order to avoid temporal autocorrelation. Landscape composi-tion was measured as agricultural intensity within 500 m of the sampling site (low, 0–25% cropland; medium, 26–50% cropland; high, 51–75% cropland; and very high, 76–100% crop-land). The proportion vector species and the proportion low-transmitting species were assessed using a Poisson error distribution, as models using a binomial error distribution could not resolve the log likelihoods.
Aphid abundance and species richness were not zero-inflated and were assessed using a general-ized mixed-effects model, with a Poisson distribu-tion. Because some sites were sampled in more than one year, sampling site was included as a ran-dom effect. Similarly, because the WI results were not zero-inflated, all response variables were ana-lyzed using generalized mixed-effects linear regression model with a Poisson distribution. Because sites were not sampled in both years, the sampling site was not included as a random effect. The average percent cropland and unmanaged land and the average number of aphids per trap of the two study regions were compared using Wilcoxon signed-rank tests. All analyses were conducted in STATA (StataCorp, College Station, Texas, USA) (SE-64, version 15) and R (version 3.2.1).
R
ESULTSStudy region and aphid community comparison
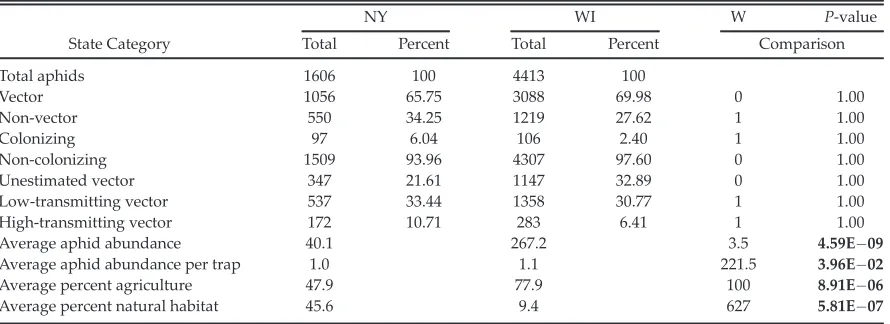
[image:5.612.85.530.501.663.2]The WI study region had significantly lower mean percent unmanaged land and significantly higher mean percent cropland within 500 m compared to the NY study region. The WI sites had approximately 25% greater mean percent cropland and approximately 36% less mean per-cent unmanaged land within 500 m than the NY sites (Table 1). The WI study region also had
Table 1. Results of Wilcoxon signed-rank tests comparing descriptive statistics between the NY and WI sampling regions.
State Category
NY WI W P-value
Total Percent Total Percent Comparison
Total aphids 1606 100 4413 100
Vector 1056 65.75 3088 69.98 0 1.00
Non-vector 550 34.25 1219 27.62 1 1.00
Colonizing 97 6.04 106 2.40 1 1.00
Non-colonizing 1509 93.96 4307 97.60 0 1.00
Unestimated vector 347 21.61 1147 32.89 0 1.00
Low-transmitting vector 537 33.44 1358 30.77 1 1.00
High-transmitting vector 172 10.71 283 6.41 1 1.00
Average aphid abundance 40.1 267.2 3.5 4.59E 09
Average aphid abundance per trap 1.0 1.1 221.5 3.96E 02
Average percent agriculture 47.9 77.9 100 8.91E 06
Average percent natural habitat 45.6 9.4 627 5.81E 07
Notes: Data included in this table are as follows: category of comparison (the response variable in the analysis), the response variable for NY, the response variable for WI, and the results of the Wilcoxon signed-rank test. Where presented, percentages
significantly greater aphid abundance than the NY region. However, this difference is unlikely to be important in practice, as the WI sites had an average of 1.14 times higher aphid abundance per trap (Table 1).
In NY, the 1606 identified aphids collected over the two seasons included 87 species and genus groups (these were used when the species could not be determined). In WI, the 4413 identi-fied aphids included 110 species and genus groups. There was a wide range in the abun-dance of different species captured. In both study regions,A. pisum, a non-colonizing species with low PVY transmission efficiency, was the most abundant species captured overall, while the most abundant potato-colonizing species was
M. euphorbiae.
The two study regions had similar functional aphid community compositions (Table 1). Of the 1606 identified specimens in NY, approxi-mately 66% were PVY vectors: 22% were unde-fined vectors, about 33% were low-transmitting vectors, and about 11% were high-transmitting vectors. In WI, approximately 70% of the identi-fied specimens were PVY vectors: 33% were undefined vectors, 31% were low-transmitting vectors, and 6% were high-transmitting vectors. The vast majority of specimens (approximately 94% in NY and 98% in WI) were non-colonizing species. Only approximately 6% and 2% were potato-colonizing species in NY and WI, respec-tively, all of which were PVY vector species (Table 1).
Prediction 1: Spatiotemporal effects will have a
significant impact on the aphid community
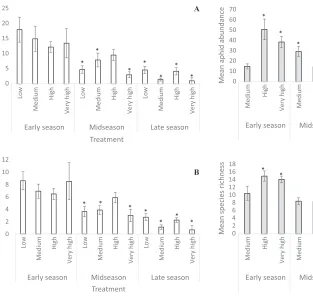
In this study, landscape composition and intra-annual variation interacted to affect aphid abun-dance and species richness in both NY and WI (Table 2). In both regions, the relationship between aphid abundance and landscape com-position varied throughout the growing season, showing similar shifts in the relationship over time (Figs 1A, 2A). In NY, the mean abundance decreased significantly between the early season and midseason. The mid- and late-season mean abundances are significantly lower than the early-season mean abundances for all landscape composition treatments except for the midseason high-agricultural intensity treatment (Fig. 1A). The WI data were more variable, with the mean
abundances decreasing throughout the season in the high- and very high-agricultural intensity treatments and increasing significantly in the medium-agricultural intensity treatment before falling again (Fig. 2A).
The interaction of landscape composition and intra-annual variation also had a significant effect on aphid species richness in both study regions (Table 2; Figs 1B, 2B). Shifts in the rela-tionship between landscape composition and aphid species richness were similar between the two regions and similar to those for aphid abun-dance. The major exception was that the mean species richness in the medium landscape com-position treatment in WI—unlike abundance— decreased throughout the season (Fig. 2B).
Prediction 2: Spatiotemporal effects will impact
aphid functional community composition
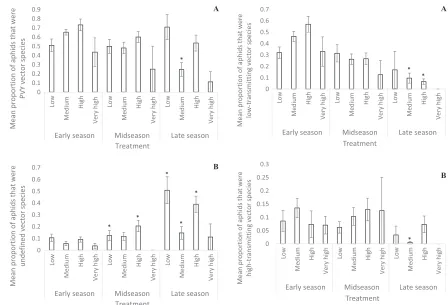
In NY, the interaction of intra-annual variation and landscape composition significantly affected aphid functional community composition (Table 3, Figs 3, 4). The hurdle model analyses indicated that there were significant differences between the zero and non-zero treatments with respect to the proportion of aphids that were PVY vector spe-cies, the proportion that were low-transmitting vectors, and the proportion that were high-trans-mitting vectors (Appendix S1: Table S3). The pro-bit models of these response variables show that they were all significantly affected by the interac-tion of intra-annual variainterac-tion and landscape com-position. However, although there are some clear numerical differences, there are few significant differences. The proportion of aphids that were vector species and the proportion that were high-transmitting vector species were quite variable, fluctuating over the course of the season (Figs 3A, 4B). In both cases, only the late-season medium-agricultural intensity treatment was significantly different from the baseline treatment (early-sea-son low-intensity treatment).
The proportion of low-transmitting vector spe-cies showed a clear numerical trend, decreasing throughout the growing season in all landscape composition treatments (Fig. 4A). However, only the late-season medium- and high-intensity agricul-ture were significantly different from the baseline treatment (early-season low-intensity treatment).
with zero and non-zero values for the proportion of undefined vectors species (Appendix S1: Table S3). The proportion of aphids that were undefined increased throughout the season. The midseason low- and high-intensity agriculture
[image:7.612.82.528.119.611.2]treatments and the late-season low-, medium-, and high-intensity treatments had a significantly greater proportion of undefined vector species compared to the baseline treatment (early-season low-intensity treatment; Table 3, Fig. 3B).
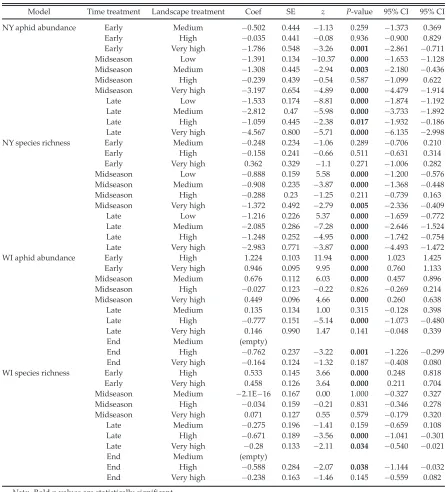
Table 2. Results of generalized linear mixed models (NY data) and generalized linear models (WI data) with Poisson distribution assessing the interactive effect of time and landscape treatments on aphid abundance and species richness.
Model Time treatment Landscape treatment Coef SE z P-value 95% CI 95% CI
NY aphid abundance Early Medium 0.502 0.444 1.13 0.259 1.373 0.369
Early High 0.035 0.441 0.08 0.936 0.900 0.829
Early Very high 1.786 0.548 3.26 0.001 2.861 0.711
Midseason Low 1.391 0.134 10.37 0.000 1.653 1.128
Midseason Medium 1.308 0.445 2.94 0.003 2.180 0.436
Midseason High 0.239 0.439 0.54 0.587 1.099 0.622
Midseason Very high 3.197 0.654 4.89 0.000 4.479 1.914
Late Low 1.533 0.174 8.81 0.000 1.874 1.192
Late Medium 2.812 0.47 5.98 0.000 3.733 1.892
Late High 1.059 0.445 2.38 0.017 1.932 0.186
Late Very high 4.567 0.800 5.71 0.000 6.135 2.998
NY species richness Early Medium 0.248 0.234 1.06 0.289 0.706 0.210
Early High 0.158 0.241 0.66 0.511 0.631 0.314
Early Very high 0.362 0.329 1.1 0.271 1.006 0.282
Midseason Low 0.888 0.159 5.58 0.000 1.200 0.576
Midseason Medium 0.908 0.235 3.87 0.000 1.368 0.448
Midseason High 0.288 0.23 1.25 0.211 0.739 0.163
Midseason Very high 1.372 0.492 2.79 0.005 2.336 0.409
Late Low 1.216 0.226 5.37 0.000 1.659 0.772
Late Medium 2.085 0.286 7.28 0.000 2.646 1.524
Late High 1.248 0.252 4.95 0.000 1.742 0.754
Late Very high 2.983 0.771 3.87 0.000 4.493 1.472
WI aphid abundance Early High 1.224 0.103 11.94 0.000 1.023 1.425
Early Very high 0.946 0.095 9.95 0.000 0.760 1.133
Midseason Medium 0.676 0.112 6.03 0.000 0.457 0.896
Midseason High 0.027 0.123 0.22 0.826 0.269 0.214
Midseason Very high 0.449 0.096 4.66 0.000 0.260 0.638
Late Medium 0.135 0.134 1.00 0.315 0.128 0.398
Late High 0.777 0.151 5.14 0.000 1.073 0.480
Late Very high 0.146 0.990 1.47 0.141 0.048 0.339
End Medium (empty)
End High 0.762 0.237 3.22 0.001 1.226 0.299
End Very high 0.164 0.124 1.32 0.187 0.408 0.080
WI species richness Early High 0.533 0.145 3.66 0.000 0.248 0.818
Early Very high 0.458 0.126 3.64 0.000 0.211 0.704
Midseason Medium 2.1E 16 0.167 0.00 1.000 0.327 0.327
Midseason High 0.034 0.159 0.21 0.831 0.346 0.278
Midseason Very high 0.071 0.127 0.55 0.579 0.179 0.320
Late Medium 0.275 0.196 1.41 0.159 0.659 0.108
Late High 0.671 0.189 3.56 0.000 1.041 0.301
Late Very high 0.28 0.133 2.11 0.034 0.540 0.021
End Medium (empty)
End High 0.588 0.284 2.07 0.038 1.144 0.032
End Very high 0.238 0.163 1.46 0.145 0.559 0.082
In WI, spatiotemporal effects had no effect on aphid functional community composition (Appendix S1: Table S4).
D
ISCUSSIONOverall, there was high species diversity among aphid alates trapped, including over 60 species in each year. Despite significant differences in the surrounding landscape composition of the two study regions, several of the most abundant spe-cies in the WI study region, such asA. pisumand
C. eleagni, were also among the most abundant in NY. In both regions, over 90% of specimens were
non-colonizers of potato, and over 66% were known PVY vectors. The interaction of landscape composition and intra-annual variation affected aphid abundance and species richness in both study regions, and functional community compo-sition in NY. Our results indicate that landscape composition and seasonal variation interactively shape the aphid community in both diversified and simple cropping systems.
Prediction 1: Spatiotemporal effects will have a
significant impact on the aphid community
The interaction of landscape composition and intra-annual variation had a significant effect on A B 0 5 10 15 20 25 Low Me diu m High Ver y high Low Me diu m High Ver y high Low Me diu m High Ver y high
Early season Midseason Late season
Mean aphid abundanc
e Treatment * * * * * * * 0 2 4 6 8 10 12 Low Me diu m High Ver y high Low Me diu m High Ver y high Low Me diu m High Ver y high
Early season Midseason Late season
[image:8.612.273.517.79.381.2]M e an sp ecies rich n e ss Treatment * * * * * * *
Fig. 1. The (A) average aphid abundance and (B) species richness in each time treatment (early season,
weeks 1–4; midseason, weeks 5–8; and late season,
weeks 9–12; and end of season, weeks 13–15) and
landscape composition treatment, measured as agri-cultural intensity within 500 m of the sampling site
(low, 0–25% cropland; medium, 26–50% cropland;
high, 51–75% cropland; and very high, 76–100%
crop-land) in NY. Asterisks indicate significant difference
from the early-season low-intensity treatment.
A B 0 10 20 30 40 50 60 70 Medium High
Very high Medium
High
Very high Medium
High
Very high
High
Very high
Early season Midseason Late season End of season
Mean aphid abundance
Treatment * * * * * * 0 2 4 6 8 10 12 14 16 18 Medium High
Very high Medium
High
Very high Medium
High
Very high
High
Very high
Early season Midseason Late season End of season
Mean species richness
Treatment *
*
* * *
Fig. 2. (A) The average aphid abundance and (B) species richness in each time treatment (early season,
weeks 1–4; midseason, weeks 5–8; and late season,
weeks 9–12; and end of season, weeks 13–15) and
landscape composition treatment, measured as agri-cultural intensity within 500 m of the sampling site
(low, 0–25% cropland; medium, 26–50% cropland;
high, 51–75% cropland; and very high, 76–100%
crop-land) in WI. Asterisks indicate significant difference
[image:8.612.98.411.80.380.2]aphid abundance and species richness in both study regions. Overall, aphid abundance and species richness decreased through the season in both study regions. The decrease in aphid
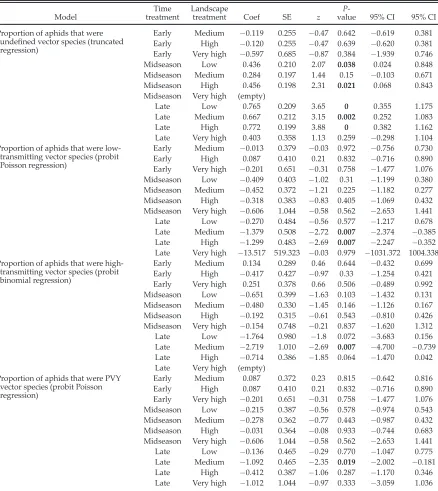
[image:9.612.88.526.122.613.2]abundance over time could be explained by cli-matic variables, with higher temperatures and lower precipitation, either directly (by decreasing aphid fitness or movement) or indirectly (by Table 3. Results of truncated and probit regression models of the interactive effect of landscape composition (percent cropland) and intra-annual variation on the proportion of aphids that were vectors, and the
propor-tion that were low-transmitting, high-transmitting, and undefined vectors in NY.
Model
Time treatment
Landscape
treatment Coef SE z
P
-value 95% CI 95% CI
Proportion of aphids that were
undefined vector species (truncated
regression)
Early Medium 0.119 0.255 0.47 0.642 0.619 0.381
Early High 0.120 0.255 0.47 0.639 0.620 0.381
Early Very high 0.597 0.685 0.87 0.384 1.939 0.746
Midseason Low 0.436 0.210 2.07 0.038 0.024 0.848
Midseason Medium 0.284 0.197 1.44 0.15 0.103 0.671
Midseason High 0.456 0.198 2.31 0.021 0.068 0.843
Midseason Very high (empty)
Late Low 0.765 0.209 3.65 0 0.355 1.175
Late Medium 0.667 0.212 3.15 0.002 0.252 1.083
Late High 0.772 0.199 3.88 0 0.382 1.162
Late Very high 0.403 0.358 1.13 0.259 0.298 1.104
Proportion of aphids that were low-transmitting vector species (probit Poisson regression)
Early Medium 0.013 0.379 0.03 0.972 0.756 0.730
Early High 0.087 0.410 0.21 0.832 0.716 0.890
Early Very high 0.201 0.651 0.31 0.758 1.477 1.076
Midseason Low 0.409 0.403 1.02 0.31 1.199 0.380
Midseason Medium 0.452 0.372 1.21 0.225 1.182 0.277
Midseason High 0.318 0.383 0.83 0.405 1.069 0.432
Midseason Very high 0.606 1.044 0.58 0.562 2.653 1.441
Late Low 0.270 0.484 0.56 0.577 1.217 0.678
Late Medium 1.379 0.508 2.72 0.007 2.374 0.385
Late High 1.299 0.483 2.69 0.007 2.247 0.352
Late Very high 13.517 519.323 0.03 0.979 1031.372 1004.338
Proportion of aphids that were high-transmitting vector species (probit binomial regression)
Early Medium 0.134 0.289 0.46 0.644 0.432 0.699
Early High 0.417 0.427 0.97 0.33 1.254 0.421
Early Very high 0.251 0.378 0.66 0.506 0.489 0.992
Midseason Low 0.651 0.399 1.63 0.103 1.432 0.131
Midseason Medium 0.480 0.330 1.45 0.146 1.126 0.167
Midseason High 0.192 0.315 0.61 0.543 0.810 0.426
Midseason Very high 0.154 0.748 0.21 0.837 1.620 1.312
Late Low 1.764 0.980 1.8 0.072 3.683 0.156
Late Medium 2.719 1.010 2.69 0.007 4.700 0.739
Late High 0.714 0.386 1.85 0.064 1.470 0.042
Late Very high (empty)
Proportion of aphids that were PVY vector species (probit Poisson regression)
Early Medium 0.087 0.372 0.23 0.815 0.642 0.816
Early High 0.087 0.410 0.21 0.832 0.716 0.890
Early Very high 0.201 0.651 0.31 0.758 1.477 1.076
Midseason Low 0.215 0.387 0.56 0.578 0.974 0.543
Midseason Medium 0.278 0.362 0.77 0.443 0.987 0.432
Midseason High 0.031 0.364 0.08 0.933 0.744 0.683
Midseason Very high 0.606 1.044 0.58 0.562 2.653 1.441
Late Low 0.136 0.465 0.29 0.770 1.047 0.775
Late Medium 1.092 0.465 2.35 0.019 2.002 0.181
Late High 0.412 0.387 1.06 0.287 1.170 0.346
Late Very high 1.012 1.044 0.97 0.333 3.059 1.036
decreasing host plant or ant mutualist fitness) reducing aphid abundance as the season pro-gresses (Adler et al. 2007, Barton and Ives 2014). Ma et al. (2015) found that increasing the num-ber of extreme high-temperature events changed the aphid community structure, with species-specific responses to increased temperature driv-ing the shift. Management strategies, such as greater irrigation or harvesting, may also reduce aphid abundance through the season (Matis
et al. 2008). Krauss et al. (2011) found that aphid abundance was significantly greater in conven-tional fields compared to organic and that con-ventional fields that sprayed insecticides had higher late-season aphid abundance than those that did not. It is unsurprising that aphid species richness followed a similar pattern to aphid abundance. Aphid abundance and species rich-ness are often strongly correlated, and the same factors driving one could influence the other. A B 0 0.1 0.2 0.3 0.4 0.5 0.6 0.7 0.8 0.9 Low Medium High Very high Low Medium High Very high Low Medium High Very high
Early season Midseason Late season
Mean proportion of aphids that were
PVY vector species
Treatment * 0 0.1 0.2 0.3 0.4 0.5 0.6 0.7 Low Medium High Very high Low Medium High Very high Low Medium High Very high
Early season Midseason Late season
Mean proportion of aphids that were
undefined vector species
[image:10.612.79.527.80.385.2]Treatment * * * * *
Fig. 3. The average proportion of aphids that were (A) PVY vector species (probit Poisson model) and (B)
undefined PVY vector species (truncated regression
model) in each time treatment (early season, weeks 1–
4; midseason, weeks 5–8; and late season, weeks 9–12;
and end of season, weeks 13–15) and landscape
com-position treatment, measured as agricultural intensity
within 500 m of the sampling site (low, 0–25%
crop-land; medium, 26–50% cropland; high, 51–75%
crop-land; and very high, 76–100% cropland) in NY.
Asterisks indicate significant difference from the
early-season low-intensity treatment.
A 0 0.1 0.2 0.3 0.4 0.5 0.6 0.7 Low Me diu m High Ver y high Low Me diu m High Ver y high Low Me diu m High Ver y high
Early season Midseason Late season
Mean pr oportion of aphids tha t w e re low-tr ansmit tin g v e ctor species Treatment * * 0 0.05 0.1 0.15 0.2 0.25 0.3 Low Me diu m High Ver y high Low Me diu m High Ver y high Low Me diu m High Ver y high
Early season Midseason Late season
Mean pr oportion of aphids tha t w e re high-t ra nsmitting v e ctor species Treatment * B
Fig. 4. The average proportion of aphids that were A) low-transmitting PVY vector species (probit Pois-son model) and B) high-transmitting (probit binomial model) PVY vector species in each time treatment
(early season, weeks 1–4; midseason, weeks 5–8; and
late seasons, weeks 9–12; and end of season, weeks
13–15) and landscape composition treatment,
mea-sured as agricultural intensity within 500 m of the
sampling site (low, 0–25% cropland; medium, 26–
50% cropland; high, 51–75% cropland; and very high,
76–100% cropland) in NY. Asterisks indicate signifi
[image:10.612.91.311.81.388.2]Prediction 2: Spatiotemporal effects will impact
aphid functional community composition
The differences in effect between WI and NY suggest that there may be significant differences in the drivers of aphid functional community composition between regions and that the rela-tionship between spatiotemporal factors and the aphid community is more nuanced than pre-dicted. The interactive effect of landscape com-position and intra-annual variation was only significant effect in NY. This may be due to the fact that the NY study region was significantly less agriculturally intense and more diverse than the WI study region. This may be an example of Tscharntke and coauthor’s intermediate land-scape-complexity hypothesis (Tscharntke et al. 2012), which posits that the landscape-moder-ated effectiveness of local conservation efforts will be highest in simplified landscapes com-pared to cleared or complex landscapes. There-fore, temporal and land use differences within 500 m may have a more pronounced effect on the aphid community in regions that are not so intensively farmed. These results may also reflect species differences in physiology, life history (e.g., Rothamsted Insect Survey), and differences in management practices between the two regions. Aphid abundance often exhibits species-specific responses to landscape complexity and climate (Banks 1998, Braschler et al. 2003, Grez et al. 2008, Zhao et al. 2015). Management prac-tices, such as more intense insecticide use, may also significantly influence the aphid community. These practices likely differed substantially between the diversified NY study region and the agriculturally intense WI study region.
The interactive effect of landscape composition and intra-annual variation on the NY aphid com-munity has implications for aphid comcom-munity composition and PVY prevalence. The fluctuat-ing effect on the proportion of aphids that were vector species obscures differences between vec-tor groups. Overall, the proportion of undefined vectors increased over the course of the season, and the proportion of low- and high-transmitting vectors (both colonizing and non-colonizing) decreased. This has significant management implications: As time progressed, the risk of PVY transmission becomes more difficult to estimate, as the transmission efficiencies of the vector spe-cies have not been quantified. These results also
support the findings of DiFonzo et al. (1997) who found that non-colonizing aphid species, which typically have lower or undefined trans-mission efficiencies, have the greatest abun-dance. Ourfindings suggest that the abundance of undefined vector species may be driving late-season PVY spread in NY. These results empha-size the importance of further studies assessing the transmission efficiencies of a greater number of species, as well as evaluating vectors with dif-ferent capacities separately.
Prediction 3: Sites surrounded by greater amounts
of cropland will have higher proportions of
efficient PVY vectors in the aphid community
throughout the season
Our results suggest that the percent cropland did not have a significant effect on the proportion of efficient vectors. Landscape composition had no effect in the WI study region, and in NY, the same general trend held for all landscape treat-ments: The proportion of high-transmitting vec-tors decreased over the course of the season. This suggests that this facet of aphid community com-position does not drive higher PVY prevalence at more agriculturally intense research sites.
C
ONCLUSIONSand species richness in both study regions, and on functional community composition in NY. Our work shows that intra-annual variation, in interaction with landscape composition, is an important driver of local aphid communities and that spatiotemporal shifts in agroecosystems have significant implications for aphid functional community composition.
A
CKNOWLEDGMENTSThe authors would like to acknowledge the assis-tance of Jasmine Peters, Diana Eng, Marie Russell, Emily Nelson, and Mariah Slone in conducting these experiments. The authors also wish to acknowledge the assistance of Ms. Emily Duerr at the University of Wisconsin in generating the landscape compositions in ArcGIS for spatial analyses. The authors report no
conflicts of interest. Support was provided by a
Towards Sustainability Foundation graduate research grant, a NESARE graduate research grant, and a NSF-GRFP awarded to S.B.C., a USDA Hatch grant NYC-183449 and USDA NIFA grant 2013-67013-21235 awarded to A.G. P., and USDA Hatch grant NYC-139484 and USDA NIFA grant 2013-02649 awarded to J.S.T.
L
ITERATUREC
ITEDAdler, L. S., P. De Valpine, J. Harte, and J. Call. 2007. Effects of long-term experimental warming on
aphid density in the field. Journal of the Kansas
Entomological Society 80:156–168.
Banks, J. E. 1998. The scale of landscape fragmentation affects herbivore response to vegetation
hetero-geneity. Oecologia 117:239–246.
Barton, B. T., and A. R. Ives. 2014. Direct and indirect effects of warming on aphids, their predators, and
ant mutualists. Ecology 95:1479–1484.
Boiteau, G. 1990. Effect of trap color and size on
rela-tive efficiency of water-pan traps for sampling alate
aphids (Homoptera: Aphididae) on potato. Journal
of Economic Entomology 83:937–942.
Boquel, S., A. Ameline, and P. Giordanengo. 2011.
Assessing aphids potato virus Y transmission effi
-ciency: a new approach. Journal of Virological
Methods 178:63–67.
Braschler, B., G. Lampel, and B. Baur. 2003. Experimental small-scale grassland fragmentation
alters aphid population dynamics. Oikos 100:581–
591.
Cardinale, B. J., J. J. Weis, A. E. Forbes, K. J. Tilmon, and A. R. Ives. 2006. Biodiversity as both a cause and consequence of resource availability: a study
of reciprocal causality in a predator-prey system.
Journal of Animal Ecology 75:497–505.
Claflin, S. B., L. E. Jones, J. S. Thaler, and A. G. Power.
2016. Crop-dominated landscapes have higher vec-tor-borne plant virus prevalence. Journal of
Applied Ecology 54:1190–1198.
Cocu, N., R. Harrington, M. D. A. Rounsevell, S. P.
Worner, M. Hulle, and EXAMINE project
partici-pants. 2005. Geographical location, climate and
land use influences on the phenology and numbers
of the aphid,Myzus persicae, in Europe. Journal of
Biogeography 32:615–632.
Davis, T. S., J. T. Abatzoglou, N. A. Bosque-Perez, S.
Halbert, K. Pike, and S. D. Eigenbrode. 2014. Differing contributions of density dependence and climate to the population dynamics of three eruptive herbivores. Ecological Entomology 39:
566–577.
Debinski, D. M., and R. D. Holt. 2000. A survey and overview of habitat fragmentation experiments.
Conservation Biology 14:342–355.
Dedryver, C.-A., A. Le Ralec, and F. Fabre. 2010. The
conflicting relationships between aphids and men:
a review of aphid damage and control strategies.
Comptes Rendus Biologies 333:539–553.
DiFonzo, C. D., D. W. Ragsdale, E. B. Radcliffe, N. C. Gudmestad, and G. A. Secor. 1997. Seasonal abun-dance of aphid vectors of potato virus Y in the Red River Valley of Minnesota and North Dakota.
Jour-nal of Economic Entomology 90:824–830.
Gray, S., S. De Boer, J. Lorenzen, A. Karasev, J. Whit-worth, P. Nolte, R. Singh, A. Boucher, and H. Xu. 2010. Potato virus Y: an evolving concern for potato crops in the United States and Canada.
Plant Disease 94:1384–1397.
Grez, A. A., T. Zaviezo, S. Dıaz, B. Camousseigt, and
G. Cortes. 2008. Effects of habitat fragmentation on
the abundance and species richness of aphi-dophagous beetles and aphids in experimental alfalfa landscapes. European Journal of
Entomol-ogy 105:411–420.
Grez, A., T. Zaviezo, L. Tishcendorf, and L. Fahrig. 2004. A transient, positive effect of habitat frag-mentation on insect population densities.
Oecolo-gia 141:444–451.
Halbert, S. E., D. L. Corsini, and M. A. Wiebe. 2003.
Potato virus Y transmission efficiency for some
common aphids in Idaho. American Journal of
Potato Research 80:87–91.
Krauss, J., I. Gallenberger, and I. Steffan-Dewenter. 2011. Decreased functional diversity and biological control in conventional compared to organic crop
fields. PLoS ONE 6:e19502.
Ma, G., V. H. W. Rudolf, and C.-S. Ma. 2015. Extreme
relative fitness, and community structure. Global
Change Biology 21:1794–1808.
Margosian, M. L., K. A. Garrett, J. M. S. Hutchinson, and K. A. With. 2009. Connectivity of the Ameri-can agricultural landscape: assessing the national risk of crop pest and disease spread. BioScience
59:141–151.
Matis, T. I., M. N. Parajulee, J. H. Matis, and R. B. Shrestha. 2008. A mechanistic model based analy-sis of cotton aphid population dynamics data.
Agricultural and Forest Entomology 10:355–362.
Mello, A. F. S., R. A. Olarte, S. M. Gray, and K. L. Perry.
2011. Transmission efficiency of potato virus Y
strains PVYO and PVYN-Wi by five aphid species.
Plant Disease 95:1279–1283.
Narayandas, G. K., and A. V. Alyokhin. 2006. Inter-plant movement of potato aphid (Homoptera: Aphididae) in response to environmental stimuli.
Environmental Entomology 35:733–739.
O’Rourke, M. E., K. Rienzo-Stack, and A. G. Power. 2011. A multi-scale, landscape approach to predict-ing insect populations in agroecosystems.
Ecologi-cal Applications 21:1782–1791.
Pelletier, Y., X. Nie, M.-A. Gigere, U. Nanayakkara, E.
Maw, and R. Foottit. 2012. A new approach for the
identification of aphid vectors (Hemiptera:
Aphidi-dae) of potato virus Y. Journal of Economic
Ento-mology 105:1909–1914.
Pike, K. S., L. L. Boydston, and D. W. Allison. 2003. Aphids of Western North America North of Mexico. Washington State University Extension, Pullman, Washington, USA.
Thies, C., I. Steffan-Dewenter, and T. Tscharntke. 2008.
Interannual landscape changes influence
plant-herbivore-parasitoid interactions. Agriculture,
Ecosystems, and Environment 125:266–268.
Torma, A., R. Galle, and M. Bozso. 2014. Effects of habi-
tat and landscape characteristics on the arthropod assemblages (Aranea, Orthoptera, Heteroptera) of sand grassland remnants in Southern Hungary.
Agri-culture, Ecosystems, and Environment 196:42–50.
Tscharntke, T., et al. 2012. Landscape moderation of
biodiversity patterns and processes – eight
hypotheses. Biological Reviews 87:661–682.
Tylianakis, J. M., T. Tsharntke, and O. T. Lewis. 2007.
Habitat modification alters the structure of
tropical host-parasitoid food webs. Nature 445:
202–205.
Verbeek, M., P. G. M. Piron, A. M. Dullemans, C. Cuperus, and R. A. A. van der Vlugt. 2010.
Deter-mination of aphid transmission efficiencies for N,
NTN, and Wilga strains of potato virus Y. Annals
of Applied Biology 156:30–49.
Vialatte, A., J. C. Simon, C. A. Dedryver, F. Fabre, and M. Plantegenest. 2006. Tracing individual move-ment of aphids reveals preferential routes of popu-lation transfers in agroecosystems. Ecological
Applications 16:839–844.
Weibull, A.-C., andO.€ Ostman. 2003. Species composi-€
tion in agroecosystems: the effect of landscape, habitat, and farm management. Basic and Applied
Ecology 4:349–361.
Woodcock, B. A., C. Harrower, J. Redhead, M. Edwards, A. J. Vanbergen, M. S. Heard, D. B. Roy, and R. F. Pywell. 2014. National patterns of functional diver-sity and redundancy in predatory ground beetles and bees associated with key UK arable crops.
Journal of Applied Ecology 51:142–151.
Zhao, Z.-H., C. Hui, D.-H. He, and B.-L. Li. 2015.
Effects of agricultural intensification on ability of
natural enemies to control aphids. Scientific
Reports 5:1–7.