Selection and classification of gene
expression in autism disorder: Use of a
combination of statistical filters and a
GBPSO-SVM algorithm
Shilan S. Hameed1,2, Rohayanti Hassan3, Fahmi F. Muhammad4*
1 Department of Computer Science, Faculty of Computing, Universiti Teknologi Malaysia, Johor Bahru,
Malaysia, 2 Department of Software and Informatics Engineering, College of Engineering, Salahaddin University, Erbil, Kurdistan Region, Iraq, 3 Department of Software Engineering, Faculty of Computing, Universiti Teknologi Malaysia, Johor Bahru, Malaysia, 4 Department of Physics, Faculty of Science & Health, Koya University, Koya, Kurdistan Region, Iraq
Abstract
In this work, gene expression in autism spectrum disorder (ASD) is analyzed with the goal of selecting the most attributed genes and performing classification. The objective was achieved by utilizing a combination of various statistical filters and a wrapper-based geomet-ric binary particle swarm optimization-support vector machine (GBPSO-SVM) algorithm. The utilization of different filters was accentuated by incorporating a mean and median ratio criterion to remove very similar genes. The results showed that the most discriminative genes that were identified in the first and last selection steps included the presence of a repetitive gene (CAPS2), which was assigned as the gene most highly related to ASD risk. The merged gene subset that was selected by the GBPSO-SVM algorithm was able to enhance the classification accuracy.
Introduction
Autism spectrum disorder (ASD) is a neurodevelopmental disorder that is defined by weak-ened social interactions, impaired verbal and non-verbal communication and repetitive actions [1,2]. ASD affects more than 1% of the population, and males are four times more vul-nerable to the disorder than females [3]. Although environmental factors are believed to con-tribute to autism, researchers believe that genetic factors play a major role in the occurrence of the disorder [4]. In a study of twins, the presence of high similarity in the features of autistic twins was noticed [5]. It was observed that the genetic similarity among identical twins who are from the same developmental environment and have the same parental chromosomes is high. In these contexts, biologists have attempted to identify the most relevant genes that can be utilized as biomarkers for tracing the disorder. The attribution of a role of specific genes in the development of autism enables us to understand the mechanism of development of the dis-order and hence predict its serious consequences. To date, there is a lack of treatment for the a1111111111 a1111111111 a1111111111 a1111111111 a1111111111 OPEN ACCESS
Citation: Hameed SS, Hassan R, Muhammad FF
(2017) Selection and classification of gene expression in autism disorder: Use of a
combination of statistical filters and a GBPSO-SVM algorithm. PLoS ONE 12(11): e0187371.https:// doi.org/10.1371/journal.pone.0187371
Editor: Bin Liu, Harbin Institute of Technology
Shenzhen Graduate School, CHINA
Received: July 23, 2017
Accepted: October 18, 2017
Published: November 2, 2017
Copyright:©2017 Hameed et al. This is an open access article distributed under the terms of the Creative Commons Attribution License, which permits unrestricted use, distribution, and reproduction in any medium, provided the original author and source are credited.
Data Availability Statement: All relevant data are
within the paper and its Supporting Information files.
Funding: This work was financially supported in
part by the UTM Research University Grant Scheme (Vot number 11H84) and in part by Koya University.
Competing interests: The authors have declared
major symptoms of autism, and no accurate biomarkers have been identified because the etiol-ogy of autism is not clearly known [6]. Although approximately 70% to 90% of cases of autism are thought to be related to heritable causes, the variable phenotype of the disease and the com-plex architecture of its genetics have made it difficult to identify specific genes that are associ-ated with susceptibility to autism [7]. It has been claimed that the aggregate action of multiple genes is necessary to produce autism disorder, a feature that adds complexity to genomic investigations [8]. The pioneer work of Gregget al. [9], which was based upon genomic profil-ing of whole blood, revealed differences in gene expression in autistic and healthy children. Moreover, these authors observed variations in gene expression at the early onset stage of the disease in individuals with different subtypes of autism such as autism with regression and autism without regression. Because of these variations, the identification of genes related to autism presents a difficult problem. It is quite reasonable to use gene expression data to relate the phenotypes of diseases to their attributed biomarkers [10].
Computer models can be used to study autism through the use of microarray gene expres-sion data. A microarray is a tool that is used to estimate whether mutations in specific genes are present in a particular individual. The most common type of microarray is utilized to mea-sure gene expression; in this type of microarray, the expression values of thousands of genes are calculated from the microarray sample [11]. Along this line, the techniques of machine learning and data mining are considered effective tools in the application of genomic medi-cine, which uses computational methods and genomic datasets to predict phenotypes [12]. Machine learning is valuable in the interpretation of large datasets of genomic data, and it has also been successfully utilized to annotate the wide diversity of elements in genomic sequences [13]. Genome sequence analysis has also received considerable attention. In recent years, very useful computational tools were proposed in an open-source Python package designed to for-mulate comprehensive built-in and user-defined features for DNA, RNA and protein
sequences; these are known as representations of DNA (repDNA) [14], repRNA [15] and Pse-in-One [16], respectively. The repDNA tool was used to develop powerful computational pre-dictors for use in identifying the biological features or attributes of DNAs by generating widely used features that reflect the physicochemical properties and sequence-order effects of DNAs and nucleotides [14]. This model includes three groups of features that can be used for differ-ent analysis purposes. In regard to RNA analysis, a new repRNA was developed to meet the increasing demands and to speed up the genome analyses [15]. The features of this model can be represented by 11 different modes of feature vectors, thereby exceeding the limitations of existing machine-learning methods such as SVM and KNN that use only vectors and not sequences. Pse-in-one [16] was proposed as an effective tool that can handle the analysis of more than one type of sample; however, it is utilization is maximized to work on DNA, RNA and protein as well. The feature vectors of Pse-in-one can be easily combined with machine-learning algorithms for use in developing computational predictors and analysis methods for various tasks in bioinformatics and systems biology. Furthermore, studies in the field of cancer informatics have shown an interesting contribution of data mining and machine learning to finding related genes [17–19]. However, gene expression in autism displays some specific char-acteristics that make gene selection, model creation and prediction more challenging than gene expression analysis of cancers.
may be linked to the presence of alterations in many genes. Another reason for this difficulty is the limited number of observations (in the range of hundreds) that have been made in com-parison to the very large number of genes (in the range of tens of thousands). In machine learning, this feature is known as high dimensionality, and sophisticated methods are required to handle it. High dimensionality also exists in genome sequence analysis data, where it poses computational challenges despite the important contribution of high-throughput sequencing technology, which greatly increases the amount of available data for discriminative motif dis-covery (DMD) [23,24]. DMD methods usually have to sacrifice accuracy and may fail to fully leverage the potential of large datasets. Hence, researchers have proposed the large margin motif optimizer (LMMO) [23] for refining regulatory motifs and a novel approach referred to as discriminative motif learning via AUC (DiscMLA) to identify motifs in high-throughput datasets [24]. To further reduce computational time, some researchers have combined the pro-posed models with various techniques for improving the scalability of large-margin type algo-rithms and to accelerate DiscMLA.
The foregoing shows that it is not an easy or a straightforward task to find the attributed genes of autism unless a careful analysis and investigation is made of the microarray dataset. Gene selection methods are classified into two main types: filter-based methods and wrapper-based methods [21,25]. Because filter-based methods usually work without using a classifier, they are efficient with respect to computational time. They are preferable for use in analyzing the high-dimensional data of microarray datasets [26]. The drawback of filter-based methods is that the selected features may not have relationships to each other, and the appearance of redundant features is possible. This may decrease the accuracy of the classifier when the gene selection results are directly applied to the learning algorithm [21]. For this reason, the best choice is to use filters in the first selection process and to apply another feature selection approach that depends on classifier accuracy to choose the attributed genes in later steps. Wrappers tend to perform better in selecting discriminative genes since they take the model hypothesis into account by training and testing in the gene space [21]. When dealing with high-dimensional data such as microarray datasets, wrapper-based methods tend to be the worst choice if applied to the data directly without any preprocessing because this leads to overfitting [27]. This is because the wrapper acts by searching and comparing the performance of each gene subset with the classification algorithm prior to estimating the best subset of genes [28]. However, if wrappers are used after the application of filter methods, they require less computational time and hence work more efficiently [29]. Conventional wrappers use search algorithms to find subsets of genes through adding or removing the best features to the space based on the fitness criteria [30]. Hence, the problems of large-scale feature selection are not efficiently solved by using conventional optimization algorithms [31]. Therefore, to address the feature selection problems effectively, meta-heuristic algorithms are being adopted. There are various meta-heuristic algorithms that can be used to address feature selection issues; these include the genetic algorithm (GA) [32], ant colony optimization [33], simulated annealing [34], and particle swarm optimization (PSO) [35]. PSO and GA are two common evolutionary algorithms that are usually applied in the form of wrapper methods [31,36]. Comparably, PSO is efficient and simple; only a few parameters are required to perform its adjustment, and hence it is a memory-enabled algorithm. Binary PSO is a modified version of the standard PSO introduced by Kennedy and Eberhart [37] to handle variables with discrete design. BPSO was shown to outperform GA when used for feature selection using the same fit-ness function [38]. In another study [39], BPSO was used in feature selection such that the fit-ness function was designed based on the rough set. BPSO was also applied to various
(gbDPSO), was adopted to find the global optimal solution for a high-dimensional grid system; in this way, a reduction in the minimum computation time and an energy improvement of up to 28% were achieved [42]. Recently, a new modified version of PSO known as geometric PSO (GPSO) was proposed by Moraglioet al. [43] and utilized for gene selection in cancer classifi-cation by Albaet al. [36]. In the current work, a combination of statistical filters and wrapper algorithms incorporating GBPSO is employed for gene selection and classification in autism disorder. This is achieved through the application of various filters in parallel with a GBPSO wrapper and a support vector machine (SVM) classifier (GBPSO-SVM algorithm). Prior to the selection process, specific pre-processing operations are performed on the dataset in a creative way to remove the most similar genes. The presented results were found to improve the accu-racy of gene classification in autism disorder.
Materials and methods
Experimental overview
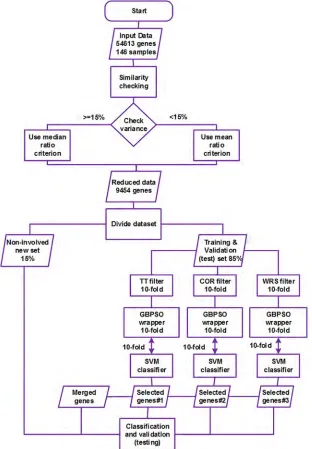
The experimental procedure of the current work was implemented in three basic steps; these are briefly described below, and the details of each step are given in the following subsections.
First step: in this stage, the whole dataset was checked for the similarity of gene expression in the control and autism classes. Genes with mean or median ratios close to unity (equal to or greater than 0.95) were removed; in this way, the number of genes in the dataset was reduced from 54,613 to 9454.
Second step: in this stage, the reduced dataset was divided into two parts, 85% of which was used in the process of model training and validation (testing); the 15% non-involved set was set aside to be used as a new real-world dataset against the gene classification based on the pre-defined model. Later on, three filters, namely, the t-test (TT), feature correlation (COR) and the Wilcoxon Rank Sum test (WRS), were initially applied in parallel to select the 200 most dis-criminative genes using a 10-fold run evaluation.
Third step: in this stage, the final most discriminative subsets of genes were selected by the GBPSO-SVM algorithm, and classification was performed based on the resulting genes. Fur-thermore, a merged set of genes was generated from the combination of these three final sub-sets based on their frequencies of appearance in the 10-fold selection process. Consequently, the selected genes were used in training and validation performed with the SVM classifier in the 10-fold cross-validation scheme. Finally, the non-involved dataset mentioned in step two was used as a new real-world dataset to further test and generalize the applied model. The complete methodology of the current work is illustrated inFig 1, and the implementation steps of the codes are given in (https://github.com/fahmi982/Implementation-Steps).
Autism dataset
forms of autism, regression and Asperger’s syndrome were not included in the dataset. Each sample was subjected to normal high-resolution chromosome analysis and had a negative result on the Fragile X DNA test.
Pre-selection operations
High variance is one of the most apparent problems in the autism gene expression dataset used in this study; the high variance may be due to the nature of the data [46]. Moreover, the fact that the high-dimensional data in this set consisted of 54,613 genes and only 146 samples emphasizes the existence of similar expression of autism-related and non-autism-related
Fig 1. Experimental setup used to select autism-related genes and to perform classification.
genes. Statistical theories [47] indicate that the genes that show similar expression in both sets of individuals are not useful and that they do not include the discriminant genes. For this rea-son, removing very similar genes facilitates the subsequent steps in the proposed method, espe-cially the steps involving feature selection. This is because the presence of similar genes, particularly those with high variance, affects the mean and median values for the expression of individual genes, thereby affecting the next filter steps. In a previous study [48], the ratio of the mean was used as a basis for removing similar genes. It has been proven that when there are outliers in the features, the application of the median criterion is a better choice than the appli-cation of the mean criterion since the mean values of gene expression are affected by the vari-ance. However, the median is not a strong statistical criterion to depend on throughout the experiments, and it is not popular. Therefore, in this study, a new approach was taken in which genes whose expression showed very high variance were identified among the genes in each class. Since high variance leads to mean values that do not reliably present the population, it creates a non-desirable result with respect to feature selection. To avoid this problem and to facilitate the next steps in the analysis, in this study the mean and median ratios are applied in different contexts. The ratio of the mean values is used in the case of genes whose expression values do not show high variance within the class, whereas for genes with high variance within the class the ratio of the median values is applied. This strategy is used in a creative way to overcome the problems associated with the variance of the dataset. In this approach, the fea-tures in each class are divided into two groups according to their variance. A set of high-vari-ance features (varihigh-vari-ance>15%) are separated from those with low variance (variance =<15%). The median ratio criterion is then applied to the high- variance group, and the mean ratio cri-terion is used for the rest. This is performed similarly for both classes of observations. The next step in the analysis reduces the high-dimensional features of the dataset by removing genes that have quite similar medians in both classes as well as those that have quite similar means in both classes. In this step, features for which the median and mean ratios for both classes are between 0.95 and 1/0.95 are removed from the dataset. This threshold range is chosen inten-tionally to remove the non-significant genes from the whole dataset as well as to reduce the effect of high-variance genes, hence making the next steps of the analysis smoother. By follow-ing this procedure, the number of genes in the dataset is significantly reduced.
Selection using statistical filters
case study. Moreover, utilization of the whole dataset for feature selection produces a biased result that does not demonstrate the real ability of the model during the test phase. Therefore, the statistical filtering was repeated in 10-fold runs on the trained dataset. In each method, the positions of the filtered genes in all the runs were compared based on their position weights. Next, the weight values were summed, and the genes were ordered from most attributed to least attributed according to the final ranks achieved within the 10-fold runs. The equation used in this calculation is a global weight equation that is given by
wðfÞ ¼ XK
i¼1wiðfÞ ð1Þ
where eachiinK= the number of current fold iterations in the whole 10-fold run. The first applied filter was the t-test, which is a univariate filter feature selection that is often employed in binary class applications [50,51]. The common assumption of the t-test is that the values for the two compared groups of genes are normally distributed. The null hypothesis of the t-test assumes equal means and equal variances, and the alternative hypothe-sis rejects this assumption. The equation of the t-test is
t ¼ c1 c2 ffiffiffiffiffiffiffiffiffiffiffiffiffiffiffi
s12
n þ
s22 m
q ð2Þ
wherenandmdenote the population sizes of the first and second classes, respectively. The result of the assessment callst, which is equal to 1 or 0; 1 represents the rejection of the null hypothesis at the 5% significance level and 0 denotes the acceptance of the null hypothesis at the same significance level. The p-value is also returned by the test; a small value ofp indi-cates a significant difference among the compared samples. For the autism dataset, a normal distribution of the expressed genes is not guaranteed due to the presence of outliers. There-fore, the non-parametric version of the t-test was considered in MATLAB programming by assuming unequal variances in the two classes. This method was adopted to provide a more accurate measurement. The t-test has long been used in the application of microarray feature selection [50]. It has powerful scalability when the number of features is high [51]. Some studies used filters such as the t-test as the only feature selection step followed by direct application of the classification algorithms [52,53]. In the current work, the t-test is used as a filter followed by wrapper-based gene selection; after this, the classification algorithm is applied.
The second applied filter method was feature correlation with class (COR), a univariate fil-ter feature selection method that can be used as a pre-selection step in microarray gene selec-tion [54,55]. The value of feature discrimination,S(f), is expressed by
S fð Þ ¼
PK
k¼1Pkðck cÞ 2
s2ðfÞPK
k¼1Pkð1 PkÞ
ð3Þ
wherecis the mean value for the gene among both classes,ckis the mean value for thekth class gene,σ2(f) is the gene variance, andPkis the probability of appearance of thekthclass in the dataset. A high value ofS(f)represents good discrimination capability of featurefin dis-tinguishing a particular class from other K classes. Here, the number of classes is two, so K = 2.
Mann-Whitney test [57,58]. To distinguish between the two classes, the criterion used by this test is based on the median value. The test compares the medians of the samples and produces the result as a ranking instead of as numerical values [59]. By arranging the results in ascending order, the rank and the index value of the arrangement are determined. The WRS test consid-ers as the null hypothesis the hypothesis that all genes originate from one class. The statistical formula of the Wilcoxon rank sum is as follows [60]:
sðgÞ ¼ X
i2N0 X
j2N1I
ððxðjgÞ x
ðgÞ
i ÞÞ 0 ð4Þ
whereIis the function used to distinguish the classes. If the logical expressionðxðjgÞ x
ðgÞ
i Þ 0 is true,Iis 1; otherwise, it is 0.xðigÞis the expression value of genegin sampleI,N0andN1 rep-resent the number of observations in each of the two classes, respectively, ands(g)denotes the difference in the expression of the gene in the two classes. Based on whethers(g)becomes 0 or reaches the maximum ofN0× N1, the considered gene is ranked in importance in the classifi-cation process. The following equation is used to calculate the gene’s importance:
qðgÞ ¼ maxðsðgÞ; NoN1 sðgÞÞ ð5Þ
This method was used in the literature for the pre-selection of genes [60,61], and it was shown to produce a powerful statistical result, especially when the data are severely skewed and approximately symmetric [62]. Usually, at the end of the analysis, WRS will give the rank of the genes, beginning with the most discriminative genes and proceeding to the less discrimi-native ones.
Selection using a wrapper-based GBPSO-SVM algorithm
The last step in the selection of discriminative genes was conducted using geometric binary particle swarm optimization (GBPSO) in wrapper form with the support vector machines (SVM) algorithm; in this method, the GBPSO uses the accuracy prediction of the SVM to choose the best subset of genes. GBPSO begins with a random number of selected genes and searches for the optimal subset of genes in each iteration. The SVM classifier is used to evaluate the performance of each candidate subset using 10-fold cross-validation. The GBPSO algo-rithm leads to the selection of an optimal subset of genes that provides the best classification accuracy. Furthermore, it chooses the most discriminative genes to contribute to the next gen-eration of gene subsets. Thus, each new candidate subset of genes is usually better than the pre-vious subset.
Vi= [vi1,vi2,. . .;viD]. It is also considered that the visited position that produces the best fitness value for the particle isPBi= [pbi1,pbi2,. . .;pbiD], while the best explored position so far is GB=[gb1,gb2,. . .;gbD]. Thus, each particle’s velocity is updated based on the following equa-tion:
vnew id ¼ w:v
old
id þc1:rand1ð. . .Þ ðpbest old
id x
old
idÞ þc2:rand2ð. . .Þ ðgbest old
id x
old
idÞ ð6Þ
whered = 1,2. . .,D,c1is the cognitive learning factor andc2is the social learning factor. The inertia weight (w) acts to reduce the particle’s velocity in steps and hence controls the swarms. Thewvalue is usually between 0.4 and 0.9, whereas the random variablesrand1andrand2 have values that are uniformly distributed between 0 and 1 [35].
Consequently, the particles’ velocities are bounded within the range [vmin,vmax]. These bounds maintain the vector function of the velocity to avoid very abrupt movements of parti-cles in the search space. The formula that is used to update the particle’s position is
xnew
id ¼ x
old id þv
new
id ð7Þ
whered= 1, 2,. . ..D,i= 1, 2,. . ...N, andNis the size of the swarm.
Binary PSO (BPSO) is a modified version of standard PSO that was developed to handle variables with discrete design [37], whereas the original PSO was proposed for continuous var-iables. When BPSO is used for gene selection, a gene subset is expressed by a string vector ofn binary bitsXi= (x1,x2,. . .xn) comprising ‘0’ and ‘1’. Consequently, ifxidis ‘0’, then thedthgene is not selected in this subset, and anxidof ‘1’ is alternatively chosen in the subset. In this regard, each binary string vector (Xi) defines the particle’s position in BPSO. For instance, a particle with seven genes is encoded as ‘0100010’, implying that the second and sixth genes are selected. Therefore, the length of each particle is initially the same as the number of genes in the dataset.
The population of particles is randomly initialized. However, it is effective to initialize the particles in such a way as to produce better selection results. In the geometric version of BPSO, the particle’s current position, itspbestand itsgbestare used as the three parents in a three-par-ent mask-based crossover operator (3PMBCX) to create a new position for the particle instead of using velocity. The equation for position updating is as follows [36,43]:
xnew
id ¼ w1:x old
id þw2:pbest old
id þw3:gbest old
id ð8Þ
where, for each element in the crossover mask,w1,w2andw3indicate the weight values associ-ated with each parent represented byxold
id;pbestoldid andgbestoldid, respectively. A condition is that the
Fig 2. Illustration of the PSO principle.
geometric crossover forcesw1,w2andw3must be non-negative and must sum to one. In addi-tion, an operator with a probability value of 0.01 is added to take care of bit-flip. This is to avoid early convergence. The advantage of this version of GBPSO is that it enables the general-ization of PSO to virtually any solution representation in a natural and straightforward way [36]. The key issue of the GBPSO is the concept of particle movement. In this approach, instead of the notion of velocity added to the position, a three-parent mask-based crossover (3PMBCX) operator is applied to each particle to move it. According to the definition of 3PMBCX [43], given three parents a, b and c in {0, 1}n, a random crossover mask of lengthn with symbols from the alphabet {a, b, c} is generated. The offspring filling each element with the bit from the parent appearing in the crossover mask at the position is then built. The detailed parameters of the GBPSO model are illustrated inTable 1.
In the current work, GBPSO is used as a wrapper feature selection method with a support vector machine (SVM). The support vector machine (SVM) algorithm is used because it is able to provide reasonable classification accuracy for high-dimensional data despite the avail-ability of limited training samples.
Support vector machines are a group of supervised machine-learning methods known as a support vector network; they were developed by Vapnik [64]. The forms of this algorithm are widely applied in a variety of real-world problem domains [18,36,63], especially for gene clas-sification of diseases [65–67]. Furthermore, the LIBSVM algorithm, which is a type of software for SVM classification and regression, was utilized by Liu et al. [68] for effective identification of human pre-microRNAs and hence to discriminate real pre-miRNAs from false ones. More-over, SVM can perform both linear and nonlinear separable data classification. In the linear case, the boundary of linear decision is performed such that the smallest distance between the training samples and the boundary (margin) is maximized. The training data samples near the class boundary and along the hyperplanes are known as support vectors [18]. Nonlinear data can be handled by SVM upon mapping the gene space of low dimensionality extracted from the input space into a gene space of high dimensionality to achieve efficient classification. A cost is involved to consider the wrongly classified examples if there are linearly inseparable mapped data points, while the margin is maximized along with minimization of the cost [66]. Another property of SVM is that the number of coefficients to be determined is essentially dependent on the number of samples rather than on the number of genes. This is a useful char-acteristic of SVM for microarray data due to the presence of a low ratio of samples to genes in this type of dataset. However, it has been shown that decreasing the number of genes increases SVM performance [36,69]. To utilize SVM as a classification algorithm in gene expression and sequence datasets, kernel functions are usually used. This allows the user to obtain an orthogonal hyperplane to distinguish the genes in a specific dimension. A number of research works have used SVM for gene selection or classification or both using different types of ker-nels [36,70,71]. This is because each type of kernel is suitable for different data. However, because it is not initially known which kernel is best for a specific set of data, it may be neces-sary to test multiple SVM types. Liu et al. [72] employed LIBSVM in a python package for DNA/RNA and protein/peptide sequence analysis based on pseudo components and kernel methods. In their studies, the kernel function of the radial basis function (RBF) was used to
Table 1. Detailed parameters of the GBPSO model.
Individual weight Inertia weight Social weight
3PMBCX parameters 0.34 0.33 0.33
Mutation probability 0.01
train the SVM classifier; in the current study, the polynomial kernel is applied owing to its higher classification accuracy for our dataset. Following further optimization of the kernel parameters, the identification of DNA-binding proteins by incorporating amino acid distance-pairs and reduced alphabet profile into the general pseudo amino acid composition upon a new predictor (iDNA-Prot|dis) outperformed the existing predictors for the same purpose [73]. Liu et al. also reported that each kernel contains different discriminative information and that combining the kernels automatically is, therefore, a promising way to improve the perfor-mance of the model. Consequently, the combination of sequence-based kernels with evolu-tionary information extracted from frequency profiles, in which three top-performing
Fig 3. Application of GBPSO-SVM in gene selection.
https://doi.org/10.1371/journal.pone.0187371.g003
Fig 4. Expression of a representative gene in samples from control and autistic individuals.
sequence-based kernels (SVM-Ngram, SVM-pairwise and SVM-LA) were combined with the profile-based protein representation, was proposed to predict protein remote homology [74]. In this study, SVM was applied using the polynomial kernel because this kernel method showed the highest classification accuracy.
The fitness function in GBPSO is used as an evaluator to select the best subsets of features, which are constructed based on the accuracy so far obtained by the SVM classifier. The parti-cles having the best fitness values are recorded to maintain the optimal solution for a given population. This defines the best subset of genes and gives better accuracy. This is applied in 10-fold cross-validation such that the entire training set can be used in the process of finding the best genes.Fig 3shows the operation principle of the GBPSO-SVM method, in which the genes are expressed from the dataset and the best subset of genes is selected. The PSO particles are represented by vectors of bits, where each bit corresponds to a specific gene. A gene is retained in the subset if it holds an encode value of 1 and is not included in the subset if it holds an encode value of 0. Hence, the number of genes in the dataset determines the length of each particle.
Results and discussion
Dataset reduction
Despite the presence of a high-dimensional dataset from autistic individuals, most of the fea-tures appeared as outliers, indicating that the gene expression values in the observations are
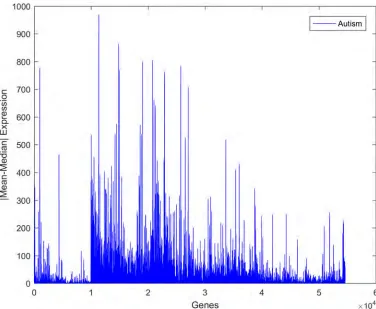
Fig 5. Absolute values of the differences between the mean and median values of gene expression for the autism observations.
highly varied. It was noted that the gene expression values of both classes exhibited a high vari-ance, as shown inFig 4. The deviation of the expression value of a gene from its mean value is statistically explained in terms of variance. It is certainly true that not every single gene is responsible for autism disorder or can be used as a discriminative biomarker. Therefore, to identify the attributed genes, the genes with similar mean values in the two datasets, i.e., those with mean ratios close to unity, should be removed. However, this approach does not yield an accurate result if it is directly applied to the current dataset. This is because several genes show high variance among both classes. Consequently, the utilization of the mean ratio criterion alone to remove the genes unrelated to autism from the two classes does not provide a reliable result. It was reported that due to the high variance in the expression of genes related to autism, the median ratio can be considered as an alternative to the mean ratio for removing similar genes [70]. Again, using the median ratio only is not a reliable approach since genes with low variance will be negatively affected under this reduction process.
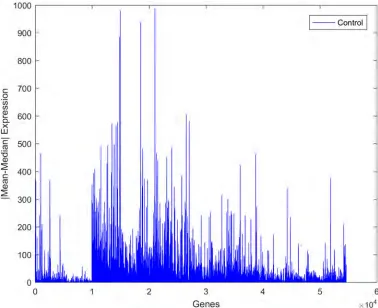
The absolute value of the difference between the mean and the median of the expression of individual genes was measured to determine the strength of outliers, as shown in Figs5and6. It was seen that this variation is larger in the autism group than in the control group, implying that there are some alterations in the gene expression values in the autistic group. Upon close inspection of the figures, it is clear that this variance is not associated with only one gene or with a small group of genes but with a wide range of genes. This can be regarded as another confirmation of the fact that autism is a spectrum disorder and that several genes may contrib-ute to the occurrence of the disorder.
Fig 6. Absolute values of the differences between the mean and median values of gene expression for the control observations.
It is seen that genes with high variance are more tolerated when the median ratio is applied, and vice versa. Therefore, to remove the most similar genes and to reduce the dataset, an alter-native strategy was followed in this work. This strategy relied on the fact that genes with high variance in expression can be treated according to the median ratio criterion, whereas those with low variance can be treated according to the mean ratio criterion. In this way, among the genes that present variance of 15% and higher, the median ratio was applied to remove similar genes, and for genes with a variance of 15% or smaller the mean ratio was applied. Hence, genes with median ratios or mean ratios of 0.95 or greater were removed from both classes, as illustrated inFig 7. Based on this removal process, the number of genes was reduced from 54,613 to 9454. The reduced dataset that was obtained at this stage is provided in the supple-mentary information as theS1 Dataset. It will be shown later that this reduction process improves the accuracy of the SVM classifier at threshold ratio of 0.95. In other studies [48,70],
Fig 7. Illustration of the discriminative regions and removal of similarly expressed genes from both classes of observations.
https://doi.org/10.1371/journal.pone.0187371.g007
Table 2. Similarity percentages for sets of 200 discriminative genes selected by various filtering methods.
Filtering method TT COR WRS
TT 100 93 69
COR 93 100 69
WRS 69 69 100
a mean or median ratio threshold of 0.96 was used separately to reduce the dataset to 17,831 or 16,230 genes. In yet another study, a mean ratio of 0.98 was applied as a threshold to reduce the dataset to 16,230 [32]. In comparison, our reduced dataset of 9454 genes could help improve classification accuracy and reduce memory complexity.
First stage of selection
The reduced dataset resulting from the reduction step is not satisfactory for direct application in the classification process or as a basis for building the model since, with 9454 genes, its dimensionality is still high, and not all of the genes are discriminant. Hence, further reduction is conducted using the three filtering methods TT, COR and WRS in parallel to select the most discriminative genes. It was observed that each filtering method identifies different sets of genes with a specific repetition of the discriminative genes among them (seeS2–S4Datasets). This is due to the high variance of several genes in the samples from individuals with autism disorder, indicating the necessity of using further selection steps. In this stage, the 200 most discriminative genes were selected based on their rank positions in descending order.Table 2
shows the percentage of similar genes that were selected by each method. The greatest similar-ity (93%) between the sets of 200 selected genes occurred between TT and COR, whereas WRS showed 69% similar genes with both TT and COR. It is noteworthy that the repetitive genes that appeared in the three filtered sets were not assigned the same ranking positions. The three discriminative genes that were assigned the highest rankings among 30 sets of filtered genes, i.e., within a 10-fold run for each filter, were ZSCAN18, CFC1B and CAPS2.
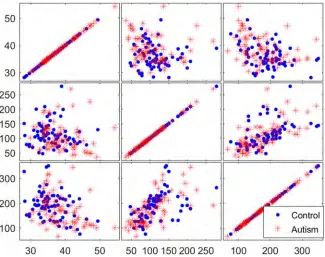
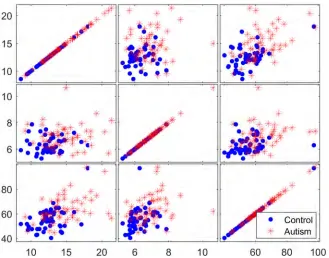
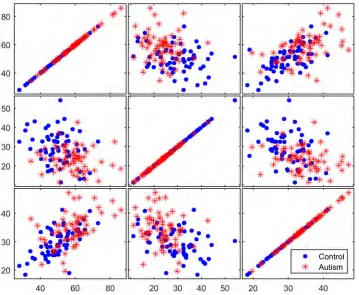
To determine the discriminative ability of the genes identified in the filtration process, three selected genes were examined using matrix scatter plots. Figs8–10show a qualitative
Fig 8. Matrix plots for three representative selected genes from the reduced dataset before the application of filter methods.
assessment of the genes obtained from the initial reduced dataset (before using filters) and of the genes obtained using the TT and COR filters, respectively. The significant impact of the filtration process on the selection of attributed genes, in which the expression values of the autism-related genes are clustered apart from those of the non-autism-related genes, is readily apparent in Figs9and10. However, no such clustering occurs in the matrix plot of the genes extracted from the non-filtered dataset; in that plot, the expressed genes are uniformly distrib-uted in the whole space without any pronounced clustering between the two classes of observation.
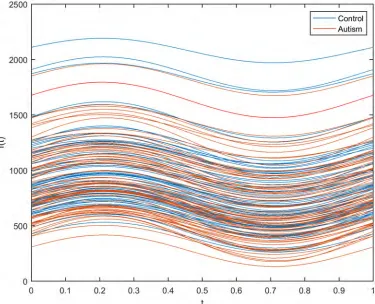
Another method of estimating the impact of filtration on the selection of discriminative genes in autism disorder used an Andrews plot. Figs11and12show Andrews plots for three genes selected from the initial reduced dataset (before using filters) and the dataset obtained using the WRS filter, respectively. InFig 11, the gene expression for the non-filtered dataset appears as a wide bundle with no distinguishable separation between the two classes. It is worth noting that the filtration process narrowed and aggregated the expression bundle of the filtered genes, as shown inFig 12, in which the autistic class of genes is separable from the non-autistic class.
Classifier assignment
One of the most important tasks in conducting gene expression analysis using machine-learn-ing algorithms is the buildmachine-learn-ing of a classification model that recognizes the discriminative genes with the highest possible accuracy. However, not every classifier works effectively on all data-sets. For each dataset, a unique classifier or a limited number of classifiers typically work best. To explore this, the discriminative genes identified using different filtration methods were
Fig 9. Matrix plots for three representative selected genes from the 200 genes filtered by the TT method.
analyzed using six different classifiers, and the performance of each classifier was noted.
Table 3shows the accuracy of each classifier; of the tested classifiers, SVM had the highest accuracy.
Based on the classification results, SVM was chosen as the ultimate classifier to be com-bined with the GBPSO algorithm in wrapper form to perform the final stage of the gene selection and classification process, as will be discussed later. Further analysis was also conducted to elucidate the impact of dataset reduction on the accuracy of the SVM classi-fier. The details of this analysis are provided inTable 4. It was observed that the utilization of a combined mean and median ratio as a reduction criterion to remove the most similar genes results in remarkable improvement in the classifier accuracy. Furthermore, this com-bination was found to outperform the results obtained using the mean ratio or the median ratio alone. Using this method, the initial selection results showed better classification accu-racy and less computational complexity, and the dimensionality of the dataset was reduced from 54,613 genes to 9454 genes. As such, the best classification accuracy of the SVM for the TT filtered genes in this stage was found to be 86.3%, higher than the values previously reported (of about 86.1% and 78.4%) for fused genes of eight filter methods [32,48]. The improvement in the accuracy of the SVM classifier is attributed to the impact of the thresh-old value of mean and median ratio that is defined and used to remove the most similar genes.
Fig 10. Matrix plots for three representative selected genes from the 200 genes filtered by the COR method.
Final stage of selection and classification
The last step of gene selection was conducted using the GBPSO optimization algorithm wrapped with the SVM classifier; in this step, those particles (gene subsets) having the best val-ues of fitness were recorded to maintain a better solution at given population. As such, the best subset of genes that provided the highest classification accuracy was identified and returned.
Table 5shows the classification accuracy (10-fold cross-validation) as well as the prediction accuracy for the new dataset using the model. Gene subsets #1, #2 and #3 correspond to the sets of discriminative genes that were identified using the TT, COR and WRS filters, respec-tively (seeS5–S7Datasets). It is worth noting that the merged form of these subsets (theS8 Dataset) produced the highest classification accuracy of 92.1%, which is higher than previously reported classification accuracies [32,48,70]. The inclusion of the genes in each GBPSO-SVM branch and in the fused set was based on the number of times that gene was repeated in the 10-fold selection. Genes with repeatability of less than 7-fold were not included in the sets. The improvement in classification accuracy may be due to the effect of stepwise selection proce-dures that were followed during the pre-selection operations as well as the incorporation of a relatively high number of filtered genes (200 genes) at the final stage of selection by the GBPSO-SVM algorithm. In previous studies [75], superior performance of PSO over GA in terms of accuracy was reported. To determine the real difference between the time taken by GA and GBPSO, in this study GA was tested against GBPSO. It was observed that the time required for feature selection by the GBPSO method is one-third of that required by the GA
Fig 11. Andrews plot for three representative selected genes from the reduced dataset before the application of filter methods.
method. Moreover, GBPSO involves fewer steps and requires less memory to perform feature selection. The ten most frequent repetitive and/or similar genes in the 10-fold selection among the three achieved subsets were FKBP4, RHPN2, SEMA6B, ZNF230, LARS, LOC283075, CAPS2, ANKUB1, B3GNT7, and CASP2. A comparison between the most discriminative genes that were chosen during the initial and last selection steps identified a common gene, CAPS2. Therefore, it might be possible for us to assign this gene as one of the most important ASD risk genes. It was reported that the Ca2+-dependent activator protein for the CAPS family of secretory proteins regulates neuropeptide-containing dense-core vesicles (DCVs) at sites of secretion such as nerve terminals [76]. It was also claimed that genes associated with autism are responsible for Ca2+regulation in brain membranes, and CAPS2 is one of the genes that
Fig 12. Andrews plot for three representative selected genes from the 200 genes filtered by the WRS method.
https://doi.org/10.1371/journal.pone.0187371.g012
Table 3. Accuracy percentages of six different classifiers used after the first selection stage in 10-fold cross-validation.
Classifier TT filter COR filter WRS filter
Decision Tree 62.9 65.3 57.3
Discriminant Analysis 75.0 72.6 74.2
Logistic Regression 46.8 41.9 52.4
SVM 86.3 81.8 83.8
K-Nearest Neighbor 73.4 74.2 76.6
Ensemble Bagged Trees 71.0 69.4 69.4
contribute to the regulation of Ca2+levels [77]. Consistent with our observations, a recent study showed that CAPS2 may be a risk factor for autism [78].
Conclusions
The gene expression values of autism spectrum disorder (ASD) were successfully analyzed with the goal of improving the selection and classification process. This was accomplished using a combination of statistical filters and a wrapper-based GBPSO-SVM algorithm. It was noted that the expression of genes potentially associated with ASD varies greatly among the observations; hence, the utilization of the mean ratio criterion alone to remove similar genes does not provide a reliable result. Instead, both the mean and median ratio should be utilized simultaneously. It was shown that the pre-reduction process improves the accuracy of the SVM classifier. The results showed that each filter method identifies different sets of genes with a specific repetition of the discriminative genes among them. This is due to the high vari-ance of several genes in autism disorder and necessitates the use of additional selection steps. During the filtration stage, the three most discriminative genes that received the highest repeti-tion ranking among 30 sets of filtered genes were found to be ZSCAN18, CFC1B and CAPS2, whereas after further gene selection using GBPSO-SVM, a set of ten genes, namely FKBP4, RHPN2, SEMA6B, ZNF230, LARS, LOC283075, CAPS2, ANKUB1, B3GNT7, and CASP2, was selected. A comparison of the most discriminative genes identified during the initial and final selection steps pointed to the existence of a common gene (CAPS2), which was desig-nated as the gene that showed the greatest association with ASD risk. The merged forms of the gene subsets that were selected by the GBPSO-SVM wrapper produced an improved classifica-tion accuracy of 92.1%, higher than those reported previously, in spite of its improved
Table 4. Accuracy percentage of the SVM classifier at different stages of removal of similar genes and applied filtration results for 200 discrimina-tive genes.
Reduction criterion Genes, # TT filter COR filter WRS filter
Without reduction 54,613 72.7 75.0 68.2
Mean & Median ratio 0.99 37,125 72.7 75.0 68.2
Mean & Median ratio 0.98 26,644 72.7 75.0 68.2
Mean & Median ratio 0.97 18,975 75.0 75.0 70.5
Mean & Median ratio 0.96 13,470 77.3 75.0 77.7
Mean & Median ratio 0.95 9454 86.3 81.8 83.8
Mean & Median ratio 0.94 6655 80.4 78.5 82.5
Mean & Median ratio 0.93 4606 76.4 75.4 75.4
Mean & Median ratio 0.92 3231 73.5 74.5 73.5
Mean & Median ratio 0.91 2165 69.6 70.5 70.6
Mean & Median ratio 0.90 1490 72.5 69.6 71.5
Mean ratio 0.95 13,324 75.0 77.3 72.7
Median ratio 0.95 14,440 77.3 77.3 75.0
https://doi.org/10.1371/journal.pone.0187371.t004
Table 5. Accuracy percentage of the SVM classifier at the final stage of gene selection by the GBPSO-SVM algorithm in 10-fold cross-validation and the accuracy of the new dataset in terms of the model.
Dataset Classification accuracy, %
Gene subset #1 Gene subset #2 Gene subset #3 Merged set
Validation/testing set 91.1 89.5 87.3 92.1
Non-involved set 83.2 80.1 82.5 84.7
efficiency. This enhancement was attributed to the effect of using GBPSO-SVM as an accurate and fast algorithm.
Supporting information
S1 Dataset. The reduced dataset. The dataset contains 146 observations and 9454 genes.
(CSV)
S2 Dataset. The dataset selected by the TT filter. This dataset contains 124 observations and
200 genes. (CSV)
S3 Dataset. The dataset selected by the COR filter. This dataset contains 124 observations
and 200 genes. (CSV)
S4 Dataset. The dataset selected by the WRS filter. This dataset contains 124 observations
and 200 genes. (CSV)
S5 Dataset. The first dataset selected by GBPSO-SVM. This dataset was derived from the
dataset selected by the TT filter. It contains 124 observations and 48 genes. (CSV)
S6 Dataset. The second dataset selected by GBPSO-SVM. This dataset was derived from the
dataset selected by the COR filter. It contains 124 observations and 46 genes. (CSV)
S7 Dataset. The third dataset selected by GBPSO-SVM. This dataset was derived from the
dataset selected by the WRS filter. It contains 124 observations and 37 genes. (CSV)
S8 Dataset. The merged set of the datasets selected by GBPSO-SVM. The merged set was
generated by fusing the three datasets selected by GBPSO-SVM. It contains 124 observations and 101 genes.
(CSV)
Acknowledgments
The authors are grateful to the Department of Computer Science and Software Engineering of the Universiti Teknologi Malaysia for their administrative support. The authors would also like to express their deepest gratitude for the financial support received under the UTM Research University Grant Scheme (Vot number 11H84).
Author Contributions
Conceptualization: Rohayanti Hassan, Fahmi F. Muhammad.
Data curation: Shilan S. Hameed.
Formal analysis: Shilan S. Hameed.
Investigation: Shilan S. Hameed, Fahmi F. Muhammad.
Methodology: Shilan S. Hameed, Rohayanti Hassan, Fahmi F. Muhammad.
Supervision: Rohayanti Hassan.
Validation: Shilan S. Hameed.
Writing – original draft: Shilan S. Hameed.
Writing – review & editing: Shilan S. Hameed, Rohayanti Hassan, Fahmi F. Muhammad.
References
1. Wing L. Autistic spectrum disorders. BMJ: British Medical Journal. 1996; 312(7027):327. PMID:
8611819
2. Lin IF, Yamada T, Komine Y, Kato N, Kato M, Kashino M. Vocal Identity Recognition in Autism Spec-trum Disorder. PLOS ONE. 2015; 10(6):e0129451.https://doi.org/10.1371/journal.pone.0129451
PMID:26070199
3. De Rubeis S, Buxbaum JD. Recent advances in the genetics of autism spectrum disorder. Current neu-rology and neuroscience reports. 2015; 15(6):1–9.
4. Thurm A, Swedo SE. The importance of autism research. Dialogues on Clinical Neurosciences. 2012; 14(3):219–22.
5. Taniai H, Nishiyama T, Miyachi T, Imaeda M, Sumi S. Genetic influences on the broad spectrum of autism: Study of proband-ascertained twins. American Journal of Medical Genetics Part B: Neuropsy-chiatric Genetics. 2008; 147(6):844–9.
6. Yoo H. Genetics of autism spectrum disorder: current status and possible clinical applications. Experi-mental neurobiology. 2015; 24(4):257–72.https://doi.org/10.5607/en.2015.24.4.257PMID:26713075 7. Alarco´n M, Abrahams BS, Stone JL, Duvall JA, Perederiy JV, Bomar JM, et al. Linkage, association,
and gene-expression analyses identify CNTNAP2 as an autism-susceptibility gene. The American Jour-nal of Human Genetics. 2008; 82(1):150–9.https://doi.org/10.1016/j.ajhg.2007.09.005PMID:
18179893
8. Purcell A, Jeon O, Zimmerman A, Blue M, Pevsner J. Postmortem brain abnormalities of the glutamate neurotransmitter system in autism. Neurology. 2001; 57(9):1618–28. PMID:11706102
9. Gregg JP, Lit L, Baron CA, Hertz-Picciotto I, Walker W, Davis RA, et al. Gene expression changes in children with autism. Genomics. 2008; 91(1):22–9.https://doi.org/10.1016/j.ygeno.2007.09.003PMID:
18006270
10. de Menezes RX, Boer JM, van Houwelingen HC. Microarray Data Analysis. Applied Bioinformatics. 2004; 3(4):229–35.https://doi.org/10.2165/00822942-200403040-00004PMID:15702953
11. Govindarajan R, Duraiyan J, Kaliyappan K, Palanisamy M. Microarray and its applications. Journal of Pharmacy & Bioallied Sciences. 2012; 4(Suppl 2):S310–S2.https://doi.org/10.4103/0975-7406.100283
PMID:23066278
12. Leung MK, Delong A, Alipanahi B, Frey BJ. Machine Learning in Genomic Medicine: A Review of Computational Problems and Data Sets. Proceedings of the IEEE. 2016; 104(1):176–97.
13. Libbrecht MW, Noble WS. Machine learning applications in genetics and genomics. Nature Reviews Genetics. 2015; 16(6):321–32.https://doi.org/10.1038/nrg3920PMID:25948244
14. Liu B, Liu F, Fang L, Wang X, Chou K-C. repDNA: a Python package to generate various modes of fea-ture vectors for DNA sequences by incorporating user-defined physicochemical properties and sequence-order effects. Bioinformatics. 2014; 31(8):1307–9.https://doi.org/10.1093/bioinformatics/ btu820PMID:25504848
15. Liu B, Liu F, Fang L, Wang X, Chou K-C. repRNA: a web server for generating various feature vectors of RNA sequences. Molecular Genetics and Genomics. 2016; 291(1):473–81.https://doi.org/10.1007/ s00438-015-1078-7PMID:26085220
16. Liu B, Liu F, Wang X, Chen J, Fang L, Chou K-C. Pse-in-One: a web server for generating various modes of pseudo components of DNA, RNA, and protein sequences. Nucleic acids research. 2015; 43(W1):W65–W71.https://doi.org/10.1093/nar/gkv458PMID:25958395
17. Annavarapu Chandra Sekhara Rao D S, Banka H. Cancer microarray data feature selection using multi-objective binary particle swarm optimization algorithm. EXCLI journal. 2016; 15:460.https://doi. org/10.17179/excli2016-481PMID:27822174
18. Rejani Y, Selvi ST. Early detection of breast cancer using SVM classifier technique. arXiv preprint arXiv:09122314. 2009.
20. Hu VW, Sarachana T, Kim KS, Nguyen A, Kulkarni S, Steinberg ME, et al. Gene expression profiling dif-ferentiates autism case–controls and phenotypic variants of autism spectrum disorders: Evidence for circadian rhythm dysfunction in severe autism. Autism research. 2009; 2(2):78–97.https://doi.org/10. 1002/aur.73PMID:19418574
21. Hira ZM, Gillies DF. A review of feature selection and feature extraction methods applied on microarray data. Advances in bioinformatics. 2015; 2015.
22. Han J, Pei J, Kamber M. Data mining: concepts and techniques: Elsevier; 2011.
23. Zhu L, Zhang H, Huang D-S. LMMO: A Large Margin Approach for Refining Regulatory Motifs. IEEE/ ACM Transactions on Computational Biology and Bioinformatics. 2017.
24. Zhang H, Zhu L, Huang D-S. DiscMLA: an efficient discriminative motif learning algorithm over high-throughput datasets. IEEE/ACM transactions on computational biology and bioinformatics. 2016.
25. Singh RK, Sivabalakrishnan M. Feature selection of gene expression data for cancer classification: a review. Procedia Computer Science. 2015; 50:52–7.
26. Saeys Y, Inza I, Larrañaga P. A review of feature selection techniques in bioinformatics. bioinformatics. 2007; 23(19):2507–17.https://doi.org/10.1093/bioinformatics/btm344PMID:17720704
27. Bolo´n-Canedo V, Sa´nchez-Marono N, Alonso-Betanzos A, Benı´tez JM, Herrera F. A review of microar-ray datasets and applied feature selection methods. Information Sciences. 2014; 282:111–35.
28. Gnana DAA, Appavu S, Leavline EJ. Literature Review on Feature Selection Methods for High-Dimen-sional Data. methods. 2016; 136(1).
29. Das S, editor Filters, wrappers and a boosting-based hybrid for feature selection. ICML; 2001: Citeseer.
30. Cateni S, Vannucci M, Vannocci M, Colla V. Variable Selection and Feature Extraction Through Artificial Intelligence Techniques. In: Freitas LVd, Freitas APBRd, editors. Multivariate Analysis in Management, Engineering and the Sciences. Rijeka: InTech; 2013. p. Ch. 06.
31. Chen L-F, Su C-T, Chen K-H, Wang P-C. Particle swarm optimization for feature selection with applica-tion in obstructive sleep apnea diagnosis. Neural Computing and Applicaapplica-tions. 2012; 21(8):2087–96.
32. Latkowski T, Osowski S. Data mining for feature selection in gene expression autism data. Expert Sys-tems with Applications. 2015; 42(2):864–72.
33. Chen Y, Miao D, Wang R. A rough set approach to feature selection based on ant colony optimization. Pattern Recognition Letters. 2010; 31(3):226–33.
34. Gonza´lez F, Belanche LA. Feature selection for microarray gene expression data using simulated annealing guided by the multivariate joint entropy. arXiv preprint arXiv:13021733. 2013.
35. Tran B, Xue B, Zhang M, editors. Improved PSO for feature selection on high-dimensional datasets. Asia-Pacific Conference on Simulated Evolution and Learning; 2014: Springer.
36. Alba E, Garcia-Nieto J, Jourdan L, Talbi E-G, editors. Gene selection in cancer classification using PSO/SVM and GA/SVM hybrid algorithms. Evolutionary Computation, 2007 CEC 2007 IEEE Congress on; 2007: IEEE.
37. Kennedy J, Eberhart RC, editors. A discrete binary version of the particle swarm algorithm. Systems, Man, and Cybernetics, 1997 Computational Cybernetics and Simulation, 1997 IEEE International Con-ference on; 1997: IEEE.
38. Cervante L, Xue B, Zhang M, Shang L, editors. Binary particle swarm optimisation for feature selection: A filter based approach. Evolutionary Computation (CEC), 2012 IEEE Congress on; 2012: IEEE.
39. He F, Yang H, Wang G, Cui G, editors. A novel method for hepatitis disease diagnosis based on RS and PSO. Proc of International Conference of 4th Electronic System-Integration Technology Confer-ence; 2012.
40. Xue B, Zhang M, Browne WN. Particle swarm optimization for feature selection in classification: A multi-objective approach. IEEE transactions on cybernetics. 2013; 43(6):1656–71.https://doi.org/10.1109/ TSMCB.2012.2227469PMID:24273143
41. Teng X, Dong H, Zhou X. Adaptive feature selection using v-shaped binary particle swarm optimization. PLOS ONE. 2017; 12(3):e0173907.https://doi.org/10.1371/journal.pone.0173907PMID:28358850 42. Christobel M, Tamil Selvi S, Benedict S. Efficient scheduling of scientific workflows with energy
reduc-tion using novel discrete particle swarm optimizareduc-tion and dynamic voltage scaling for computareduc-tional grids. The Scientific World Journal. 2015; 2015.
43. Moraglio A, Di Chio C, Togelius J, Poli R. Geometric particle swarm optimization. Journal of Artificial Evolution and Applications. 2008; 2008.
45. Alter MD, Kharkar R, Ramsey KE, Craig DW, Melmed RD, Grebe TA, et al. Autism and increased pater-nal age related changes in global levels of gene expression regulation. PloS one. 2011; 6(2):e16715.
https://doi.org/10.1371/journal.pone.0016715PMID:21379579
46. El-Fishawy P, State MW. The genetics of autism: key issues, recent findings, and clinical implications. Psychiatric Clinics of North America. 2010; 33(1):83–105.https://doi.org/10.1016/j.psc.2009.12.002
PMID:20159341
47. Fisher RA, editor Theory of statistical estimation. Mathematical Proceedings of the Cambridge Philo-sophical Society; 1925: Cambridge Univ Press.
48. Latkowski T, Osowski S. Computerized system for recognition of autism on the basis of gene expres-sion microarray data. Computers in biology and medicine. 2015; 56:82–8.https://doi.org/10.1016/j. compbiomed.2014.11.004PMID:25464350
49. John Lu Z. The elements of statistical learning: data mining, inference, and prediction. Journal of the Royal Statistical Society: Series A (Statistics in Society). 2010; 173(3):693–4.
50. Lai C, Reinders MJ, van’t Veer LJ, Wessels LF. A comparison of univariate and multivariate gene selec-tion techniques for classificaselec-tion of cancer datasets. BMC bioinformatics. 2006; 7(1):235.
51. Huertas C, Jua´rez-Ramı´rez R, editors. Filter feature selection performance comparison in high-dimensional data: A theoretical and empirical analysis of most popular algorithms. Information Fusion (FUSION), 2014 17th International Conference on; 2014: IEEE.
52. Haury A-C, Gestraud P, Vert J-P. The influence of feature selection methods on accuracy, stability and interpretability of molecular signatures. PloS one. 2011; 6(12):e28210.https://doi.org/10.1371/journal. pone.0028210PMID:22205940
53. Lazar C, Taminau J, Meganck S, Steenhoff D, Coletta A, Molter C, et al. A survey on filter techniques for feature selection in gene expression microarray analysis. IEEE/ACM Transactions on Computa-tional Biology and Bioinformatics. 2012; 9(4):1106–19.https://doi.org/10.1109/TCBB.2012.33PMID:
22350210
54. Muszyński M, Osowski S. Data mining methods for gene selection on the basis of gene expression arrays. International Journal of Applied Mathematics and Computer Science. 2014; 24(3):657–68.
55. Wiliński A, Osowski S. Ensemble of data mining methods for gene ranking. Bulletin of the Polish Acad-emy of Sciences: Technical Sciences. 2012; 60(3):461–70.
56. Wilcoxon F. Individual comparisons by ranking methods. Biometrics bulletin. 1945; 1(6):80–3.
57. Wild C, Seber G. The Wilcoxon rank-sum test. Chapter; 2011.
58. Khoshgoftaar T, Dittman D, Wald R, Fazelpour A, editors. First order statistics based feature selection: A diverse and powerful family of feature seleciton techniques. Machine Learning and Applications (ICMLA), 2012 11th International Conference on; 2012: IEEE.
59. Sprent P, Smeeton NC. Applied nonparametric statistical methods: CRC Press; 2016.
60. Li S, Wu X, Tan M. Gene selection using hybrid particle swarm optimization and genetic algorithm. Soft Computing-A Fusion of Foundations, Methodologies and Applications. 2008; 12(11):1039–48.
61. Saha S, Seal DB, Ghosh A, Dey KN. A novel gene ranking method using Wilcoxon rank sum test and genetic algorithm. International Journal of Bioinformatics Research and Applications. 2016; 12(3): 263–79.
62. Bridge PD, Sawilowsky SS. Increasing physicians’ awareness of the impact of statistics on research outcomes: comparative power of the t-test and Wilcoxon rank-sum test in small samples applied research. Journal of clinical epidemiology. 1999; 52(3):229–35. PMID:10210240
63. Ardjani F, Sadouni K, Benyettou M, editors. Optimization of SVM MultiClass by Particle Swarm (PSO-SVM). 2010 2nd International Workshop on Database Technology and Applications; 2010 27–28 Nov. 2010.
64. Cortes C, Vapnik V. Support-vector networks. Machine learning. 1995; 20(3):273–97.
65. Jirapech-Umpai T, Aitken S. Feature selection and classification for microarray data analysis: Evolution-ary methods for identifying predictive genes. BMC bioinformatics. 2005; 6(1):148.
66. Hassanien AE, Al-Shammari ET, Ghali NI. Computational intelligence techniques in bioinformatics. Computational biology and chemistry. 2013; 47:37–47.https://doi.org/10.1016/j.compbiolchem.2013. 04.007PMID:23891719
67. Huerta EB, Duval B, Hao J-K, editors. A hybrid GA/SVM approach for gene selection and classification of microarray data. Workshops on Applications of Evolutionary Computation; 2006: Springer.
69. Furey TS, Cristianini N, Duffy N, Bednarski DW, Schummer M, Haussler D. Support vector machine classification and validation of cancer tissue samples using microarray expression data. Bioinformatics. 2000; 16(10):906–14. PMID:11120680
70. Latkowski T, Osowski S, editors. Developing Gene Classifier System for Autism Recognition. Interna-tional Work-Conference on Artificial Neural Networks; 2015: Springer.
71. Garcı´a-Nieto J, Alba E, Jourdan L, Talbi E. Sensitivity and specificity based multiobjective approach for feature selection: Application to cancer diagnosis. Information Processing Letters. 2009; 109(16): 887–96.
72. Liu B, Wu H, Zhang D, Wang X, Chou K-C. Pse-Analysis: a python package for DNA/RNA and protein/ peptide sequence analysis based on pseudo components and kernel methods. Oncotarget. 2017; 8(8):13338.https://doi.org/10.18632/oncotarget.14524PMID:28076851
73. Liu B, Xu J, Lan X, Xu R, Zhou J, Wang X, et al. iDNA-Prot| dis: identifying DNA-binding proteins by incorporating amino acid distance-pairs and reduced alphabet profile into the general pseudo amino acid composition. PloS one. 2014; 9(9):e106691.https://doi.org/10.1371/journal.pone.0106691PMID:
25184541
74. Liu B, Zhang D, Xu R, Xu J, Wang X, Chen Q, et al. Combining evolutionary information extracted from frequency profiles with sequence-based kernels for protein remote homology detection. Bioinformatics. 2013; 30(4):472–9.https://doi.org/10.1093/bioinformatics/btt709PMID:24318998
75. Talbi E-G, Jourdan L, Garcia-Nieto J, Alba E, editors. Comparison of population based metaheuristics for feature selection: Application to microarray data classification. Computer Systems and Applications, 2008 AICCSA 2008 IEEE/ACS International Conference on; 2008: IEEE.
76. Sadakata T, Sekine Y, Oka M, Itakura M, Takahashi M, Furuichi T. Calcium-dependent activator protein for secretion 2 interacts with the class II ARF small GTPases and regulates dense-core vesicle traffick-ing. The FEBS journal. 2012; 279(3):384–94.https://doi.org/10.1111/j.1742-4658.2011.08431.xPMID:
22111578
77. Krey JF, Dolmetsch RE. Molecular mechanisms of autism: a possible role for Ca 2+ signaling. Current opinion in neurobiology. 2007; 17(1):112–9.https://doi.org/10.1016/j.conb.2007.01.010PMID:
17275285