RESEARCH
Impact evaluation of malaria control
interventions on morbidity and all-cause child
mortality in Mali, 2000–2012
Kassoum Kayentao
1*, Lia S. Florey
2, Jules Mihigo
3, Abdoul Doumbia
4, Aliou Diallo
3, Diakalia Koné
4,
Ogobara Doumbo
1and Erin Eckert
2Abstract
Background: Major investments have been made since 2001, with intensification of malaria control interventions after 2006. Interventions included free distribution of insecticide-treated nets (ITN) to pregnant women and chil-dren under 5 years old, the introduction of artemisinin combination therapy (ACT) for malaria treatment, and indoor residual spraying of insecticides. Funders include the Government of Mali, the Global Fund to Fight AIDS, Tuberculosis and Malaria, and the US President’s Malaria Initiative.
Methods: Data from nationally representative household surveys conducted from 2000 to 2015 was used to per-formed the trend analysis for malaria intervention coverage, prevalence of morbidities among children under 5 years old [parasitemia and severe anaemia (< 8 g/dl)], and all-cause mortality of children under 5 (ACCM). Prevalence of contextual factors likely to contribute to ACCM were also assessed. The impact of these interventions was assessed on malaria morbidity and mortality using a plausibility argument. With the assumption that malaria contributes significantly to under-five mortality in settings with high malaria transmission, associations between malaria control interventions and all-cause under-five mortality (ACCM) were assessed taking into account other contextual factors related to child survival.
Results: Intervention coverage improved significantly from 2006 to 2012. Household ownership of ITN increased from 49% in 2006 to 84% in 2012. ITN use also increased over the same period, from 26% in 2006 to 69% in 2012 among children under 5 and from 28% in 2006 to 73% in 2012 among pregnant women. The coverage of intermit-tent preventive treatment in pregnancy (IPTp) using two or more doses of SP increased from 10% in 2006 to 29% in 2012. In 2010, 23% of febrile children under 5 received ACT, as opposed to 19% in 2012. The prevalence of Plasmo-dium falciparum infection increased from 2010 (38.6%) to 2012 (51.6%), followed by a decrease in 2015 (35.8%). The prevalence of severe anaemia decreased from 2010 (26.3%) to 2012 (20.6%) and continued to decline in 2015 (19.9%). An impressive decline in ACCM was observed, from 225 in 1997–2001 to 192 in 2002–2006 and 95 in 2008–2012. Changes in contextual factors such as climate, socio-economic, nutrition, and coverage of maternal and child health interventions over the evaluation period did not favour reductions in ACCM, and are therefore unlikely to explain the observed results.
Conclusions: Taken as a whole, the evidence supports the conclusion that malaria control interventions substantially contributed to the observed decline in ACCM in Mali from 2000 to 2012, even in the context of continued high preva-lence of parasitaemia explained by contextual factors such as climate change and political instability.
Keywords: Malaria, Impact, Evaluation, Intervention, Under-five mortality, Mali
© The Author(s) 2018. This article is distributed under the terms of the Creative Commons Attribution 4.0 International License (http://creat iveco mmons .org/licen ses/by/4.0/), which permits unrestricted use, distribution, and reproduction in any medium, provided you give appropriate credit to the original author(s) and the source, provide a link to the Creative Commons license, and indicate if changes were made. The Creative Commons Public Domain Dedication waiver (http://creat iveco mmons .org/ publi cdoma in/zero/1.0/) applies to the data made available in this article, unless otherwise stated.
Open Access
*Correspondence: [email protected]
Background
A long time before the discovery of the malaria parasite in 1880 by Alphonse Laveran [1], humanity had been bur-dened by malaria. Although the disease has been eradi-cated in many countries, in the majority of sub-Saharan African countries it is still a major public health prob-lem, especially for children and pregnant women who are most at risk of severe disease and death [2], despite the intense global effort over the last two decades to defeat the disease. Most countries in sub-Saharan Africa are far away from the vision of a world free of malaria set by the global technical strategy for malaria 2016–2030 [3]. Nonetheless, countries where malaria impact evaluations have been conducted show a decrease in malaria mor-bidity and mortality following intensified investments in malaria prevention and control [4–7].
In Mali, malaria continues to be a public health prob-lem of major significance, representing the primary cause of morbidity, mortality and absenteeism at work and school [8]. In 2012, Mali recorded 2.2 million malaria cases in health facilities, accounting for 42% of all outpa-tient visits for all age groups. A total of 1900 fatal malaria cases were reported by the Ministry of Health [9]. Plas-modium falciparum is responsible for more than 90% of
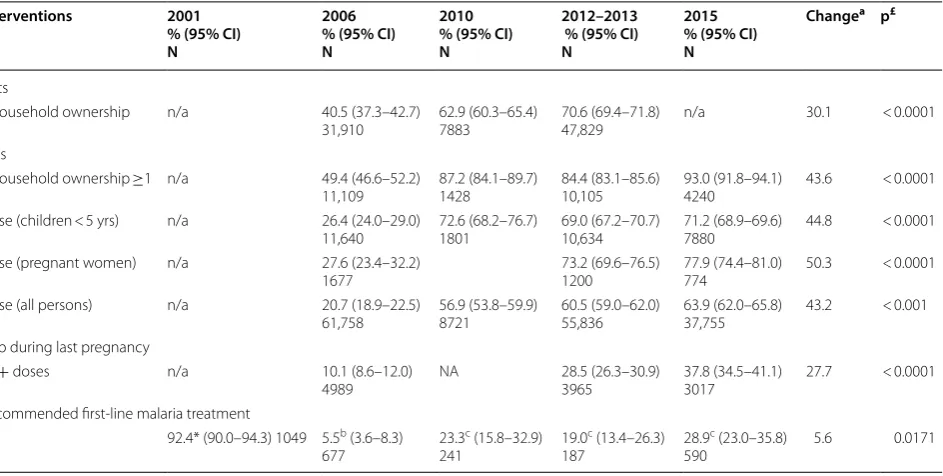
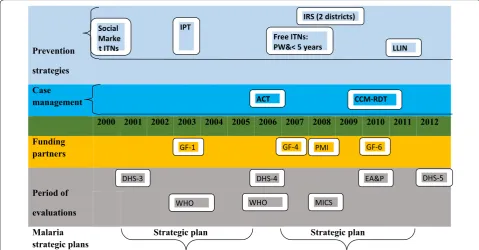
these malaria infections. The primary vectors responsi-ble for malaria transmission include Anopheles gambiae sensu stricto (in the rainy season from June to October), Anopheles funestus (cold dry season from December to January), and Anopheles arabiensis (hot dry season from March to May) [10, 11]. Between 2001 and 2012, the Government of Mali (GOM) and its international devel-opment partners invested heavily (more than US$600 million) in a series of malaria control interventions (Fig. 1). These included: (1) distribution of insecticide-treated nets (ITNs) (by social marketing, free to high-risk populations, and via universal national campaign); (2) intermittent preventive treatment in pregnancy (IPTp) (beginning in 2003); (3) use of artemisinin combination therapy (ACT) (launched in 2006) and a test-and-treat policy (implemented in 2010); (4) indoor residual spray-ing (IRS) (launched in 2008 in 2 districts only). The great-est invgreat-estment came after 2006 from sources including GOM, the Global Fund to Fight AIDS, Tuberculosis and Malaria, and the US President’s Malaria Initiative (PMI).
Despite these substantial national and international investments, no formal evaluation on a national scale of the public health impact of those interventions has been conducted. To address this gap, this report presents
Prevention strategies Case management
2000 2001 2002 2003 2004 2005 2006 2007 2008 2009 2010 2011 2012 Funding
partners
Period of evaluations Malaria
strategic plans Strategic plan Strategic plan
IPT
Free ITNs: PW&< 5
IRS (2 districts)
CCM-RDT LLIN Social
Marke
ACT
GF-1
DHS-3 DHS-4
GF-4 PMI
DHS-5 GF-6
WHO WHO MICS
EA&P
t ITNs years
[image:2.595.57.537.407.657.2]a synthesis of the impact of the expansion of malaria control interventions on all-cause mortality of children under 5 years old (ACCM) from 2000 to 2012.
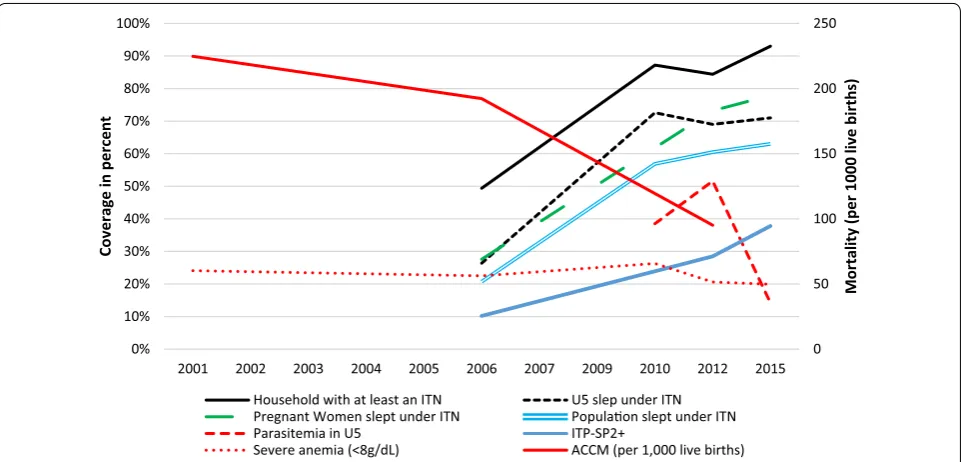
Methods Evaluation design
This evaluation is based on the premise that in high-bur-den countries such as Mali, malaria constitutes a sizeable percentage of child mortality, such that improvements in the coverage of malaria control interventions (ITN, IRS, IPTp, case management) should result in a subsequent decline in ACCM (Fig. 2). This ‘plausibility argument’, as suggested by Rowe et al. [12, 13], and subsequently adopted by the Roll Back Malaria (RBM) Monitoring and Evaluation Reference Group (MERG), is the cur-rent standard for measuring the impact of the scale up of malaria control over the past decade. Using ACCM as the primary outcome indicator ensures a robust measure that encompasses both direct and indirect malaria-related mortality. As the association between malaria control interventions and ACCM is mediated by malaria-specific outcomes, this evaluation also includes analyses of sev-eral measures of malaria-associated morbidity. Malaria infections and severe anaemia are both outcomes on the causal pathway between malaria control intervention coverage and ACCM. Available morbidity data include prevalence of severe anaemia (< 8 g/dl) and of malaria parasitaemia in children 6–59 months old. Challenges in using morbidity data for the evaluation include the lack of baseline parasitaemia data and the multiple eti-ologies of anaemia, rendering it a non-specific measure of malaria. Trends in potential contextual factors influ-encing the changes in ACCM were also explored. More details about the choice of this evaluation design have been described elsewhere [4, 6, 14].
Data sources and indictors
Estimates of malaria parasitaemia prevalence, anaemia prevalence, ACCM, distribution of demographic char-acteristics, coverage of malaria interventions, and cover-age of other health interventions were obtained mainly from five national, population-based, household surveys conducted in 2001, 2006, 2010, 2012/13, and 2015 [15– 19]. As the 2015 survey does not contain data elements needed to calculate ACCM, the 2012/13 survey serves as the endline for the mortality evaluation. Data from the 2015 survey were used to illustrate morbidity trends beyond the primary evaluation period, in part to show the declining burden after the 2012 political crisis. These data were supplemented by routinely collected health data from the Système Local d’Information Sanitaire (SLIS), small-area studies and data from other surveys, such as post-net campaign surveys [9, 20–26]. As the
northern regions of Mali were excluded from the 2012 Demographic and Health Survey (DHS) and the 2015 Malaria Indicator Survey (MIS) due to security issues, all survey data used in this evaluation have been similarly restricted for comparability. Standard RBM indicators were used to measure malaria intervention coverage [27]. These include the proportion of households that own at least one ITN; the proportion of pregnant women, of children under 5 years of age and of the total population who slept under an ITN the night before the survey; the proportion of women with a live birth in the 2 years pre-ceding the survey receiving at least two doses of sulfadox-ine-pyrimethamine (SP) for the prevention of malaria during their most recent pregnancy (IPTp2); the propor-tion of children under 5 with a fever in the 2 weeks pre-ceding the survey; and, the proportion of children under 5 who received treatment with a first-line anti-malarial among those receiving any anti-malarial medication. Sur-vey data were also used to assess trends in the prevalence of several biomarkers related to malaria. Capillary blood specimens were obtained via finger or heel sticks from children 6–59 months of age who slept in each household the night before the survey. Severe anaemia was defined as haemoglobin < 8 g/dl as measured by HemoCue® instrument. For the detection of P. falciparum infec-tion, histidine-rich protein 2-based rapid diagnostic test (RDT) and blood smear were used in the 2010 MIS, the 2012 DHS and the 2015 MIS; however, for this evalu-ation only blood smear results were used. DHS surveys provided data on contextual factors such as measures of socio-economic status, maternal and reproductive health indicators, nutrition indicators, immunization coverage, and prevalence of other morbidities. Other sources were used for trends in rainfall (University of Columbia [28]) and in gross domestic product. Ethical approval for all surveys was obtained from both ethical committees of University of Sciences, Techniques, and Technologies of Bamako, Mali and from Inter-City Fund (ICF)’s (https :// www.icf.com/) institutional review board. Informed con-sent was signed by each survey interviewer, and analysis was performed on datasets that were anonymized.
Analyses
Temporal trends in malaria control interventions, morbidity and mortality
pregnant or recently pregnant women age 15–49 years). Malaria infection and severe anaemia were estimated among children of 6–59 months old. Changes in inter-vention coverage, parasitaemia and severe anaemia were assessed using a Chi square test for linear trend. If 2001
values were not available, 2006 values were used as the baseline. Malaria parasitaemia data were only collected starting in 2010 but continued through 2015, providing a slightly offset timeline for measurement of morbidity trends as compared to the mortality measurements. Implicit causal chain
Adequacy Scale-up sufficiently
increased? Parasitemia/anemia decreased? Under-5 mortality declined
• Consistenc
y
• Specifity
• Timing
• Magnitude
• Contextual
Uniformity of scale-up?
Targeted persons reached?
Scale-up early enough?
Sufficient increase to expect impact?
What else changed during evaluation period?
Similar reductions in settings with similar scale-up?
Age-and site specific?
Occurred when expected?
Reduction consistent with known strength of association
Trends in morbidity (eg. Anemia)
Similar reductions in settings with similar scale-up?
Age-and site specific?
Occurred when expected?
Reduction consistent with known strength of association
Trends in mortality unlikely due to malaria?
P l a u s i b i l i t y
Malaria control
intervenon coverage Reduced malaria morbidity
Reduced all-cause mortality
[image:4.595.59.536.88.538.2]Similar stratification was done for mortality rates, which were calculated using data from birth histories of interviewed women and a standard synthetic cohort life table approach to estimate all-cause mortality for chil-dren under-five. Each estimate combines data for the 5 years preceding each survey and represents a retro-spective 5-year mortality estimate. These estimates were compared for several surveys to reflect temporal trends from pre-baseline through endpoint. Deaths attributable to malaria were also estimated from available routinely collected health facility data [9, 20].
In order to test the hypothesis that expanded coverage in malaria control interventions led to declines in mor-tality, the timing and magnitude of these trends were examined more closely. Using Hill’s specificity criteria (Fig. 2), the consistency and specificity of the hypothesis were assessed. ACCM was stratified by characteristics including residence (urban/rural), children’s age (6–23 and 24–59 months), malaria risk zone (moderate, 5–40% Plasmodium falciparum prevalence (PfPR)2–10 [abbrev?] versus high, > 40% PfPR2–10) based on data from the Malaria Atlas Project (MAP) [29] and recent evaluation of the malaria risk [10].
Temporal trends by age
Both malaria mortality and morbidity vary significantly by age; younger children (< 24 months) are more at risk for both outcomes in high P. falciparum transmission areas [30, 31]. ACCM was therefore stratified by age categories (6–23 and 24–59 months) and trends were compared.
Temporal trends by malaria endemicity
To assess if greater impact was observed in higher ende-micity areas, ACCM was stratified by level of malaria endemicity (moderate, 5–40% PfPR2–10 versus high, > 40% PfPR2–10) using data from MAP and the new epidemio-logical profile of malaria in Mali [10, 29].
Accounting for contextual factors
Trends in annual precipitation and temperature over time were analysed to assess potential impact on malaria transmission. Mali has seasonal variation in rainfall and temperatures: the rainy season (corresponding to the malaria transmission period) is from June to Septem-ber, the cold dry season from October to February and the hot dry season from March to May; the annual mean temperature ranges from 12 to 34 °C. A Weighted Anom-aly of Standardized Precipitation (WASP) Tool [28] was used to estimate the change in rainfall over the evalua-tion period relative to baseline (2001–2006). Tempera-ture and WASP data were combined to assess over time if the prevailing climate in Mali was more or less suitable
for malaria transmission relative to baseline. Changes in other contextual factors between baseline (2001) and endpoint (2012–2013) were estimated with 95% CIs and per cent changes (relative). A Z-test using the standard errors in the Z-score formula was used to assess differ-ences in baseline and endpoint values.
Plausibility assessment
The consistency, specificity, timing, and magnitude of changes in intervention coverage and in impact indica-tors were assessed considering potential impact of other contextual factors likely to influence child survival. Data on malaria-specific outcomes were also assessed for potential modifying effects on the associations between malaria control intervention coverage and ACCM for the time periods for which they were available.
Results
Coverage of interventions
Coverage of malaria control interventions improved sig-nificantly from 2006 to 2012 (Table 1). Household owner-ship of ITNs increased from 49% of households in 2006 to 84% in 2012 and 93% of households by 2015. In line with this expansion of ownership, use of ITNs among high-risk populations also increased over the same period. Among children under five, ITN use increased from 26% in 2006 to 69% in 2012 and 71% by 2015. Similarly, ITN use among currently pregnant women increased to 78% in 2015 and 73% in 2012, from 28% in the 2006 survey. Pregnant women in Mali also receive IPTp with SP to prevent malaria in pregnancy. Over the time period of the study, coverage of at least 2 doses of IPTp during a woman’s most recent pregnancy increased from 10% in 2006 to 29% in 2012 and 38% in 2015. In terms of treat-ment for malaria, the drug policy evolved over the time period. In 2001, when parasitological diagnosis was not routine and chloroquine was the first-line drug, 92% of children under five with a fever received treatment with chloroquine plus other complementary drugs. By 2005, the national policy had changed to artesunate-amodi-aquine (ASAQ) as the first-line treatment, which further evolved to both ASAQ and artemether-lumefantrine (AL) by 2010. In 2010, 23% of children under five with a fever who received an anti-malarial received ACT as first-line treatment. This percentage decreased to 19% in 2012 (p = 0.32) but increased to 29% by 2015, although the difference is not statistically significant (p = 0.09).
All-cause child mortality
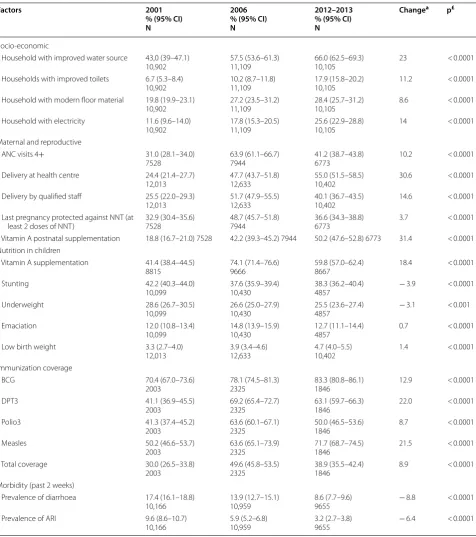
Routine data also showed a decline in all-cause under-five mortality rates per 1000 live births from 2003 to 2012 (Fig. 3b).
Parasitaemia and anaemia
Representative estimates of malaria parasitaemia preva-lence are only available from two surveys during the evaluation period: the 2010 Anaemia and Parasitaemia Survey and the 2012 DHS. These surveys are at the end of the evaluation period and are only 2 years apart and therefore offer evidence by which to evaluation the effect of malaria control interventions on ACCM. A subsequent survey, the 2015 MIS, also collected data on these out-comes. The trends in these outcomes over the 2010–2015 period are shown here for illustrative purposes although it is difficult to directly link these findings with the plau-sibility argument. There was a significant increase in the prevalence of P. falciparum infection among chil-dren 6–59 months of age from 2010 to 2012 (p < 0.0001) (Table 2), although this was followed by a decrease in 2015 survey, which was significant compared to the 2010 baseline (p < 0.036). The decline in the rural areas, where transmission is higher, was more pronounced than the decline in urban areas. In contrast, the prevalence of severe anaemia which decreased significantly from 2010
(26.3%) to 2012 (20.6%) (p < 0.0001) continued to decline in the 2015 (19.9%) (Table 3).
Plausibility argument 1: temporal associations between intervention coverage and ACCM
The declines seen in ACCM were consistent with the timeframe of the scale up of malaria control interventions (Fig. 4). While Mali saw steady declines in child mortality from the period 1997–2001 onwards, the declines were more substantial in the period between 2002–2006 and 2008–2012 (from 192 per 1000 live births to 95 per 1000 live births, a decline of 51%) than in the first half of the evaluation period (from 225 per 1000 live births to 192 per 1000 live births, a decline of 14%). The more recent time period corresponds to the period in which ITNs were distributed nationally and first-line malaria treat-ment had changed to ACT.
Plausibility argument 2: age groups and ACCM
If a large portion of the deaths among children under five is due to malaria, then declines in mortality should be greater among younger children, who are at a greater risk of death from the disease. Among children 6–23 months, mortality declined from 79 deaths per 1000 to 19 deaths per 1000, a 76% reduction between 1997–2001 and 2008–2012. By comparison, mortality among those
Table 1 Trends of malaria intervention coverage indicators, Mali, 2000–2015
* Chloroquine used as first-line therapy in 2001
£ P value of Chi squared for the two time points indicating the changes above
a Absolute change from 2006 to 2015, except for recommended first-line malaria treatment where 2010 was the starting point
b Sulfadoxine-pyrimethamine used in 2006
c Artemisinin combination therapy used in 2010, 2012–2013, and 2015
Interventions 2001
% (95% CI) N
2006 % (95% CI) N
2010 % (95% CI) N
2012–2013 % (95% CI) N
2015 % (95% CI) N
Changea p£
Nets
Household ownership n/a 40.5 (37.3–42.7)
31,910 62.9 (60.3–65.4)7883 70.6 (69.4–71.8)47,829 n/a 30.1 < 0.0001 ITNs
Household ownership ≥1 n/a 49.4 (46.6–52.2)
11,109 87.2 (84.1–89.7)1428 84.4 (83.1–85.6)10,105 93.0 (91.8–94.1)4240 43.6 < 0.0001 Use (children < 5 yrs) n/a 26.4 (24.0–29.0)
11,640 72.6 (68.2–76.7)1801 69.0 (67.2–70.7)10,634 71.2 (68.9–69.6)7880 44.8 < 0.0001 Use (pregnant women) n/a 27.6 (23.4–32.2)
1677 73.2 (69.6–76.5)1200 77.9 (74.4–81.0)774 50.3 < 0.0001 Use (all persons) n/a 20.7 (18.9–22.5)
61,758 56.9 (53.8–59.9)8721 60.5 (59.0–62.0)55,836 63.9 (62.0–65.8)37,755 43.2 < 0.001 IPTp during last pregnancy
2+ doses n/a 10.1 (8.6–12.0)
4989 NA 28.5 (26.3–30.9)3965 37.8 (34.5–41.1)3017 27.7 < 0.0001 Recommended first-line malaria treatment
92.4* (90.0–94.3) 1049 5.5b (3.6–8.3)
677 23.3
c (15.8–32.9)
241 19.0
c (13.4–26.3)
187 28.9
c (23.0–35.8)
[image:6.595.67.539.101.339.2]24–59 months experienced a 61% drop from 83 to 32 deaths per 1000 (Table 4, Fig. 3a).
Plausibility argument 3: residence and ACCM
If a significant portion of child mortality is due to malaria, it stands to reason that a greater decrease in the proportion of deaths would be seen among children living in rural areas of high transmission, and thus at higher risk of malaria death, compared to those of urban areas where transmission is moderate. While mortality rates declined in both urban and rural areas of Mali, the decrease in ACCM was greater for children living in rural areas (from 238 deaths per 1000 live births in 1997–2001 to 103 deaths per 1000 births in 2008–2012) compared to urban areas (180 deaths per 1000 live births in 1997– 2001 to 59 deaths per 1000 live births in 2008–2012).
Plausibility argument 4: contextual factors Climate
A warmer, wetter climate is associated with increased malaria transmission due to high populations of the vec-tor. Climate was measured using the WASP index, which
varied significantly over the evaluation period in Mali. There was a significant increase in the rainfall during the period of 2006–2012 compared to that of 1990–2005. A similar trend was also observed in the minimum tem-perature which was higher in the period of 2006–2012 compared to that of 2000–2005. These conditions are typically favourable for malaria transmission and may have contributed to the higher parasitaemia seen in the later period. These conditions might be expected to contribute to increased mortality and therefore do not explain the reductions in ACCM observed during the evaluation period.
Socio‑economic and political factors
The per capita gross domestic product (GDP) increased from $0.7 million in 2003 to $23.5 million in 2012, the health budget also increased from $1 million in 2007 to $2.5 million in 2012 with a peak of $9 million in 2009. There was a significant increase in the proportion of households with improved water source (43.0% in 2001 and 66.0% in 2012) and improved toilets (6.7% in 2001 and 17.9% on 2012). Similar trends were observed in the
a
b
0 50 100 150 200 250
2001 2006 2012
Mortality per 1000 livebirths
0-59 months 6-23 months 24-59 months
Fig. 3 Mortality per 1000 live births from Demographic Health Surveys and routine data, Mali. a Mortality rates from DHSs (2001, 2006, 2012–2013);
[image:7.595.57.539.86.416.2]proportion of households with modern floors and with electricity (Table 5). Improvements in socio-economic factors could contribute to the observed reductions in ACCM. However, the political upheaval and insecurity in 2012 might be expected to contribute to increased para-sitaemia prevalence in 2012 and mortality, and therefore does not explain the reductions in ACCM observed dur-ing the evaluation period.
Maternal and reproductive factors
The proportion of pregnant women attending 4 or more antenatal clinic (ANC) visits increased from
2001 (31.0%) to 2006 (64.0%), followed by a decrease in 2012 (41.2%). A similar trend was observed in the proportion of pregnant women delivered by a qualified provider and the proportion of women who received at least 2 doses of tetanus toxoid. In contrast, the pro-portion of women who delivered at a health centre and the proportion receiving postnatal vitamin A sup-plementation continued upward between 2006 and 2012 although increases were small (Table 5). Given the declining coverage in most maternal reproduc-tive health factors and the minimal improvements in other factors during the period of the most significant reduction in ACCM, these factors are unlikely to be
Table 2 Prevalence of Plasmodium falciparum carriage among children under 5 years old in Mali, 2010–2015
a Percent absolute change from 2010 to 2012
b Percent absolute change from 2010 to 2015
c Study was conducted in selected areas of the region of Mopti which were retained for the overall analysis
≠ p-value of Chi squared comparing proportions of 2010 and 2012
≠≠ p-value of Chi squared for linear trend in proportions across the three surveys
Characteristics 2010 % (95% CI) N
2012–2013 % (95% CI) N
2015 % (95% CI) N
Changea p-value≠ Changeb p-value≠≠
Overall
38.6 (32.6–45.0)
1583 51.6 (48.5–54.8)4699 35.8 (31.7–40.2)7071 13 < 0.0001 − 2.7 0.0360 Age categories (years)
6–11 15.9 (10.0–24.2)
159 41.4 (36.0–47.1)492 23.6 (18.4–29.8)784 25.5 < 0.0001 7.7 0.0295 12–23 31.0 (24.5–38.5)
351 46.8 (42.7–50.9)978 28.5 (24.5–33.0)1477 15.8 < 0.0001 − 2.5 0.3438 24–35 42.4 (34.1–51.1)
383 50.9 (46.5–55.2)1030 37.9 (33.2–42.8)1511 8.5 0.0041 − 4.5 0.1165 36–47 43.8 (35.5–52.5)
348 55.0 (50.6–59.2)1147 39.0 (34.0–44.2)1629 11.2 0.0002 − 4.8 0.1041 48–59 47.2 (38.9–55.7)
342 58.0 (53.7–62.1)1052 43.0 (37.2–48.9)1681 10.8 0.0004 − 4.2 0.1670 Place of residence
Urban 4.5 (1.9–10.4)
301 16.8 (13.5–20.6)863 13.1 (9.5–17.7)1349 12.3 < 0.0001 8.6 < 0.0001 Rural 46.6 (39.7–53.6)
1282 59.5 (55.9–62.9)3836 41.2 (36.3–46.2)5733 12.9 < 0.0001 − 5.4 < 0.0001 Regions
Kayes 27.1 (15.0–43.9)
207 36.9 (29.7–44.7)611 27.4 (20.3–35.9)1083 9.8 0.0110 0.3 0.9127 Koulikoro 40.4 (27.7–54.4)
325 50.2 (41.7–58.8)1028 34.8 (25.9–44.8)1481 9.8 0.0018 − 5.6 0.0594 Sikasso 58.5 (47.1–69.1)
230 62.1 (54.9–68.9)1141 41.6 (34.6–48.9)1321 3.6 0.3275 − 16.9 < 0.0001 Segou 41.6 (27.0–57.9)
409 55.7 (49.9–61.3)906 36.7 (28.2–46.1)1300 14.1 0.0002 − 4.9 0.0764 Moptic 50.2 (36.7–63.7)
229 70.6 (65.4–75.4)610 59.8 (46.8–71.5)1087 20.4 < 0.0001 9.6 0.0075 Bamako 2.1 (0.3–14.4)
[image:8.595.59.537.101.489.2]important drivers in the observed ACCM decline dur-ing the evaluation period.
Nutrition
The proportion of vitamin A supplementation in chil-dren increased from 41.4% in 2001 to 74.1% in 2006 and decreased to 59.8% in 2012. The proportion of chil-dren with low height-for-age and low weight-for-age declined by small but significant amounts (4 and 3.1%, respectively) over the evaluation period. The propor-tion of children with low weight-for-height did not change significantly over the evaluation period (12.0% in 2001 compared to 12.7% in 2012), although a signifi-cant increase (2.8%) was seen in 2006 (14.8%). The pro-portion of low birth weight newborns did not decline
over the evaluation period but rather increased from 3.3% in 2001 to 3.9% in 2006 and 4.7% in 2012 (Table 5). Given the minimal reductions or increases in nutrition-associated morbidities over the evaluation period, these factors are unlikely to explain the observed reductions in ACCM.
Vaccination
There was an increase in the percentage of children fully vaccinated from 30.0% in 2001 to 49.6% in 2006, followed by a decrease (38.9%) in 2012 (Table 5). These trends are inconsistent with the hypothesis that increase vac-cination coverage explains the observed reductions in ACCM.
Table 3 Prevalence of severe anaemia among children under 5 years old in Mali, 2010–2015
a Percent absolute change from the first survey to the last survey
b Study was conducted in selected areas of the region of Mopti which were retained for the overall analysis
≠ p-value of Chi squared for linear trend in proportions across the surveys
Characteristics 2006 % (95% CI) N
2010 % (95% CI) N
2012–2013 % (95% CI) N
2015
% (95% CI) N Change
a p-value≠
Overall 22.5 (20.0–25.1)
3239 26.3 (22.5–30.5)1580 20.6 (18.9–22.4)4745 19.9 (17.4–22.6)7081 − 2.6 < 0.0001 Age categories (years)
6–23 31.8 (28.2–35.6)
1099 33.0 (27.4–39.1)508 25.2 (22.6–28.0)1485 23.1 (20.5–26.0)2261 − 8.7 < 0.0001 24–59 17.7 (15.3–20.4)
2139 23.1 (19.3–27.5)1071 18.5 (16.5–20.6)3259 18.4 (15.7–21.3)4821 0.7 0.0018 Endemicity
Moderate 21.2 (15.6–28.1)
515 15.1 (15.6–28.1)515 12.5 (9.5–16.2)689 11.6 (9.3–14.4)2015 − 9.6 < 0.0001 High 22.9 (10.1–25.8)
2700 28.3 (24.0–33.1)1325 22.0 (20.1–24.1)4000 23.2 (20.1–26.5)5066 0.3 0.00004 Place of residence
Urban 11.1 (8.1–15.0)
875 9.7 (7.1–13.1)300 8.4 (6.7–10.6)879 7.7 (6.4–9.3)1349 − 3.4 0.0470 Rural 26.7 (24.1–29.5)
2363 30.2 (25.8–35.0)1279 23.3 (21.4–25.5)3866 22.7 (19.9–25.9)5733 − 4.0 < 0.0001 Regions
Kayes 22.6 (16.1–30.9)
512 31.8 (22.4–43.0)206 18.9 (15.4–22.9)613 19.9 (15.6–24.4)1083 − 3.4 0.0004 Koulikoro 25.1 (20.7–30.1)
659 21.3 (14.7–29.8)322 20.4 (14.4–25.1)1038 19.8 (15.8–24.6)1481 − 4.0 0.0464 Sikasso 27.0 (22.2–32.3)
681 34.6 (27.9–42.0)230 21.1 (17.6–25.0)1157 19.4 (15.7–23.7)1321 − 2.7 < 0.0001 Segou 25.6 (21.4–30.3)
618 28.7 (19.3–40.3)409 20.5 (16.7–25.0)909 20.3 (16.7–24.4)1300 − 5.3 0.0005 Moptib 15.8 (8.3–28.1)
382 31.0 (22.4–41.1)229 30.1 (25.1–35.6)611 29.5 (19.6–41.8)1087 13.7 < 0.0001 Bamako 11.5 (8.4–15.6)
[image:9.595.58.539.102.465.2]Other morbidity
The prevalence of diarrhoea and acute respiratory infec-tion declined by 8.8 and 6.4%, respectively, over the eval-uation period (Table 5). Although reductions in these morbidities may help drive reductions in ACCM, the magnitude of change was relatively small over the evalu-ation period.
Plausibility argument 5: malaria morbidity on the causal pathway
Baseline data on malaria parasitaemia prevalence do not exist in Mali. The first available parasitaemia data are from the 2010 MIS. Between 2010 and 2012, the preva-lence of malaria increased from 39 to 52% among chil-dren 6–59 months. Overall, from 2010 to 2015 malaria parasitaemia prevalence declined significantly from 38.6 to 35.8% (p = 0.0360). Consistent with the plausibility argument, stratified analyses revealed that the decrease in malaria prevalence was more pronounced in younger children (6–23 months) compared to older children (24– 59 months), in rural areas compared to urban areas, and in the four regions where the most significant increase was seen between 2010 and 2012.
Markers of severe anaemia (< 8 g/dl) among chil-dren under five remained relatively constant from 2001 through 2010, with a small, but statistically significant
decline between 2010 (26.3%) and 2015 (19.9%). How-ever, among children 6–23 months, who are at the highest risk for malaria-related anaemia, there was a statistically significant decline from 2006 (32%) to 2015 (23%), while prevalence among children 24–59 months did not decrease (17.7% in 2006 vs 18.4% in 2015). Declines in severe anaemia were also more pronounced in strata where the greatest declines in malaria preva-lence occurred.
Discussion
Over the period of evaluation, ACCM, used as a stand-ard indicator of malaria programme impact in high ende-micity countries of sub-Saharan Africa [27], declined substantially during a period of rapid investment in and expansion of malaria control interventions. The observed mortality trends are consistent with what would be expected if reductions in malaria transmission were an important driver. The temporality of the mortality trends is consistent with the hypothesis that reduction in malaria is a major cause. Although a significant decline in ACCM was observed between 1997–2001 and 2002– 2006, a much greater decline was observed between 2002–2006 and 2008–2012, the period corresponding to the rapid expansion of malaria control interventions, including ITN distribution and use, IPTp expansion and improvements in malaria case management. In further
0 50 100 150 200 250
0% 10% 20% 30% 40% 50% 60% 70% 80% 90% 100%
2001 2002 2003 2004 2005 2006 2007 2009 2010 2012 2015
Mortalit
y(
per 1000
live births)
Coverage in percent
Household with at least an ITN U5 slep under ITN
Pregnant Women slept under ITN Populaon slept under ITN
Parasitemia in U5 ITP-SP2+
Severe anemia (<8g/dL) ACCM (per 1,000 live births)
[image:10.595.58.539.87.318.2]support of this hypothesis, the greatest mortality decline was seen in children 6–23 months who are also at the highest risk for malaria-related morbidity and mortal-ity [30]. These findings, derived from household sur-vey data, are also supported by the health facility data reported to the routine information system. These rou-tinely reported data showed a decrease trend in ACCM from 2003 to 2012 among children under five, with higher decrease from 2007 to 2012 (Fig. 3b), a time period after the country officially adopted ACT as first-line treatment for uncomplicated malaria [26]. A similar decline was seen among older children and adults. The total number of deaths in health facilities from all causes for both children under five and for older age groups increased between 2000 and 2010. This may be explained by increases in access to health services, in parasitologi-cal confirmation of cases and in reporting of cases during this period. Between 2010 and 2012, when malaria diag-nostics were more widely used in Mali (~ 50% of malaria cases confirmed by RDT or microscopy were treated in a health centre), weekly surveillance data indicate a decline in malaria deaths.
Even though the decline in ACCM was concurrent with an increase in the coverage of malaria control
interventions between 2001 and 2012, it is important to note that other contextual factors might have contrib-uted to the observed declines in mortality as suggested by previous studies [4, 5, 13, 32, 33]. During the same time-frame, a number of other indicators of socio-economic conditions and coverage of other health interventions also improved. These include GDP, access to potable water and improved sanitation facilities, although their benefit was not equitably distributed across the coun-try (Gini coefficient = 0.033). Several maternal and child health interventions also expanded coverage during this period, including use of antenatal care, delivery with a skilled attendant, and vaccination for preventable child-hood diseases. Despite the expanded coverage over the evaluation period as a whole, declines were noted in cov-erage of many of these interventions between 2006 and 2012 and per cent of population covered with these ser-vices remained quite low in general, indicating their small contribution to the observed decrease in ACCM.
Given the significant expanded coverage of malaria control interventions and reduction in ACCM over the last half of the evaluation period, a significant reduction in the prevalence of malaria was expected, as reported by previous authors [5]. Unfortunately, nationally
Table 4 Trends in all-cause mortality (per 1000 live births) among 0–59 months of age in Mali, 2001, 2006, and 2012, by background characteristics
NA non-applicable because of absence of data a Relative change from 2001 to 2006
b Relative change from 2006 to 2012
Factors 2001
% (95% CI) 2006% (95% CI) 2012% (95% CI) Change
a Changeb
Age in months
0–59 224.8 (213.3–236.2) 192.3 (180.8–203.6) 95.1 (87.8–102.3) − 14.5 − 50.5 6–23 79.1 (71.6–86.5) 66.6 (59.3–73.9) 18.6 (15.4–21.8) − 15.8 − 72.1 24–59 83.3 (74.7–91.8) 70.4 (61.4–79.4) 31.9 27.6–36.2) − 15.5 − 54.7 Gender
Male 230. 2 (214.8–245.4) 192.8 (179.2–206.1) 108.5 (98.5–118.4) − 16.2 − 43.7 Female 219.3 (204.4–233.9) 191.8 (173.5–209.7) 80.8 (71.6–89.9) − 12.5 − 57.9 Residence
Urban 179.9 (156.2–202.9) 132.8 (105.8–159.1) 59.2 (47.6–70.6) − 26.2 − 55.4 Rural 238.2 (225.1–251.2) 213.4 (201.4–225.2) 103.2 (94.6–111.7) − 10.4 − 51.6 Endemicity
Moderate NA 130.7 (110.1–150.8) 60.3 (46.4–74.0) NA − 53.9 High NA 204.5 (191.5–217.4) 101.7 (93.4–110.0) NA − 50.3 Regions
[image:11.595.58.539.111.387.2]Table 5 Prevalence of contextual factors influencing all-cause mortality over time in Mali, 2001 versus 2012–2013
ANC antenatal clinic, NNT neonatal tetanus toxoid, BCG Bacillus Calmette-Guérin, DPT diphteria pertusis tetanus, ARI acute respiratory infection a Percent absolute change from 2001 to 2012–2013
£ p-value of Chi squared for linear trend in proportions across the three surveys
Factors 2001
% (95% CI) N
2006 % (95% CI) N
2012–2013 % (95% CI) N
Changea p£
Socio-economic
Household with improved water source 43,0 (39–47.1)
10,902 57.5 (53.6–61.3)11,109 66.0 (62.5–69.3)10,105 23 < 0.0001 Households with improved toilets 6.7 (5.3–8.4)
10,902 10.2 (8.7–11.8)11,109 17.9 (15.8–20.2)10,105 11.2 < 0.0001 Household with modern floor material 19.8 (19.9–23.1)
10,902 27.2 (23.5–31.2)11,109 28.4 (25.7–31.2)10,105 8.6 < 0.0001 Household with electricity 11.6 (9.6–14.0)
10,902 17.8 (15.3–20.5)11,109 25.6 (22.9–28.8)10,105 14 < 0.0001 Maternal and reproductive
ANC visits 4+ 31.0 (28.1–34.0)
7528 63.9 (61.1–66.7)7944 41.2 (38.7–43.8)6773 10.2 < 0.0001 Delivery at health centre 24.4 (21.4–27.7)
12,013 47.7 (43.7–51.8)12,633 55.0 (51.5–58.5)10,402 30.6 < 0.0001 Delivery by qualified staff 25.5 (22.0–29.3)
12,013 51.7 (47.9–55.5)12,633 40.1 (36.7–43.5)10,402 14.6 < 0.0001 Last pregnancy protected against NNT (at
least 2 doses of NNT) 32.9 (30.4–35.6)7528 48.7 (45.7–51.8)7944 36.6 (34.3–38.8)6773 3.7 < 0.0001 Vitamin A postnatal supplementation 18.8 (16.7–21.0) 7528 42.2 (39.3–45.2) 7944 50.2 (47.6–52.8) 6773 31.4 < 0.0001 Nutrition in children
Vitamin A supplementation 41.4 (38.4–44.5)
8815 74.1 (71.4–76.6)9666 59.8 (57.0–62.4)8667 18.4 < 0.0001 Stunting 42.2 (40.3–44.0)
10,099 37.6 (35.9–39.4)10,430 38.3 (36.2–40.4)4857 − 3.9 < 0.0001 Underweight 28.6 (26.7–30.5)
10,099 26.6 (25.0–27.9)10,430 25.5 (23.6–27.4)4857 − 3.1 < 0.001 Emaciation 12.0 (10.8–13.4)
10,099 14.8 (13.9–15.9)10,430 12.7 (11.1–14.4)4857 0.7 < 0.0001 Low birth weight 3.3 (2.7–4.0)
12,013 3.9 (3.4–4.6)12,633 4.7 (4.0–5.5)10,402 1.4 < 0.0001 Immunization coverage
BCG 70.4 (67.0–73.6)
2003 78.1 (74.5–81.3)2325 83.3 (80.8–86.1)1846 12.9 < 0.0001 DPT3 41.1 (36.9–45.5)
2003 69.2 (65.4–72.7)2325 63.1 (59.7–66.3)1846 22.0 < 0.0001 Polio3 41.3 (37.4–45.2)
2003 63.6 (60.1–67.1)2325 50.0 (46.5–53.6)1846 8.7 < 0.0001 Measles 50.2 (46.6–53.7)
2003 63.6 (65.1–73.9)2325 71.7 (68.7–74.5)1846 21.5 < 0.0001 Total coverage 30.0 (26.5–33.8)
2003 49.6 (45.8–53.5)2325 38.9 (35.5–42.4)1846 8.9 < 0.0001 Morbidity (past 2 weeks)
Prevalence of diarrhoea 17.4 (16.1–18.8)
10,166 13.9 (12.7–15.1)10,959 8.6 (7.7–9.6)9655 − 8.8 < 0.0001 Prevalence of ARI 9.6 (8.6–10.7)
[image:12.595.60.537.99.637.2]representative data on malaria prevalence are lacking for most of the evaluation period. Data that are availa-ble show a significant increase in the prevalence of par-asitaemia among children 6–59 months old from 2010 (39%) to 2012 (52%) [17, 18]. Although this increase was observed in all regions, it was most pronounced in the region of Mopti where the prevalence increased from 50% (2010) to 71% (2012). As this increase coin-cides with a significant improvement in the coverage of malaria major interventions, there is a suggestion of possible failure of malaria interventions in Mali. How-ever, it is important to note that the 12 months or so immediately preceding the endpoint of this evaluation (2012) was a period of political upheaval and insecu-rity in Mali. The 2012 survey data were collected at a time of large-scale movements of malaria-naïve popu-lations from the north to malaria-endemic regions of the south. The region of Mopti received many dis-placed people from the north and was shown to be the region the highest prevalence of parasitaemia in 2012. Furthermore, climate conditions could have facilitated an increase in malaria transmission over the period of 2006–2012 and contributed to the temporary disrup-tion of the momentum initiated in malaria control. National rainfall data indicate that the period between 2000 and 2006 was drier than the 15-year average, but the period corresponding to the expansion of malaria control interventions (2006–2012) was significantly wetter than average. Similarly, the annual temperature deviation from the 50-year average was markedly hot-ter from 2006 to 2012 than for the earlier period. Taken together, these climate variations could have facilitated an increase in malaria transmission over the latter part of the evaluation period. This, in addition to the politi-cal upheaval and insecurity in Mali may have contrib-uted to the increase of malaria prevalence observed between 2010 and 2012 [17].
The malaria prevalence estimates from the 2015 MIS [19] show a significant decline from 2012 levels (36% compared to 52%) thereby providing additional evi-dence that the 2012 malaria prevalence was an anomaly, perhaps due to political and climate factors, and that malaria intervention strategies are contributing to bur-den reduction.
Severe anaemia (HB < 8 g/dl) is another indicator of malaria-associated morbidity, although nutritional causes, genetic disorders and other parasitic infections can play a part in anaemia prevalence. The study sug-gested a small but significant decrease (p = 0.0326) in the prevalence of severe anaemia in children 6–59 months from 23% in 2006 to 21% in 2012. This decrease was more pronounced among young children (6–23 months) compared to older children, and among those living in
rural compared to urban areas. The decline in the indi-cated strata was persistent during the expansion period of malaria control interventions from 2006 to 2012, and when data of 2010–2015 only are examined, the decline is more substantial, supporting the plausibility argument that malaria interventions were having an indirect effect in reducing the burden of anemia.
During the evaluation period the health sector expanded, providing increased access to health care. The number of health facilities increased and community case management was expanded, which may have contrib-uted to detection and reporting of a greater number of malaria cases. Towards the end of the evaluation period, RDTs were introduced and diagnostics were improved, and case management was pushed out to the community level through community health workers, also potentially contributing to an increase in reported cases. Weekly reporting of malaria cases was only functional in the epi-demic-prone regions of the north until 2008 when it was extended to the entire country. In general, the routine information system benefitted from a number of invest-ments to improve the quality and timeliness of reporting which could have influenced the observed increase in reported cases.
In summary, the results of this evaluation show an important decline in ACCM corresponding to the time-frame of the rapid increase in coverage of malaria control interventions. The timing and specificity of the results are consistent with the hypothesis that improved malaria control contributed to observed mortality declines: inter-vention coverage was largely scaled up after 2006, corre-sponding to the period of the most dramatic decline in ACCM (Fig. 4), and declines in ACCM were more pro-nounced in children with the highest malaria risk (rural, younger children).
Conclusions
Taken as a whole, the evidence supports the conclusion that malaria control interventions substantially con-tributed to the observed decline in ACCM in Mali from 2000 to 2012, even in a context of continued high prev-alence of parasitaemia and political instability. As Mali returns to a peaceful political status, the strong founda-tion of malaria control built over the past 15 years pro-vides a sense of optimism for future gains.
Abbreviations
ACT : artemisinin-based combination therapy; ACCM: all-cause child mortality; ITN: insecticide-treated net; IPTp: intermittent preventive treatment; GOM: Government of Mali; IRS: indoor residual spray; PMI: US President’s Malaria Initiative; RBM: Roll Back Malaria; MERG: Monitoring and Evaluation Reference Group; DHS: Demographics Health Survey; MIS: Malaria Indicator Survey; SP: sulfadoxine-pyrimethamine; RDT: rapid diagnostic test; ASAQ: artesunate-amodiaquine; AL: artemether-lumefantrine; SLIS: Systeme Local d’Information Sanitaire; MAP: Malaria Atlas Project; GDP: gross domestic product.
Authors’ contributions
KK, LSF, EE, conceived the study and drafted the protocol. KK sought ethical approval. KK AD, AD, JM collected data. KK, LSF did the analysis with input from EE. KK prepared the manuscript and received input from LSF, EE, JM, and OD. All authors read and approved the final manuscript.
Author details
1 Malaria Research and Training Center (MRTC), University of Sciences, Techniques and Technologies of Bamako (USTTB), Bamako, Mali. 2 President’s Malaria Initiative (PMI), U.S. Agency for International Development (USAID), Washington, District of Columbia, USA. 3 US President’s Malaria Initiative, United States Agency for International Development (USAID), Bamako, Mali. 4 National Malaria Control Programme (NMCP), Bamako, Mali.
Acknowledgements
The authors would like to acknowledge all the malaria stakeholders in Mali for their role in providing the data and accepted interviews for assessing data and documents availability. A special thank is addressed to international Research Institute for climate and society- IRICS at University of Columbia which helps for climate data analysis. We thank the Mali Ministry of health including the National Malaria Control Program for their collaboration.
Competing interests
The authors declare that they have no competing interests.
Availability of data and materials
Data are mainly from Demographics Health Survey (DHS) of 2001, 2006 and 2012–2013 (https ://www.dhspr ogram .com/data/avail able-datas ets.cfm) and from Anemia and Parasitemia survey (2010) and Mali Malaria indicator survey (MIS) 2015. PfPR2–10 data are available from the Malaria Atlas Project (https :// map.ox.ac.uk/count ry-profi les/#!/MLI) or prelinked with survey data via the DHS Spatial Data Repository (http://spati aldat a.dhspr ogram .com/covar iates /).
Consent for publication
Not applicable.
Ethics approval and consent to participate
This was a secondary analysis mainly on national surveys. However, the study protocol was approved (No 2015/01/CE/FMPOS) by the Ethical Committee of University of Sciences, Techniques, and Technologies of Bamako, Faculty of Medicine and Odontostomatology.
Funding
Financial support for this study was provided by the US President’s Malaria Initiative. Support was for data collection, analysis and interpretation of data and in writing the manuscript.
Publisher’s Note
Springer Nature remains neutral with regard to jurisdictional claims in pub-lished maps and institutional affiliations.
Received: 6 August 2018 Accepted: 9 November 2018
References
1. Bockarie MJ, Gbakima AA, Barnish G. It all began with Ronald Ross: 100 years of malaria research and control in Sierra Leone (1899–1999). Ann Trop Med Parasitol. 1999;93:213–24.
2. Van den Boogaard W, Manzi M, Ali E, Reid A. Reducing malaria in Mali: Effective diagnostics and treatmentare not enough: MSF Project in Kang-aba District. Médecins sans Frontières. 2011.
3. WHO. Global technical strategy for malaria control 2016–2030. Geneva: World Health Organization; 2015.
4. Eckert E, Florey LS, Tongren JE, Salgado SR, Rukundo A, Habimana JP, et al. Impact evaluation of malaria control interventions on morbidity and all-cause child mortality in Rwanda, 2000–2010. Am J Trop Med Hyg. 2017;97:99–110.
5. Smithson P, Florey L, Salgado SR, Hershey CL, Masanja H, Bhattarai A, et al. Impact of malaria control on mortality and anemia among Tanzanian children less than five years of age, 1999–2010. PLoS ONE. 2015;10:e0141112.
6. Thwing J, Eckert E, Dione DA, Tine R, Faye A, Ye Y, et al. Declines in malaria burden and all-cause child mortality following increases in control inter-ventions in Senegal, 2005–2010. Am J Trop Med Hyg. 2017;97:89–98. 7. PMI-report-Mali: https ://www.pmi.gov/docs/defau lt-sourc e/defau
lt-docum ent-libra ry/pmi-repor ts/evalu ation -of-the-impac t-of-the-scale -up-of-malar ia-contr ol-inter venti ons-morta lity-in-child ren-under -five-years -in-mali-2000-2012-full-repor t-frenc h.pdf?sfvrs n=8); 2000–2012. Assessed July 17 2018.
8. Thuilliez J, Sissoko MS, Toure OB, Kamate P, Berthelemy JC, Doumbo OK. Malaria and primary education in Mali: a longitudinal study in the village of Doneguebougou. Soc Sci Med. 2010;71:324–34.
9. DNS-SLIS. Direction Nationale de la Sante du Mali (2012) SLIS. Systeme Local d’Information Sanitaire. 2012.
10. PNLP, MRTC and INFORM. An epidemiological profile of malaria in Mali. A report prepared for the Ministry of Health, Mali, the Roll Back Malaria Part-nership and the Department for International Development, UK, 2015. 11. Sogoba N, Vounatsou P, Bagayoko MM, Doumbia S, Dolo G, Gosoniu L, et al. Spatial distribution of the chromosomal forms of anopheles gam-biae in Mali. Malar J. 2008;7:205.
12. Rowe AK, Steketee RW. Predictions of the impact of malaria control efforts on all-cause child mortality in sub-Saharan Africa. Am J Trop Med Hyg. 2007;77:48–55.
13. Rowe AK, Steketee RW, Arnold F, Wardlaw T, Basu S, Bakyaita N, et al. Viewpoint: evaluating the impact of malaria control efforts on mortality in sub-Saharan Africa. Trop Med Int Health. 2007;12:1524–39.
14. Ye Y, Eisele TP, Eckert E, Korenromp E, Shah JA, Hershey CL, et al. Frame-work for evaluating the health impact of the scale-up of malaria control interventions on all-cause child mortality in sub-Saharan Africa. Am J Trop Med Hyg. 2017;ali97:9–19.
15. EDS. Enquete Demographique et de Sante du Mali. 2001. 16. EDS. Enquete Demographique et de Sante du Mali. 2006. 17. EDS. Enquete Demoraphique et de Sante du Mali. 2012. 18. EA&P. Enquete Anemie et Parasitemie du Mali. 2010. 19. MIS. Malaria Indicator Survey of Mali. 2015.
20. (INSTAT) INdlS. Annuaire Statitique du Mali 2012. Bamako, Mali. 2013. 21. Cellule de Planification et de Statistique du secteur sante developpment
social et la promotion de la famille (APS/SSDSPF) INdlSI. Enquete par grappes a indicateurs multiples du Mali 2009-2010 Bamako, Mali. 2013. 22. OMS-Mali. Rapport de Suivi-Evaluation de la lutte contre le paludisme du
ministère de la santé. 2004.
•fast, convenient online submission
•
thorough peer review by experienced researchers in your field
• rapid publication on acceptance
• support for research data, including large and complex data types
•
gold Open Access which fosters wider collaboration and increased citations maximum visibility for your research: over 100M website views per year
•
At BMC, research is always in progress.
Learn more biomedcentral.com/submissions
Ready to submit your research? Choose BMC and benefit from:
24. PNLP-MSHP. Document de Politique Nationale de Lutte contre le Palud-isme au Mali. 2001.
25. PNLP-MSHP. Evaluation de la possession et de l’utilisation des mousti-quaires imprégnées d’insecticides à longue durée de remanance (MILDs) au Mali, huit mois apres la campagne intégrée de décembre 2007. 2008. 26. PNLP-MSHP. Rapport Final de l’Evaluation de la possession et de
l’utilisation des moustiquaires imprégnées d’insecticide (MIIs) au Mali. 2008.
27. RBM RBMP. Guidelines for core population-based indicators. Geneva: The RBM Partnersip; 2009.
28. IRICS IRIfCaS. Analysis of Climate Data, Mali, Earth Institute, Columbia University. 2015.
29. Gething PW, Patil AP, Smith DL, Guerra CA, Elyazar IR, Johnston GL, et al. A new world malaria map: Plasmodium falciparum endemicity in 2010. Malar J. 2011;10:378.
30. Reyburn H, Mbatia R, Drakeley C, Bruce J, Carneiro I, Olomi R, et al. Association of transmission intensity and age with clinical manifesta-tions and case fatality of severe Plasmodium falciparum malaria. JAMA. 2005;293:1461–70.
31. Okiro EA, Al-Taiar A, Reyburn H, Idro R, Berkley JA, Snow RW. Age patterns of severe paediatric malaria and their relationship to Plasmodium falcipa-rum transmission intensity. Malar J. 2009;8:4.
32. Evaluation MMI. Malawi Malaria Impact Evaluation Group. Evaluation of the impact of malaria control interventions on all-cause mortality in children under five in Malawi, 2000–2010. Washington, DC: President’s Malaria Initiative; 2016.
![Fig. 2 Conceptual framework for an adequacy and plausibility assessment supporting Mali malaria impact evaluation [5]](https://thumb-us.123doks.com/thumbv2/123dok_us/8312536.293338/4.595.59.536.88.538/conceptual-framework-adequacy-plausibility-assessment-supporting-malaria-evaluation.webp)