Mantzaris, Alexander Vassilios and Higham, Desmond J. (2012) A model
for dynamic communicators. European Journal of Applied Mathematics,
23 (6). pp. 659-668. ISSN 0956-7925 ,
http://dx.doi.org/10.1017/S0956792512000186
This version is available at https://strathprints.strath.ac.uk/42453/
Strathprints is designed to allow users to access the research output of the University of Strathclyde. Unless otherwise explicitly stated on the manuscript, Copyright © and Moral Rights for the papers on this site are retained by the individual authors and/or other copyright owners. Please check the manuscript for details of any other licences that may have been applied. You may not engage in further distribution of the material for any profitmaking activities or any commercial gain. You may freely distribute both the url (https://strathprints.strath.ac.uk/) and the content of this paper for research or private study, educational, or not-for-profit purposes without prior permission or charge.
Any correspondence concerning this service should be sent to the Strathprints administrator: [email protected]
The Strathprints institutional repository (https://strathprints.strath.ac.uk) is a digital archive of University of Strathclyde research outputs. It has been developed to disseminate open access research outputs, expose data about those outputs, and enable the
A Model for Dynamic Communicators
Alexander V. Mantzaris and Desmond J. Higham
Department of Mathematics and Statistics, University of Strathclyde, Glasgow G1 1XH, UK
(Received 12 December 2011)
We develop and test an intuitively simple dynamic network model to describe the type
of time-varying connectivity structure present in many technological settings. The model
assumes that nodes have an inherent hirerarchy governing the emergence of new
connec-tions. This idea draws on newly established concepts in on-line human behavior concerning
the existence of discussion catalysts, who initiate long threads, and on-line leaders, who
trigger feedback. We show that the model captures an important property found in email
and voice call data—‘dynamic communicators’ with sufficient foresight or impact to
gen-erate effective links have an influence that is grossly underestimated by static measures
based on snaphots or aggregated data.
Key Words:Social networks, complex networks, stochastic models
1 Introduction
Random graph models and centrality measures have provided extremely useful tools in
of a single, static network. Many emerging network data sets aredynamic; links between
nodes may appear and disappear in a time-dependent manner. Examples arise naturally
when we measure email activity [2, 12, 11], voice calls [6, 11, 20], online social interaction
[12, 29], geographical proximity of mobile device users [16, 29], dynamic transportation
infrastructure [4, 8, 21], voting and trading patterns [1, 23] and neural activity [3, 10],
and also whenlink prediction [7, 22] is required.
For this reason, new models and algorithms are needed to address dynamic structures
[10]. We emphasize that in this setting it is not just the ‘final state’ of an iterative process
that is of interest. Instead we are concerned with the real-time dynamics—what
mecha-nisms drive the continual change in topological structure, and how do we summarize key
properties of a dynamic network?
2 Background and Motivation
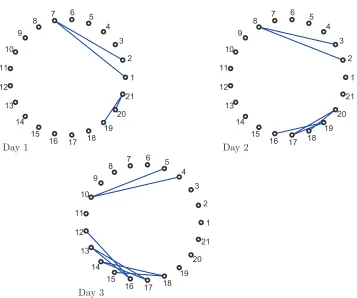
Figure 1 shows a hypothetical scenario of communication between a set of 21 nodes over
three days. This undirected, unweighted, network sequence has been constructed so that
node 21 does not appear to be unusually important when we consider any single day, or
the aggregate over the three days. However, closer inspection shows that thetiming of
node 21’s links is special. A message from node 21 may reach nodes 19 and 20 on day
one, nodes 16 to 18 on day two and nodes 12 to 15 on day three. We could interpret node
21 as being aninfluential player—when other individuals receive a message that can be
traced back to node 21 they burst into action and pass the message on. Alternatively,
we could interpret node 21 as being aknowledgable player who can accurately predict,
insider information. In this work, after summarizing the recent ideas from [11] that allow
us to quantify the intuitive notion that node 21 is special, we confirm that the same
phe-nomenon is seen in real communication data. We then introduce a new, general dynamic
network model, based on simple but intuitively reasonable principles, that captures the
effect. Day 1 1 2 3 4 5 6 7 8 9 10 11 12 13 14 15
16 17 18 19 20 21 Day 2 1 2 3 4 5 6 7 8 9 10 11 12 13 14 15
16 17 18 19 20 21 Day 3 1 2 3 4 5 6 7 8 9 10 11 12 13 14 15
16 17 18 19
[image:4.612.96.453.189.487.2]20 21
Figure 1. An ordered sequence of three undirected and unweighted networks.
Following the notation in [11], for a fixed set ofN nodes and time points t0 < t1 <
· · · < tM, we consider an ordered sequence of unweighted graph adjacency matrices
A[k] ∈ RN×N, so that A[k]
ij = 1 if there is a link from node i to node j at time tk
and A[k]
ij = 0 otherwise. Adynamic walk of lengthw is any traversal alongw edges,
in the case of undirected networks, where each A[k] is symmetric, dynamic walks lack
symmetry in general. For example, in Figure 1 there is a dynamic walk of length two
from node 7 to node 8 (using 7→2 on day one and 2→8 on day two) but there are no
dynamic walks from node 8 to node 7. In [11] it was shown how to compute the matrix
Q ∈RN×N for which (Q)
ij is a weighted count of the number of dynamic walks of length
wfrom nodeito nodej, where walks of lengthware scaled by a factoraw. Hereais an
appopriately chosen fixed parameter that downweights the contribution of longer walks.
The corresponding row and column sums
Cnbroadcast:= N
X
k=1
Qnk and Cnreceive:= N
X
k=1
Qkn (2.1)
are centrality measures that quantify how effectively node n canbroadcast and receive
dynamic messages. In practice, because we are typically concerned with ranking the
nodes, it is preferable to compute with a normalized matrixQ/k Q k in order to avoid
numerical under or overflow. These measures reduce to the classic Katz centralities [17,
25] when there is a single time point1.
Related work in [26, 27, 28] has also devised centrality measures that respect time
dependency, based on shortest paths rather than walks. We also note that paths and
re-lated concepts under time-dependent connectivity have been studied previously. Berman
[4] considered dynamic networks where each edge has a start and finish time, and looked
at global connectivity issues. Related work in the case where each edge exists at a single
instant of time appeared in [18]. Spread of information or disease across a time-dependent
1 As discussed in the original work of Katz [17], the downweighting parameteramay also be
contact network was considered in in [12], whereas [19] focuses on the issue of optimal
routes to pass the most timely information. An approach for discovering temporal
com-munities is given in [23], with extra links being added to the network sequence in order
to represent the passage of time. The ideas in [11] differ from those mentioned above
by focusing on individual nodes and all possible communicaton routes that respect the
arrow of time. In this work we use the data-driven tools from [11] to motivate and test
a new mathematical model for network evolution.
We can now quantify our intuitive arguments concerning the role of node 21 in Figure 1.
This node has the largest dynamic broadcast centrality,Cbroadcast
n , (usinga= 0.5) while
ranking much lower according to static measures: there are 5 nodes with higher positions
in terms of overall degree, 7 nodes have higher positions in terms of the maximum over
k = 1,2,3 of Katz centrality at each time point (using a = 0.4), and node 21 lies
in 8th position in terms of Katz centrality on the aggregate network P3
k=1A[
k] (using
a = 0.3258). We will use the term dynamic communicator to describe a node of this
type; that is, having excellent centrality in the dynamic sense that is not apparent when
we consider only snapshot or aggregate views of the network sequence. These players can
distribute a message, or spread a disease, across the network in a manner that efficiently
exploits the transient nature of the links. For simplicity we focus here on broadcast
centrality, but we note later that a symmetry argument allows us to cover the case of
3 Practical Observations
We continue by showing that dynamic broadcasters can be found consistently in real
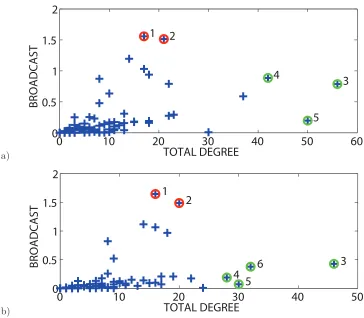
communication data sets. For Figure 2 we use two weeks of Enron email data [11]. In
this case there areN = 151 nodes and in the upper picture a) we use a time resolution
ti+1−ti of one day—we have M + 1 = 14 time points, and (A[k])ij = 1 signifies that
at least one email (to, cc or bcc) was sent from person i to person j on dayk. The
horizontal axis records the total out degree, that is, the aggregate bandwidth generated
over the whole time period, for each person. The vertical axis represents the broadcast
centralityCbroadcast
n from (2.1). Five nodes are highlighted and labelled in subfigure a).
Nodes 1 and 2 have the highest broadcast centrality but modest total out degree—these
are examples of dynamic communicators. Follow-up analysis shows that they correspond
to an executive and the vice president, who can be speculated as having a large influence.
The nodes labelled 3, 4 and 5 have high bandwidth but relatively poor broadcast
cen-trality. Nodes 3 and 4 correspond to traders in the company and node 5 has an unknown
role. The figure highlights that an exceptionally high out degree is neither necessary nor
sufficient to guarantee influence amongst other nodes in this time-dependent setting. To
test for consistentcy at a different time resolution, in subfigure b) we split the same data
differently, withti+1−ti covering a two day period, givingM+ 1 = 7 time points made
from pairs of consecutive days. The same two dynamic communicators are observed. An
extra node, labeled number 6, has also emerged as another example with high bandwidth
but relatively poor broadcast centrality. This node corresponds to an employee.
a)
0
10
20
30
40
50
60
0
0.5
1
1.5
2
1
2
3
4
5
TOTAL DEGREE
BROADCAST
b)
0
10
20
30
40
50
0
0.5
1
1.5
2
1
2
3
4
5
6
TOTAL DEGREE
[image:8.612.95.459.75.393.2]BROADCAST
Figure 2. Broadcast centrality against total out degree across a 14 day subset of Enron email
interaction [11]. Time resolution is one day for subfigure a) and two days for subfigure b). The
same two dynamic communicators, labeled 1 and 2, stand out each time.
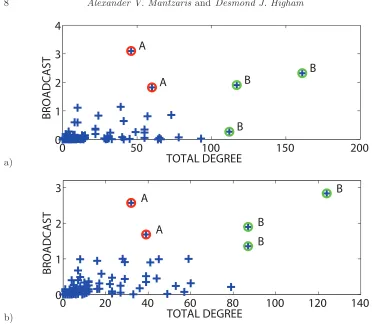
academics [6]. Subfigure a) displays the results with a time resolution of one day and
subfigure b) uses pairs of days. We regard the nodes labelled ‘A’ as dynamic
communi-cators due to their large broadcast measure and low total degree. By constrast, nodes
labelled ‘B’ have a relatively high total degree, so their ability to broadcast is much less
surprising. As in Figure 2, changing the time resolution has not affected which nodes
a)
0
50
100
150
200
0
1
2
3
4
A
A
B
B
B
TOTAL DEGREE
BROADCAST
b)
0
20
40
60
80
100
120
140
0
1
2
3
A
A
B
B
B
TOTAL DEGREE
[image:9.612.92.466.58.383.2]BROADCAST
Figure 3. Broadcast centrality against total out degree across 30 days of MIT voice call data.
Subfigure a) uses a time window of a single day and subfigure b) two consecutive days.
4 New Model
The model that we propose for explaining this phenomenon can be motivated as
gener-alizing the concept of network hierarchy from the static case [24]. In the new dynamic
setting, we assume that there is an underlying hierarchy such that some nodes have
en-hanced importance, causing their links to have a knock-on effect at future times. (As
mentioned earlier, an alternative interpretation with ‘prescience’ instead of ‘importance’
is also possible.) This hierarchy may arise through an imposed chain of command, as in
in social or criminal networks [5], or may be earned through completion of tasks, as
in on-line gaming [15]. The idea that hirearchy can impact communication structure is
intuitively reasonable, and is supported in the social sciences by, for example, the
empir-ical discovery ofdiscussion catalysts in an on-line community who are “responsible for
the majority of messages that initiate long threads” [9]. Further, Huffaker [14] identifies
on-line leaderswho have the ability to “trigger feedback, spark conversations within the
community, or even shape the way that other members of a group ‘talk’ about a topic.”
We will incorporate these ideas into a discrete time, discrete space Markov chain, in order
to build on the successful ‘random graph’ models [25] from the static setting, and the
more general dynamic framework of [10].
Compared with the static case, relatively little attention has been paid to developing
mathematical descriptions of temporal networks [13]. From a modelling perspective, our
work shares with [2, 30] the aims of (a) identifying a key feature in dynamic human
inter-action data sets and (b) offering a simple, intuitively reasonable, explanatory mechanism.
However, unlike those references, we are not focusing onwhen—i.e., the precise timing of
events for a single player. Instead we focus onwhere—i.e., the particular pairs of players
involved in each interaction—while accounting for the time ordering of the events.
Our model begins by assigning a fixed level of importance,ln, to each noden. We order
the nodes so that 0< l1≤l2≤ · · · ≤lN. The key concept in the model is that from one
time point to the next, a node is responsive to the total importance of its current links—
messages received from more highly ranked nodes are more likely to generate follow-on
follows. For each node,n, new, undirected, links appear in the row and column ofn of
A[k+1] as the result of two processes; basal and responsive.
• Basal: with probability b node ngenerates a fixed number cb of links, with the new
neighbours chosen uniformly and independently at random. Otherwise no basal links
are generated from noden.
• Responsive: with probability
r[nk]:=
PN
i=1li A[k]
in 1 +lNP
N i=1 A[k]
in
nodengenerates a fixed numbercrof links, with the new neighbours chosen uniformly
and independently at random. Otherwise no responsive links are generated from node
n.
Here 0< b <1 and the positive integerscbandcrare fixed parameters. The probability
rn[k] summarizes the current importance of connections involving nodenrelative to the
maximum possible value, with a shift of one added in the denominator to deal with
unconnected nodes. Repeated edges are of course removed and for simplicity we consider
links to be undirected.
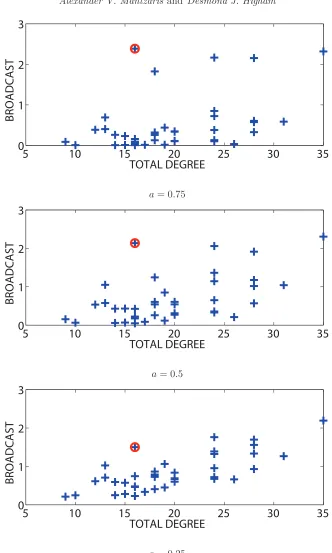
In Figure 4 we show computational results for the case where ln = en, b = 0.01,
cb = 1 and cr = 4, with N = 40 nodes over 365 timepoints. The node at the top of
the hierarchy,n= 40, is marked with a circle. Results are shown for scaling parameters
a= 0.75,0.5,0.25 in order to check for consistency against the choice of downweighting.
In each case node 40 operates as a dynamic broadcaster: despite ranking 26th in terms
well-defined temporal sense, since its links carry a level of importance that creates a knock-on
effect.
Because of the combinatorial, walk-counting derivation ofQin (2.1) it is
straightfor-ward to check that the broadcast and receive centralities for each node are swapped when
we reverse the direction of each link and also reverse the arrow of time. It follows that
node 21 in Figure 1 and node 50 in Figure 4 would become examples ofdynamic receivers
if we supply the adjacency matrices in reverse order. For these people, without taking
full account of the temporal connectivity patterns, we could easily underestimate their
ability to accumulate information, or their chance of becoming infected. We argued that
the dynamic broadcasters may be the nodes with added importance, in the sense that
their links automatically generate a follow-on response, or added predictive power, in the
sense that they preferentially link to nodes that are about to become active. There are
similar passive and active explanations for the existence of dynamic receivers. They may
have added importance, in the sense that they are the preferred point of contact for any
node in the network that is currently bursting with information or passing on requests
for advice—for example, in massive multiplayer online role-playing games a preference
has been observed for players to send messages to higher level players [15]. More actively,
dynamic receivers may have added global, historical knowledge, in the sense that they
know which nodes are currently most informative and deliberately form links with them.
5 Conclusions
Our main aim in this work was to propose and study a new model that describes the
quantifies the intuitively simple notion of an underlying hierarchy of nodal importance,
prescience or global knowledge. In practice this may arise directly through an imposed
managerial or chaof-command structure, or more subtly through social status, or
in-telligence. Computational simulations confirmed that the new model captures an effect
that can be found in communication data—certain individuals, refered to here asdynamic
communicators, are able to punch above their weight in the sense that standard
central-ity measures based on snapshots or aggregate summaries of network activcentral-ity grossly
underestimate their ability to interact with other members of the community.
Following on from this work, there is great potential for testing for the existence of
dynamic communicators in other classes of evolving network, calibrating models of this
type against real data, and investigating the role of dynamic communicators when there
is a second source of dynamic behaviour taking place over the evolving network structure,
such as a stochastic susceptible/infected/recovered disease propagation model.
Acknowledgements
This work was supported by the Engineering and Physical Sciences Research Council and
the Research Councils UK Digital Economy Programme, under grant EP/I016058/1.
References
[1] P. Bajardi, A. Barrat, F. Natale, L. Savini, and V. Colizza,Dynamical patterns of
cattle trade movements, PLoS ONE, 6 (2011), p. e19869.
[2] A.-L. Barab´asi, The origin of bursts and heavy tails in human dynamics, Nature, 435
[3] D. S. Bassett, N. F. Wymbs, M. A. Porter, P. J. Mucha, J. M. Carlson, and S. T.
Grafton,Dynamic reconfiguration of human brain networks during learning, Proc. Nat.
Acad. Sci., 108 (2011), p. doi: 10.1073/pnas.1018985108.
[4] K. Berman,Vulnerability of scheduled networks and a generalization of Menger’s Theorem,
Networks, 28 (1996), pp. 125–134.
[5] N. Coles,It’s not what you know-it’s who you know that counts. Analysing serious crime
groups as social networks, Brit. J. Criminology, 41 (2001), pp. 580–594.
[6] N. Eagle, A. S. Pentland, and D. Lazer, Inferring friendship network structure by
using mobile phone data, Proc. Nat. Acad. Sci., 106 (2009), pp. 15274–15278.
[7] P. Esfandiar, F. Bonchi, D. Gleich, C. Greif, L. Lakshmanan, and B.-W. On,
Fast Katz and commuters: Efficient estimation of social relatedness in large networks, in
Algorithms and Models for the Web-Graph, R. Kumar and D. Sivakumar, eds., vol. 6516
of Lecture Notes in Computer Science, Springer Berlin/Heidelberg, 2010, pp. 132–145.
[8] A. Gautreau, A. Barrat, and M. Barthelemy,Microdynamics in stationary complex
networks, Proc. Nat. Acad. Sci., 106 (2009), pp. 8847–8852.
[9] E. Gleave, H. T. Welser, T. M. Lento, and M. A. Smith,A conceptual and operational
definition of ’social role’ in online community, vol. 0, Los Alamitos, CA, USA, 2009, IEEE
Computer Society, pp. 1–11.
[10] P. Grindrod and D. J. Higham,Evolving graphs: Dynamical models, inverse problems
and propagation, Proc. Roy. Soc. A, 466 (2010), pp. 753–770.
[11] P. Grindrod, D. J. Higham, M. C. Parsons, and E. Estrada,Communicability across
evolving networks, Physical Review E, 83 (2011), p. 046120.
[12] P. Holme, Network reachability of real-world contact sequences, Physical Review E, 71
(2005).
[13] P. Holme and J. Saram¨aki,Temporal Networks, ArXiv e-prints, (2011).
[14] D. Huffaker,Dimensions of leadership and social influence in online communities, Human
[15] D. Huffaker, J. A. Wang, J. Treem, M. A. Ahmad, L. Fullerton, D. Williams,
M. S. Poole, and N. Contractor,The social behaviors of experts in massive
multi-player online role-playing games, Computational Science and Engineering, IEEE
Inter-national Conference on, 4 (2009), pp. 326–331.
[16] L. Isella, M. Romano, A. Barrat, C. Cattuto, V. Colizza, W. Van den Broeck,
F. Gesualdo, E. Pandolfi, L. Rav, C. Rizzo, and A. E. Tozzi,Close encounters
in a pediatric ward: Measuring face-to-face proximity and mixing patterns with wearable
sensors, PLoS ONE, 6 (2011), p. e17144.
[17] L. Katz,A new index derived from sociometric data analysis, Psychometrika, 18 (1953),
pp. 39–43.
[18] D. Kempe, J. Kleinberg, and A. Kumar,Connectivity and inference problems for
tem-poral networks, J. Comput. Syst. Sci., 64 (2002), pp. 820–842.
[19] G. Kossinets, J. Kleinberg, and D. Watts,The structure of information pathways in
a social communication network, in Proceeding of the 14th ACM SIGKDD international
conference on Knowledge discovery and data mining, KDD ’08, New York, NY, USA,
2008, ACM, pp. 435–443.
[20] J. M. Kumpula, J. P. Onnela, J. Saram¨aki, K. Kaski, and J. Kert´esz,Emergence
of Communities in Weighted Networks, Phys. Rev. Lett., 99 (2007), pp. 228701+.
[21] L. McNamara, C. Mascolo and L. Capra,Media Sharing based on Colocation
Pre-diction in Urban Transport, in Proc. of ACM 14th International Conference on Mobile
Computing and Networking (Mobicom08), San Francisco, CA, September 2008, pp. 58–
69.
[22] Z. Lu, B. Savas, W. Tang, and I. Dhillon,Supervised link prediction using multiple
sources, in Data Mining (ICDM), 2010 IEEE 10th International Conference on, Dec.
2010, pp. 923 –928.
Commu-nity structure in time-dependent, multiscale, and multiplex networks, Science, 328 (2010),
pp. 876–878.
[24] L. Muchnik, R. Itzhak, S. Solomon, and Y. Louzoun,Self-emergence of knowledge
trees: extraction of wikipedia hierarchies, Phy. Rev. E, 76 (2007), p. 016106.
[25] M. E. J. Newman,Networks an Introduction, Oxford Univerity Press, Oxford, 2010.
[26] J. Tang, M. Musolesi, C. Mascolo, and V. Latora,Temporal distance metrics for
social network analysis, in Proceedings of the 2nd ACM SIGCOMM Workshop on Online
Social Networks (WOSN09), Barcelona, 2009.
[27] J. Tang, M. Musolesi, C. Mascolo, and V. Latora,Characterising temporal distance
and reachability in mobile and online social networks, SIGCOMM Comput. Commun.
Rev., 40 (2010), pp. 118–124.
[28] J. Tang, M. Musolesi, C. Mascolo, V. Latora, and V. Nicosia,Analysing
informa-tion flows and key mediators through temporal centrality metrics, in SNS ’10: Proceedings
of the 3rd Workshop on Social Network Systems, New York, NY, USA, 2010, ACM, pp. 1–
6.
[29] J. Tang, S. Scellato, M. Musolesi, C. Mascolo, and V. Latora,Small-world
behav-ior in time-varying graphs, Phys. Rev. E, 81 (2010), p. 05510.
[30] K. Zhao, J. Stehl´e, G. Bianconi, and A. Barrat,Social network dynamics of
5
10
15
20
25
30
35
0
1
2
3
TOTAL DEGREE
BROADCAST
a= 0.75
5
10
15
20
25
30
35
0
1
2
3
TOTAL DEGREE
BROADCAST
a= 0.5
5
10
15
20
25
30
35
0
1
2
3
TOTAL DEGREE
BROADCAST
[image:17.612.120.452.60.613.2]a= 0.25
Figure 4. Broadcast centrality against total degree (horizontal axis) for network sequences