Providing Frequency Droop Control Using Variable
Speed Wind Turbines with Augmented Control
Adam Stock University of Strathclyde [email protected]
William Leithead University of Strathclyde [email protected]
Shona Pennock University of Strathclyde [email protected]
1 Abstract
An augmentation to conventional wind turbine control is presented and its applicability for providing droop control services to the grid is investigated. Both the impact on the fatigue loads of the turbines and the change in energy capture when providing droop control are assessed. Three alternative strategies for providing droop control are simulated. The controller is found to be suitable for providing droop control. When providing droop control, the damage equivalent loads for the tower and for the blades change by between -0.63% and 0.14% and between -0.45% and 0.29% respectively. Energy capture is reduced by between 3.18% and 10.91% compared to normal operation, depending upon the strategy chosen to supply droop control, the wind turbine used and the wind speed distribution.
Key words: Droop control, Active Power Control
2 The
Power
Adjusting
Controller
The UK Government is legally obliged to meet the target of 15% of energy from renewable sources by 2020 [1]. Wind energy will most probably make up a large proportion of this target due to the UK’s excellent wind resource, and thus wind will contribute a much greater proportion of the wider energy mix than at present. High penetration of wind energy could mean that grid support services such as frequency support are required to be provided by wind generation in addition to synchronous thermal generation. Fluctuations in grid frequency are automatically reacted to by synchronous generators in the system, by their contribution to system inertia and their droop characteristics. As a higher proportion of wind energy connects it would be beneficial to the system for wind power sources to provide
some of this response to changes in frequency. In the future, it is conceivable that this will become a requirement.
A Power Adjusting Controller (PAC) has been developed that allows wind farm operators far more flexible control of their assets. The controller allows a wind farm operator to change the power output of wind turbines in a farm accurately by an amount ΔP, set by the operator [2].
Previous work has shown that the PAC is capable of providing some grid support in the form of synthetic inertia [3]. This paper explores expanding the use of the PAC to include the provision of droop control.
The PAC acts as a jacket around the wind turbine full envelope controller and so, with the PAC switched off, general operation of the turbine is not affected. In addition, this enables retrofitting of the controller to older machines.
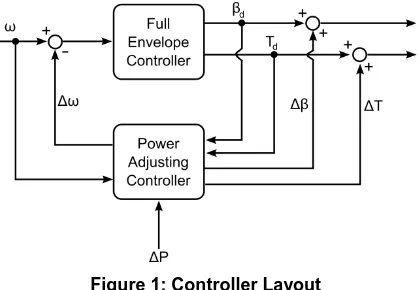
Figure 1: Controller Layout
[image:2.595.72.278.314.424.2]In order to prevent the full envelope controller from countermanding the actions of the PAC, a speed adjustment, Δω, is subtracted from the input to the full envelope controller. Δω is the estimated change in generator speed caused by the use of the PAC.
Figure 2: Internal Structure of the PAC
Figure 2 shows the internal structure of the PAC in more detail. The PAC can be split into five “blocks”. The ΔP block takes the requested change in power as an input and outputs an adjusted change in power ΔPadj. This value is modified by restricting the rate of change of ΔP and by setting a maximum and minimum limit. Also output is the flag p1, a Boolean, which is 1 when the PAC is on and 0 when the PAC is off. When p1 is 1, the ΔT block calculates the required ΔT equivalent to ΔP such that
(1) When p1 is 0, ΔT is used to drive the turbine back to its normal operating point. ΔT is used, along with Td, ω, Δω, the pitch demand from the full envelope controller, βd, and the pitch demand from the PAC, Δβ, to calculate the change in aerodynamic torque due to the PAC. The Δω block calculates the difference between ΔT and ΔTA and estimates the change in generator speed caused by the
PAC, Δω, using a dynamic model of the wind turbine. Finally, this value along with βd, is used by the Δβ block via a PI controller and gain scheduling, to generate a change in pitch angle to return the turbine to its normal operating speed. When p1 is set to zero, the value of Δβ is driven to zero.
3 Alternative
Offset
Strategies
for
Droop
Control
In order to provide droop control, additional power is required when the grid frequency falls below 50Hz. As this additional power may be required for a prolonged period of time, the turbine power output must therefore be reduced in below rated conditions, as additional power cannot be provided indefinitely in these conditions. In above rated conditions it is possible to provide additional power by over rating the turbine. As such, no de-rating of the wind turbine is required.
The UK grid code states that synchronous generation must have a droop capability of 3-5% [4], that is to say a change in frequency of 3-5% translates to a change in power output of 100%. It is also stated that the frequency should be kept between 49.8 and 50.2Hz, giving a droop requirement in normal operation of 8% of output power.
Three alternative strategies for providing the droop response are investigated. Simulations are completed using GL Bladed with two different wind turbine models – the Supergen 2MW Exemplar and the Supergen 5MW Exemplar. A summation of the strategies is provided in Figure 3.
All three strategies use an estimate of the equivalent wind speed that is generated within the PAC [2].
Figure 3: Alternative Strategies
If the PAC is turned off it will undergo a recovery phase during which the operating point of the turbine returns to the normal operating point. The PAC can only be turned on again once this process has completed, regardless of the wind speed. When the PAC is on, the total change in power requested is linked to the grid frequency by a simple relationship given by:
(2) where the offset is -8% of rated power, fdes is the desired grid frequency, f is the measured grid frequency and the factor k1 is equal to the offset divided by the maximum allowable frequency deviation (in this case 0.2Hz). If the wind speed rises above 14.5m/s for the 5MW machine or 15m/s for the 2MW machine then the offset is reduced to zero as the turbine is in above rated wind conditions. In these conditions it is possible to over-rate the machine to achieve the extra power required when the frequency drops. Using models reported in [5], it has been demonstrated, [6], that the torque demand to the converter in above rated conditions would need to be raised to as much as 120% of rated torque for up to 20 minutes before the temperature limits are reached. As such, over-rating the converter by a maximum of 8% for periods of time generally well under 20 minutes should be sustainable. The offset is reintroduced if the wind speed reduces below 12.5 or 13m/s for the 5MW or 2MW respectively.
The offset is set according to the strategies described below. Strategy 1 is the simplest option, with a constant offset of 8% of rated power in below rated conditions. If operating well below rated wind speed however, the required droop response is no longer 8% of the rated power, but 8% of the current power output of the turbine. Strategy 2 therefore introduces a lower offset and factor (k1) in lower wind speed conditions. This reduction in the offset and factor is used if the wind speed drops below 8m/s or 8.5m/s for the 5MW and 2MW machines respectively. If the wind speed subsequently rises above 9m/s for the 5MW or 9.5m/s for the 2MW machine, the original offset and factor are reintroduced. The wind speed at which this change occurs is chosen as the power output is approximately half of the rated output.
The idea of adding stepped levels of offset based upon wind speed can be extended so that the level of offset is directly linked to the wind speed. This is shown in strategy 3. Care must be taken to ensure that the control loop setting the offset is sufficiently slow to avoid adversely affecting the performance of the full envelope controller. Accordingly, the level of offset is only updated every 5 seconds.
4 Performance Assessment
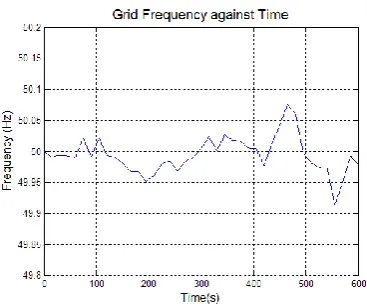
To test the performance, the controller is supplied with a typical grid frequency input sourced from the Balancing Mechanism Reporting System [7]. This is shown in Figure 4.
[image:3.595.322.506.561.713.2]Each strategy is tested and the performance assessed. Although the controller operates at a wind turbine level, it is intended for the droop response to be supplied from a wind farm. As such, for each strategy, the output averaged over five wind turbines is assessed. The farm size is limited to five turbines due to computational constraints.
Simulation results are shown for a range of wind speeds using either Supergen 5MW or Supergen 2MW turbines. For each wind speed and offset strategy, ten simulations were conducted, each with differing turbulence profiles, five with the PAC enabled and five with the PAC disabled. The actual change in power delivered could then be found by subtracting one from the other. Whilst tests were performed across the full operational envelope, for clarity only a sample of these simulations is presented.
Corresponding to the changes in grid frequency in Figure 4, the requested combined change in power is shown in Figure 5 together with the combined change in generated power for five 5MW wind turbines, each experiencing a turbulent wind speed at a mean of 18m/s over a 300 second period. The requested change in power and the delivered change in power are in good agreement. Note that at high wind speeds all three strategies have identical requirements for droop response and so this result can be seen as indicative of performance using any one of them.
Figure 6 shows the output of turbine 3 alone. It can be seen that the change in power output is noisier with one machine than with five combined. It should also be noted that the required Δβ from the PAC is small in high wind speeds (compared to a pitch angle from the full envelope controller of approximately 10 to 15 degrees). Whilst Δω is small in this case, it is accurate at mid to low frequencies.
Figure 7 again shows the change in output across five machines, this time the 2MW turbine following strategy 1 at a mean wind speed of 9.5m/s. In below rated wind conditions there is an offset when using strategy 1 of -0.17MW for the 2MW machine (a total of -0.85MW across the 5 turbines). The
[image:4.595.323.521.159.381.2]delivered change in power is noisier than in the above rated example. This is because there are larger variations in power output in below rated conditions.
Figure 5: Combined Change in Power across five 5MW Turbines at 18m/s Mean Wind Speed
Figure 6: Change in Power Output, Estimated and Actual Change in Generator speed, and Change in Pitch Angle for Turbine 3 at 18m/s
[image:4.595.316.522.420.620.2]Figure 7: Total Change in Power Output Across five 2MW Wind Turbines at 9.5m/s Mean Wind
Speed Following Strategy 1
An example of the output from one turbine is given in Figure 8. This shows the output with and without the PAC in operation for the same wind field. Small errors of the order of <1% of the generator speed in the estimate of Δω can result in changes in the timing of the full envelope controller. An example of this occurs at 295 seconds, where an error in Δω of <1% leads to a 1 second delay in the full envelope controller switching between modes of operation. This appears as a large spike when one output is subtracted from the other, most clearly seen in Figure 7. The spikes are not present in output power and are therefore not of concern.
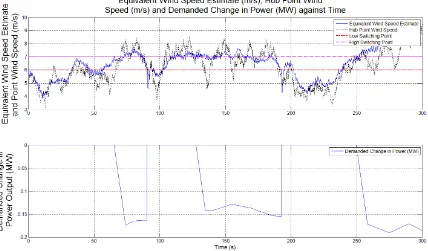
At wind speeds below 6m/s the PAC is switched off for all three strategies. It is only turned on again if the wind turbine has returned to its normal operating point and the estimated wind speed rises above 7m/s. This hysteresis prevents chattering from occurring. Figure 9 demonstrates this, showing the output from one wind turbine at a mean wind speed of 6.5m/s. The estimated wind speed does not rise above 7m/s until approximately 65 seconds. At this point the PAC switches on and a change in power output is requested. At approximately 90 seconds the wind speed drops below 6m/s and the PAC switches off again. Although the estimated wind speed rises above 7m/s at approximately 115 seconds, the wind turbine has not yet returned to normal operation. Only once it has done so,
with the wind speed still above 7m/s, does the PAC switch back on.
The hub point wind speed is shown for comparison with the estimate of equivalent wind speed from the PAC. There is a strong correlation. As expected, the point wind speed is more turbulent than the equivalent wind speed. Note that Bladed does not output an equivalent wind speed as it uses blade element momentum theory with a 3D turbulent wind field. The equivalent wind speed can be seen as an average wind speed across the rotor.
All three strategies dictate that the offset used becomes zero above a given wind speed. Figure 10 shows this for five 5MW wind turbines operating at mean wind speeds of 13.75m/s. It shows that despite this switching, the requested change in power is well matched by the change in power delivered.
Strategy 2 introduces a step change in the offset used by the wind turbine at half the rated power. An example of five 2MW machines following this strategy at a mean wind speed of 9.5m/s is shown in Figure 11. Again, the requested change in power is well matched by the delivered change in power despite the switching. Strategy 3 takes this idea a step further by constantly varying the offset and factor k1. The demanded and delivered change in power output from five 5MW turbines with a mean wind speed of 9.5m/s following strategy 3 in shown in Figure 12.
Figure 8: Power Output, Change in Power Output, Estimated and Actual Change in Generator Speed, and Pitch Angle for Turbine 3 at 9.5m/s Mean Wind Speed Following Strategy 1
[image:6.595.84.512.450.701.2]Figure 10: Change in Power Output for Five 5MW Wind Turbines at a Mean Wind Speed of 13.75m/s
Figure 12: Demanded and Delivered Change in Power Output – Five 5MW Turbine(s) with a Mean Wind Speed of 9.5m/s Following Strategy 3
Table 1: Percentage Reduction in Energy Capture
Wind Speed Distribution I (Mean 10m/s) II (Mean 8.5m/s) III (Mean 7.5m/s)
Strategy 1 2 3 1 2 3 1 2 3
[image:8.595.55.544.547.696.2]% Reduction in Energy Capture (2MW) 5.92 4.87 3.18 7.10 5.69 3.58 8.03 6.25 3.80 % Reduction in Energy Capture (5MW) 7.30 6.04 3.48 9.20 7.40 4.28 10.91 8.49 4.90 % Reduction in Energy Capture (Ave) 6.61 5.46 3.33 8.15 6.56 3.96 9.47 7.37 4.35
Table 2: Percentage Reduction in Tower Damage Equivalent Loads (DELs)
Wind Speed Distribution
I (Mean 10m/s) II (Mean 8.5m/s) III (Mean 7.5m/s)
Strategy 1 2 3 1 2 3 1 2 3
Turbulence Profile
High Low High Low High Low High Low High Low High Low High Low High Low High Low
% Change in DELs (2MW)
-0.025
0.25 -0.47 -0.25 -0.45 -0.47 -0.026
0.33 -0.52 -0.25 -0.5 -0.52 -0.029
0.38 -0.55 -0.24 -0.52 -0.53
% Change in DELs (5MW)
-0.38 -0.21 -0.65 -0.39 -0.54 -0.54 -0.45 -0.16 -0.69 -0.36 -0.59 -0.55 -0.46 -0.10 -0.70 -0.31 -0.60 -0.52
% Change in DELs (Average)
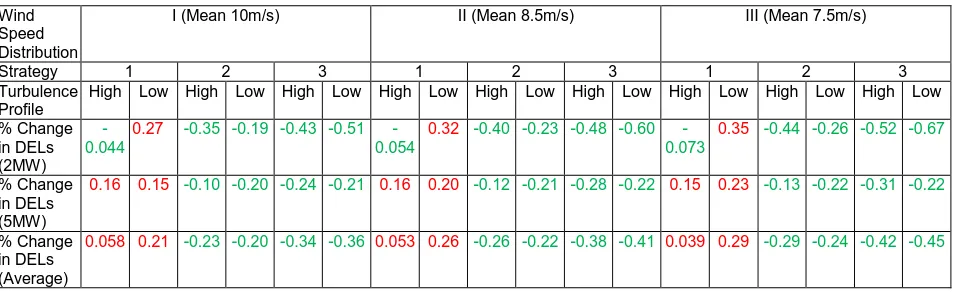
Table 3: Percentage Reduction in Blade Flap Root Damage Equivalent Loads (DELs)
Wind Speed Distribution
I (Mean 10m/s) II (Mean 8.5m/s) III (Mean 7.5m/s)
Strategy 1 2 3 1 2 3 1 2 3
Turbulence Profile
High Low High Low High Low High Low High Low High Low High Low High Low High Low
% Change in DELs (2MW)
-0.044
0.27 -0.35 -0.19 -0.43 -0.51 -0.054
0.32 -0.40 -0.23 -0.48 -0.60 -0.073
0.35 -0.44 -0.26 -0.52 -0.67
% Change in DELs (5MW)
0.16 0.15 -0.10 -0.20 -0.24 -0.21 0.16 0.20 -0.12 -0.21 -0.28 -0.22 0.15 0.23 -0.13 -0.22 -0.31 -0.22
% Change in DELs (Average)
0.058 0.21 -0.23 -0.20 -0.34 -0.36 0.053 0.26 -0.26 -0.22 -0.38 -0.41 0.039 0.29 -0.29 -0.24 -0.42 -0.45
As droop control may be used at all times when the wind turbine is producing power, it will have an effect on the fatigue loads. The Damage Equivalent Loads (DELs) for the 5MW and 2MW wind turbines, for both tower fore-aft moment and blade root bending moment, were therefore calculated for normal operation without the PAC. The calculations were then repeated using strategies 1, 2 and 3, and the percentage change in the DELs was calculated. The results are given in Table 2 and Table 3.
5 Discussion
The results show that the Power Adjusting Controller can be used to provide frequency droop control from variable speed wind turbines. Of the three different strategies investigated, strategy 3 is the best strategy for implementation as the droop response provided is 8% of the energy produced rather than 8% of rated power. This results in greater energy capture than the other strategies – a reduction of between 3.18% and 4.90% compared to normal operation contrasting with reductions between 4.87% and 8.49% compared to normal operation for strategy 2 and between 5.92% and 10.91% compared to normal operation for strategy 1.
It would be possible however to improve the energy capture by using wind farm control. A hierarchical structure, with a PAC on each wind turbine and a higher, farm level controller setting the value for ΔP for each turbine could be used. This would allow the farm level controller to measure the total power output of
the farm and adjust the ΔP values accordingly. This cannot be done on an individual turbine as the feedback loop would be too fast and would interfere with the turbine full envelope controller.
Another advantage of a farm control approach would be that the required ΔP total would not have to be distributed evenly. Turbines experiencing higher wind speeds could provide the majority of the power change for example. By distributing the power change intelligently the reduction in energy capture could be minimised. A further way to reduce losses would be to prioritise any required power offset to windward turbines, thereby increasing the wind speed experienced by any turbines in their wake.
It is worth noting that the grid frequency is kept between 49.9 and 50.1Hz in the UK >90% of the time (max standard deviation in 2012 to 2013 of 0.062 [9]). As such, the reduction in energy capture could be halved by providing droop control from half the turbines using double the k1 factor. Sensible precautions would be required within the farm level control to ensure that the extra power was available for the <10% of the time that the frequency moved outside of these bounds.
that droop control will always be provided; a worst case scenario for energy capture.
The changes in damage equivalent loads induced by use of the PAC for droop control are minimal, typically less than 1% for the tower and the blades. As such, it is expected that the PAC could be used without impacting the lifetime of the turbine.
6 Conclusions
A Power Adjusting Controller (PAC) has been developed that allows the power output of a wind turbine to be adjusted by a given input ΔP. By linking this input to the grid frequency the PAC can be utilised for the provision of droop control.
As the PAC does not alter the full envelope controller of the wind turbine it can be retrofitted to machines currently in use without affecting the normal operational performance.
Using the PAC for droop control necessarily reduces energy capture by between 3.18% and 10.91% compared to normal operation, depending upon the strategy chosen to supply droop control, the wind turbine used and the wind speed distribution. The fatigue loads on the tower and blades are changed by between -0.63% and 0.14% and between -0.45% and 0.29% respectively.
The wind farm modelled in this paper has just five wind turbines. A greater number of wind turbines would lead to less noise in the change in power output produced, giving greater accuracy in droop response.
The work presented in this paper focusses on control at a wind turbine level, however, it is expected that with the addition of wind farm level control there will be smaller reductions in energy capture and greater improvements in fatigue loads. This would be an excellent area in which to focus future work.
7 Acknowledgements
The authors wish to acknowledge the support of the EPSRC for the Supergen Wind Energy Technologies Consortium, grant number EP/H018662/1.
References
[1] Directive 2009/28/EC of the European Parliament and of the Council, 2009, pp 16-62, European Parliament.
[2] A. Stock and W. E. Leithead, “Sustainable Power Generation and Supply (Supergen) - Wind Energy Technologies Task 2.1.2 : Flexibility of Operation,” Strathclyde University, Glasgow, UK, 2014.
[3] A. Stock and W. E. Leithead, “Providing Grid Frequency Support Using Variable Speed Wind Turbines with Augmented Control,” in Scientific Proceedings of the European Wind Energy Association Conference,Copenhagen, Denmark, April 16-19, 2012, pp. 152–156.
[4] National Grid, “The Grid Code - Issue 5 Revision 6,” 2013.
[5] T. Lei, M. Barnes, and A. C. Smith,
“Thermal cycling evaluation for DFIG wind turbine power converter based on joint modelling,” IEEE Energy Convers. Congr. Expo., 2013, pp. 3845–3851.
[6] T. Lei and M. Barnes, “Supergen Wind Phase 2 - Analysis of Wind Turbine Power Converter Thermal Cycling,”, Manchester University, UK, 2013.
[7] “Balancing Mechanism Reporting System.” [Online]. Available: www.bmreports.com. [Accessed: 15-Dec-2013].
[8] International Electrotechnical Commision, “International Standard IEC 61400-1 Third Edition.”, 2005.