Linking
storylines
with
multiple
models:
an
1
interdisciplinary analysis of the UK power system
2
transition
3
4
Authors: 5
Evelina Trutnevytea*, Neil Strachana, John Bartonb, Áine O’Gradyc, Damiete
6
Ogunkunled, Danny Pudjiantoe, Elizabeth Robertsonf
7 8
a University College London, UCL Energy Institute, 14 Upper Woburn Place,
9
London WC1H 0NN, United Kingdom 10
b Loughborough University, Leicestershire LE11 3TU, United Kingdom
11
c University of Bath, Department of Mechanical Engineering, Bath BA2 7AY,
12
United Kingdom 13
d University of Surrey, Centre For Environmental Strategy, Guildford GU2 7XH,
14
United Kingdom 15
e Imperial College London, South Kensington, London SW7 2AZ, United Kingdom
16
f University of Strathclyde, Royal College Building, 204 George Street, Glasgow G1
17
1XW, United Kingdom 18
19
* Corresponding author ([email protected], phone +44 203 108 5924) 20
21
Email addresses of the co-authors: 22
[email protected], [email protected], a.o’[email protected], 23
Abstract 28
State-of-the-art scenario exercises in the energy and climate change fields argue 29
for combining qualitative storylines with quantitative modelling. This paper 30
proposes an approach for linking a highly detailed storyline with multiple, 31
diverse models. This approach is illustrated through an interdisciplinary analysis 32
of the increased role of the government in shaping the UK power system 33
transition until 2050. The storyline, called Central Co-ordination, is linked with 34
insights from six power system models and two appraisal techniques. First, the 35
storyline is ‘translated’ into harmonised assumptions that can be used by these 36
models. Then, the concept, called the landscape of models, is introduced. This 37
landscape helps to map the key fields of expertise of individual models. The 38
storyline is then assessed based on the results of the models and appraisals. It is 39
shown that the storyline is important for transmitting information about the 40
governance arrangements and the choices of key actors. However, the storyline 41
is fragile in light of modelling results and can be improved on this basis. To the 42
best of the authors’ knowledge, this is the first structured attempt to bring 43
together such diverse range of models for fleshing out a storyline. The proposed 44
approach could thus be useful for other interdisciplinary analyses. 45
46
Keywords 47
Scenarios, storylines, quantitative models, energy, climate change, 48
interdisciplinary, transition pathways 49
Highlights 52
Linking qualitative storylines with multiple, diverse quantitative models 53
Landscape of models for mapping the fields of expertise of individual 54
models 55
Interdisciplinary analysis of the UK power system transition until 2050 56
57
Graphical abstract 58
1. Introduction 61
Scenario exercises in energy, climate change and other technology- and 62
environment-related studies are based on qualitative storylines, quantitative 63
models or, often, on a combination of both [1-6]. Storyline-based scenarios are 64
expressed as qualitative narratives that in length may range from brief titles to 65
very long and detailed descriptions. Examples of such scenarios are the Tyndall 66
decarbonisation scenarios [7, 8], the CLUES decentralised energy scenarios [9] or 67
the energy visions in Switzerland [10, 11]. The value of such storylines is 68
threefold [2, 4, 12-14]. First, when these storylines are developed through 69
engagement of experts and stakeholders, they combine multiple perspectives 70
and sources of expertise [2]. They may lead to novel and creative ways of 71
thinking about the future that go beyond modelling insights. Second, storylines 72
are key for communicating the results of scenario exercises. Due to their 73
qualitative nature, they are accessible and memorable to a broad range of 74
audiences. When developed through stakeholder engagement, they are likely to 75
be accepted, supported and used more often [15]. Third, storylines represent a 76
much broader picture than quantitative models and encapsulate a number of 77
softer and subtler aspects that cannot yet be modelled [16]. Storylines thus can 78
form the input assumptions to the quantitative models and embed these models 79
into a bigger picture [17, 18]. However, storylines have two key limitations. First, 80
storylines alone at times may be detached from reality as even experts can have 81
a limited understanding of whether a particular storyline is feasible [10, 11, 15]. 82
Second, as storylines are developed by combining multiple views of experts and 83
stakeholders, they can be considered biased, not reproducible and not 84
transparent [2]. Despite the current research on formal techniques for 85
developing better storylines [5, 12, 19-21], these limitations still remain. 86
Quantitative models-based scenarios are produced by a single or multiple 87
models, such as in the ADAM [22], Energy Modelling Forum [23], Low Carbon 88
Society modelling [24] and NEEDS [25] projects. The key strength of these 89
scenarios is that they satisfy the inherent need for numeric values in the 90
technology- and environment-related fields [2, 10, 14, 15]. Models are based on 91
the actual data, laws of physics, principles of economics and state-of-the-art 92
reviewed, transparently documented models provide rigorous, internally 94
consistent scenarios. However, models can address only a limited number of 95
aspects, such as technology, economic, environmental aspects. But they still have 96
difficulty in capturing the afore-mentioned softer and subtler aspects. The key 97
research tendencies are towards developing more detailed models and including 98
softer aspects, such as behaviour and governance, into models [17, 26]. Yet, even 99
better models alone can hardly offer the breadth and engaging nature of the 100
storyline-based scenarios. 101
In light of these strengths and weaknesses of storylines and quantitative 102
models, state-of-the-art scenario studies argue for combining them [1-6]. Many 103
recent scenario exercises already have the elements of both: storylines include 104
numbers, while modelling outputs are described in short qualitative narratives. 105
Several scenario exercises explicitly combine the storylines and the quantitative 106
models in an iterative manner [6, 10, 11, 27-29]. Examples of these include key 107
international scenario exercises: the integrated climate change scenarios of the 108
Intergovernmental Panel of the Climate Change [30, 31], the scenarios of 109
ecosystem services in the Millennium Ecosystem Assessment [32] and of the 110
global environment in the Global Environmental Outlook [33]. This approach is 111
thus also used for analysing the UK power system transition pathways until 2050 112
in the Realising Transition Pathways (RTP) project. 113
The RTP project is a continuation of the original Transition Pathways 114
project. Grounded in the conceptual framework of socio-technical transitions 115
[34], the original Transition Pathways project combined historical and future-116
oriented, technical, environmental and social perspectives into an 117
interdisciplinary analysis of the future UK power system transition [35-37]. 118
Three transition pathways—Central Co-ordination, Market Rules and Thousand 119
Flowers—were elaborated in this preceding project [37, 38]. Every of the three 120
transition pathways encapsulated a storyline (or a narrative), its quantitative 121
representation (a scenario) as well as a range of additional analyses, such as the 122
analyses of branching points and actors’ choices and power system modelling. In 123
the succeeding RTP project, a structured process was envisioned and 124
models, available in the RTP project. This process is reported here for one of 126
these storylines, namely Central Co-ordination. 127
Despite the fact that combination of storylines and quantitative models 128
starts emerging as an established practice in the technology- and environment-129
related fields [1-6], existing literature runs short in providing methodological 130
insights for how to link such storylines with multiple models. First, the RTP 131
storylines are very detailed (four to five pages) and numerous additional 132
assumptions are needed to ‘translate’ them into model parameters. Second, there 133
are six power system models and two appraisal techniques available in the 134
project. They are very diverse and differ in their disciplinary perspective 135
(technical feasibility, economic or environmental appraisal), model objective, the 136
parts of the power system addressed and the format of inputs and outputs. This 137
diversity is valuable because the storylines can be addressed from multiple 138
angles, but it is challenging to relate such diverse models to each. Thus, a new 139
approach had to be developed for linking such detailed storylines with multiple, 140
very diverse models. To the best of the authors’ knowledge, this is the first 141
structured attempt to bring together such diverse range of models for fleshing 142
out a storyline. Although it is the first attempt, it is highly relevant. There is a 143
growing number of similar interdisciplinary projects, like the RTP project [39]. It 144
can be expected that many of these projects will attempt to develop scenarios by 145
linking storylines with multiple models. Pulling together a number of existing 146
models is a challenge in itself, in addition to their linking with the storylines. This 147
paper provides some methodological insights for organising these processes. 148
This paper is laid out as follows: Section 2 provides the essential 149
background about the UK power system, the RTP project, the Central Co-150
ordination storyline and the models and appraisals; Section 3 introduces the 151
process used for linking the storyline with the multiple models; Section 4 152
discusses the results and the process; Section 5 concludes. 153
154
2. The case of the UK power system transition 155
156
In the 1990s the UK underwent a major process of liberalisation of its 158
power market and privatisation of its companies [40, 41]. With about three 159
quarters of power produced in fossil fuel-based plants, this market-led approach 160
came under significant pressure in the last decade due to growing climate change 161
concerns. The UK government undertook several key interventions. In 2008 the 162
UK adopted the Climate Change Act, supported by all major political parties, 163
which sets a legally binding target to cut the country’s greenhouse gas emissions 164
by 80% by 2050 as compared to the emission levels of 1990. In line with [42], 165
the major decarbonisation of the power sector, together with substantial levels 166
of electric heating and transport, are seen as the key measures to reach this 167
target. However, replacement of the aging coal and nuclear power plants and 168
significant investments in transmission and distribution requires massive 169
investment. An increased deployment of renewable energy sources raises 170
concerns over their intermittency and, thus, supply security. Therefore, this 171
decarbonisation challenge does not stand alone and is a part of the so-called 172
energy policy ‘trilemma’ of decarbonisation, affordability and supply security 173
[37, 43]. The Energy Bill, released in 2012, and especially its part on Electricity 174
Market Reform, attempts to mediate between these three corners of the 175
‘trilemma’ [44]. The Energy Bill aims to set a policy framework for the power 176
system transition that meets the ‘trilemma.’ 177
In light of these developments, the RTP project aims to shed light on the 178
potential transition pathways of the UK power system until 2050. Three 179
transition pathways were developed: Central Co-ordination, Market Rules and 180
Thousand Flowers [37, 38]. Compared to other scenario exercises in the UK [7-9, 181
45] and elsewhere, these pathways are novel because they include storylines 182
that specifically focus on the role of governance ‘logics’ and multiple actors in 183
actively shaping the power system transition. Traditionally in scenario studies, 184
storylines are used for representing key uncertainties such as population 185
growth, technological development and others, c.f. [30-33]. The RTP storylines 186
explicitly focus on the uncertainty around governance ‘logics’ and the choices of 187
actors. 188
The process of developing of these three storylines is described in detail 189
Transition Pathways project in a stakeholder workshop in 2008. The technical 191
feasibility, social acceptability and the sustainability of the first version of the 192
storylines were then interrogated in further workshops with experts and key 193
stakeholders, who represented energy companies, policy-makers and non-194
governmental organisations. This interrogation led to the revised version 2.1 of 195
the pathways, which is currently the latest version. The complete storylines are 196
available online at [38] and shorter summaries are published in [37]. Every 197
storyline consists of four to five pages of qualitative description, a list of key risks 198
for the realisation of the specific storyline and an overview table. Afterwards, a 199
Transition Pathways Technical Elaboration Working Group was set up from the 200
experts in the project in order to assign a quantitative representation for every 201
storyline. This quantitative representation shows the numeric values of the total 202
UK power demand and the power generation mix until 2050 [37]. This process, 203
however, was partly informed by insights from three models, but none of these 204
models were informed by economic considerations [37]. In the succeeding RTP 205
project, there are more models available, of which some include the economic 206
considerations. Therefore, a more structured process was undertaken for linking 207
the storylines with insights from multiple models. In so doing it will show how 208
iteration between storylines and models can fruitfully enhance the process of 209
developing and analysing the broader transition pathways. 210
211
2.2. The Central Co-ordination storyline 212
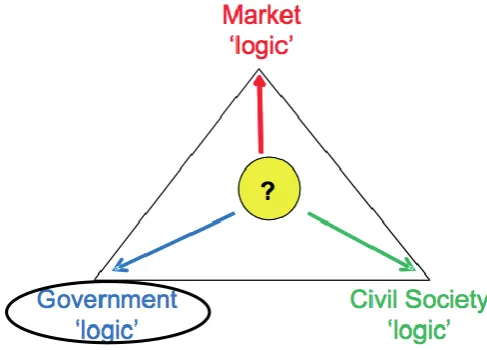
The Central Co-ordination storyline, analysed in this paper, is one of the 213
three storylines of the RTP project: Central Co-ordination, Market Rules and 214
Thousand Flowers. These storylines respectively picture three ideal types of 215
governance ‘logics’ in the UK power system (Figure 1): government, market and 216
civil society ‘logics’. The different groups of actors are assumed to frame their 217
view and enrol the other actors into their ‘logic’ [37]. In the case of the Central 218
Co-ordination storyline, the central UK government argues for the dominant role 219
of the direct co-ordination and the national government actors to deliver the 220
energy policy goals. In the Market Rules storyline, the market actors argue that 221
the energy ‘trilemma’ is best achieved by the large power companies and other 222
made by the large power companies on the basis of investment return (including 224
carbon price effects), available knowledge, regulatory framework and incentives 225
set by the government, will determine the power system transition. The 226
Thousand Flowers storyline argues that civil society shall take an active role in 227
delivering the low-carbon transition as small-scale solutions through 228
community-led initiatives and energy service companies (ESCOs). The key recent 229
developments in the UK power sector are described as a hybrid between the 230
Central Co-ordination and the Market Rules storylines [46]. Since the power 231
market liberalisation in 1990s, the market ‘logic’ has been dominating in the UK, 232
but the influence of the government ‘logic’ is increasing in the recent years, 233
especially after the adoption of the legally binding emissions target. The Central 234
Co-ordination storyline is therefore chosen for in-depth analysis in this paper. 235
[image:9.595.170.414.332.507.2]236
Figure 1. The three ideal types of governance ‘logics’ in the UK power system 237
transition. Source: J. Burgess and T. Hargreaves. The figure is reproduced from 238
[37]. 239
240
In the Central Co-ordination storyline, the central UK government will 241
actively shape the power system transition through the establishment of 242
Strategic Energy Agency. This agency will issue tenders for tranches (central 243
contracts) for particular types of low-carbon generation and develop ‘technology 244
push’ programmes for low-carbon technologies. In order to promote UK 245
industry, the agency will primarily support those technologies where the UK has 246
and tidal power), carbon capture and storage (CCS) and electric vehicles. This 248
strong government commitment will underwrite the investment risks for the 249
large power companies. These companies will invest according to the 250
government’s plans and deliver the transition, dominated by large-scale power 251
generation. The government will focus on removing the system-wide blockages, 252
such as the lack of transmission capacity, planning issues, supply chains and 253
skills. As a result, the emission mitigation target of 80% by 2050, as compared to 254
the year 1990, will be achieved. As noted, civil society will remain a relatively 255
passive player in this storyline. Initially, only non-behavioural measures of 256
demand response will be used, such as increased efficiency standards for 257
appliances and newly built buildings. Later, with the increased industrial and 258
climate benefits, the interventions on the lifestyles and behaviour will be 259
undertaken by the government. The key risks, identified in the storyline for the 260
realisation of this transition, are the (i) technical and economic feasibility of CCS, 261
(ii) public opposition to costly low-carbon investment due to increased 262
household expenditure, (iii) little effort to incentivise behaviour change of the 263
energy users. The more detailed storyline is also provided in Table 2, where this 264
storyline is linked with six models and two appraisals. In addition to the 265
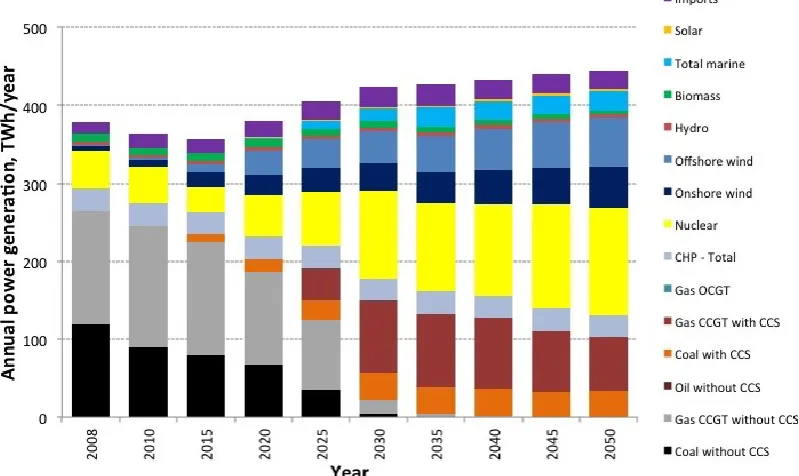
qualitative narrative, the Central Co-ordination storyline was already assigned an 266
initial quantitative representation (Figure 2), developed in an iterative process 267
by the Transition Pathways Technical Elaboration Working Group. 268
270
Figure 2. The initial quantitative representation of the Central Co-ordination 271
storyline. Source: Transition Pathways project.The figure is reproduced from 272
[37]. 273
274
2.3. Eight models of the RTP project 275
This section describes the six power system models and two appraisal 276
frameworks (also called ‘models’) that were linked in this paper to the Central 277
Co-ordination storyline. These models are very diverse and this diversity is a 278
strong point as there is not a single best model or methodology that encapsulates 279
all the relevant aspects [16]. The RTP leadership envisioned a multi-model 280
analysis, expecting that this analysis, rather than results of a single model, has 281
potential to provide a broader spectrum of insights. 282
The eight models used are (in the order of the breadth of the power 283
system boundaries): 284
Demand: The energy demand model, developed at the University of 285
Surrey, is a bottom-up model of the UK power demand in the domestic 286
and non-domestic sectors. Due to its highly disaggregated structure, 287
the influence of a range of parameters can be modelled, such as the 288
energy service levels, user practices, choices of appliances, building 289
model is based on the synthesis of existing estimates [47-49] and the 291
assumptions from the Central Co-ordination storyline. 292
FESA: The Future Energy Scenario Assessment model [50, 51], 293
developed at the Loughborough University, is a single-year UK power 294
generation and demand model, incorporating one-hour time step for 295
dispatch modelling and using real weather data of temperature, wind 296
speeds, wave height and solar radiation. The model develops 297
scenarios on the basis of the Central Co-ordination storyline and 298
technical feasibility constraints. 299
D-EXPANSE: The D-EXPANSE model (Dynamic version of EXploration 300
of PAtterns in Near-optimal energy ScEnarios), developed at the 301
University College London, has the structure of a bottom-up power 302
system model. In addition to the cost optimisation, D-EXPANSE 303
systematically explores the maximally different near-optimal 304
pathways [15, 29, 52, 53]. In this way, D-EXPANSE aims to open up the 305
understanding of the fundamentally different ways how the UK power 306
system could evolve. By allowing the deviation from the cost-optimal 307
pathway, D-EXPANSE also explores the structural uncertainty around 308
the concept of rationality and cost-optimisation. The D-EXPANSE 309
model has been validated by comparing its outputs with the results of 310
existing, well-established whole system models and cost estimates for 311
the UK [53]. 312
EconA: The Economic Appraisal (EconA), conducted by University 313
College London, aims to evaluate the investment needed, costs, 314
benefits and the related risks and uncertainties of the transition 315
pathways. The EconA is an appraisal technique; it takes the 316
quantitative representation (Figure 2) of the Central Co-ordination 317
storyline and appraises it. In this paper, the Econ A is also considered 318
as a model in a broader sense. 319
BLUE-MLP: The BLUE-MLP model (Behaviour Lifestyles and 320
Uncertainty Energy model with Multi-Level Perspective on 321
transitions) is a probabilistic systems dynamic simulation that 322
behavioural elements [54, 55]. These behavioural elements include 324
market heterogeneity, intangible costs and benefits, hurdle rates, 325
replacement and refurbishment rates and demand elasticities. In 326
addition, the model links these behavioural uncertainties with the 327
multi-level perspective to transitions [34], where landscape 328
(government decisions and the international context), regime (the 329
current UK power system structure and its regulation) and niche 330
innovations (lifestyle influenced changes in demand) interact with 331
each other. 332
EEA: The Energy and Environmental Appraisal (EEA) is conducted by 333
the University of Bath [56, 57]. It aims to evaluate the ‘whole system’ 334
(from cradle to gate) greenhouse gas emissions and other 335
environmental impacts, such as human toxicity, particulate matter 336
formation and agricultural land occupation. Similarly to the EconA, the 337
EEA framework is a model in a broader sense as it appraises the 338
Central Co-ordination storyline, based on its initial quantitative 339
representation (Figure 2). 340
HESA/UK+: This is a combination of the Hybrid Energy System 341
Analysis tool (HESA) and the Strathclyde UK+ models that were 342
developed at the University of Strathclyde [58-60]. Strathclyde UK+ 343
model contains all the information for the transition pathways 344
scenarios with spatial disaggregation (17 onshore, five offshore zones 345
and 39 connections) of generation, storage, transmission and 346
distribution. It is linked to the HESA model, which cost-optimises the 347
system, based on the energy hub concept [61, 62]. The national power 348
demand and generation mix are used as input assumptions. 349
HAPSO: The Holistic Approach to Power System Optimisation model 350
(HAPSO) is developed at the Imperial College London. It is a bottom-351
up, cost-minimisation model that determines the optimal generation, 352
energy storage, transmission, and distribution network infrastructure 353
requirements and their associated cost to achieve the objectives: 354
economic efficiency, security, sufficient system controllability. The 355
term operating decisions including hourly generation dispatch, 357
Demand Side Response, storage cycles, and power exchanges taking 358
into account the impact of decisions across all sectors in power system 359
[63]. The UK power system is embedded in the European power 360
system including UK, Ireland and continental Europe and thus allows 361
for modelling of the power exchange across these regions. 362
363
Understanding and mapping the breadth and depth of the expertise of 364
every individual model in a multi-model analysis is challenging, especially given 365
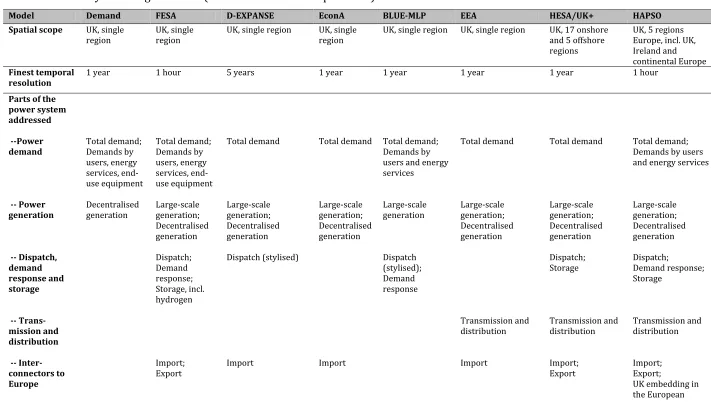
such a diverse set of models. Here this mapping is attempted in two ways. First, 366
Table 1 lists the key characteristics of the models. Based on that, the key field of 367
expertise is identified for every model. This key field of expertise is the types of 368
insights that a particular model analyses in most depth, as compared to the other 369
seven models. This concept of the key field of expertise thus appreciates the 370
distinct value of every model in this multi-model analysis. 371
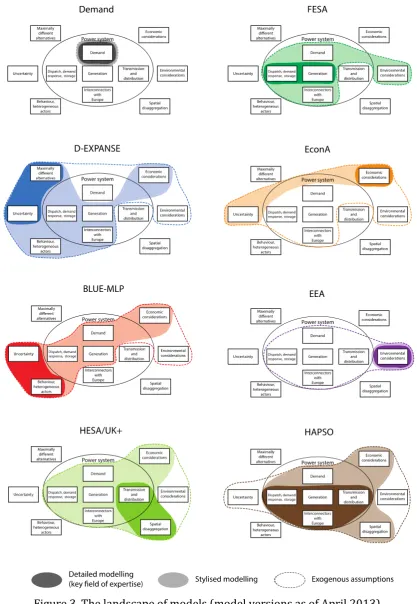
Second, Figure 3 provides a visual mapping of the eight models; this map 372
is called the landscape of models. It aims to summarise the information about 373
the breadth and depth of the analysis, done by every model, and to show how 374
these fields of expertise overlap between the models. This mapping is done on 375
the basis of the parts of the power system addressed (demand; generation; 376
dispatch, demand response and storage; transmission and distribution; and 377
interconnectors with Europe) and other thematic considerations addressed by 378
the model (analysis of the maximally different alternatives; uncertainty; 379
behaviour and heterogeneity of actors; economic considerations; environmental 380
considerations; and spatial disaggregation). These thematic considerations are 381
specific to this analysis and might differ for analyses with other sets of models. 382
The depth of analysis is defined in three categories: detailed modelling (the key 383
field of expertise), stylised modelling and exogenous assumptions only. 384
Both Table 1 and Figure 3 help to show that the eight models, used in this 385
analysis, cover a broad spectrum of insights. To some extent these models 386
overlap. If models overlap, then they can validate each other and help cross-387
checking the results. Every model, however, always has at least one area where it 388
no single best model that covers all the aspects in depth; all of the eight models 390
are useful as none of them alone covers all the relevant aspects in depth. The 391
concept of the key field of expertise of every model is thus especially useful here. 392
It shows which conclusions of which model shall be prioritized over the 393
conclusions of other models. The conclusions that are derived from the key fields 394
of expertise of a specific model shall be weighted more than the conclusions on 395
the same topic of the other models. 396
Table 1. Summary of the eight models (model versions as of April 2013) 398
Model Demand FESA D-EXPANSE EconA BLUE-MLP EEA HESA/UK+ HAPSO
Spatial scope UK, single
region UK, single region UK, single region UK, single region UK, single region UK, single region UK, 17 onshore and 5 offshore regions
UK, 5 regions Europe, incl. UK, Ireland and continental Europe
Finest temporal
resolution 1 year 1 hour 5 years 1 year 1 year 1 year 1 year 1 hour
Parts of the power system addressed
--Power
demand Total demand; Demands by users, energy services, end-use equipment Total demand; Demands by users, energy services, end-use equipment
Total demand Total demand Total demand; Demands by users and energy services
Total demand Total demand Total demand; Demands by users and energy services
-- Power
generation Decentralised generation
Large-scale generation; Decentralised generation Large-scale generation; Decentralised generation Large-scale generation; Decentralised generation Large-scale
generation Large-scale generation; Decentralised generation Large-scale generation; Decentralised generation Large-scale generation; Decentralised generation -- Dispatch, demand response and storage Dispatch; Demand response; Storage, incl. hydrogen
Dispatch (stylised) Dispatch (stylised); Demand response
Dispatch;
Storage Dispatch; Demand response; Storage
-- Trans-mission and distribution
Transmission and
distribution Transmission and distribution Transmission and distribution
-- Inter-connectors to Europe
Import;
Export Import Import Import Import; Export Import; Export;
Model Demand FESA D-EXPANSE EconA BLUE-MLP EEA HESA/UK+ HAPSO
system
-- Non-electric parts of the energy system Non-electric heating Non-electric heating; Non-electric transport Non-electric heating; Non-electric transport; Non-electric industrial and commercial uses Non-electric heating Method for constructing alternative pathways (scenarios) Modifying the assumptions according to the storylines Modifying the assumptions according to the storylines; Merit order of power generation
Cost-optimisation and evaluation of maximally different near-optimal pathways
Input from
other models Dynamic simulation Input from other models Cost-optimisation Cost-optimisation
Economic
considerations Cost-optimisation; Exploration of
near-optimal pathways
Post hoc
assessment Dynamic simulation, given the
heterogeneous sensitivity of the different actors to costs
Cost-optimisation Cost-optimisation
Environmental
considerations Post hoc assessment; Operational emissions (from primary energy use); Only CO2 emissions
Emission constraint; Operational emissions;
Only CO2 emissions
Input from
other models Post hoc assessment; Operational emissions; Only CO2 emissions Post hoc assessment; ‘Whole system’ emissions (upstream and operational); Greenhouse gas emissions (CO2eq); Human toxicity; Particulate matter; Agricultural land occupation Post hoc assessment; Operational emissions; Only CO2 emissions
Emission constraint; Operational emissions;
Model Demand FESA D-EXPANSE EconA BLUE-MLP EEA HESA/UK+ HAPSO Treatment of
uncertainty Structural uncertainty around
cost-optimisation; Parametric uncertainty accommodated to some extent through maximally different, near-optimal pathways
Parametric uncertainty considered through ranges for uncertain parameters
Parametric uncertainty considered through probabilistic modelling
Parametric uncertainty considered through sensitivity analysis
Treatment of behaviour and heterogeneity of actors
Considered to some extent through deviations from cost-optimal pathway
Detailed modelling
Key field of
expertise Demand Dispatch, demand response and storage; Generation
Maximally different alternatives; Uncertainty
Economic
appraisal Uncertainty; Behaviour and heterogeneity of the actors
Energy and environmental appraisal
Transmission and distribution; Generation; Spatial disaggregation
Dispatch and demand response; Generation; Transmission and distribution; Interconnectors
401
Figure 3. The landscape of models (model versions as of April 2013) 402
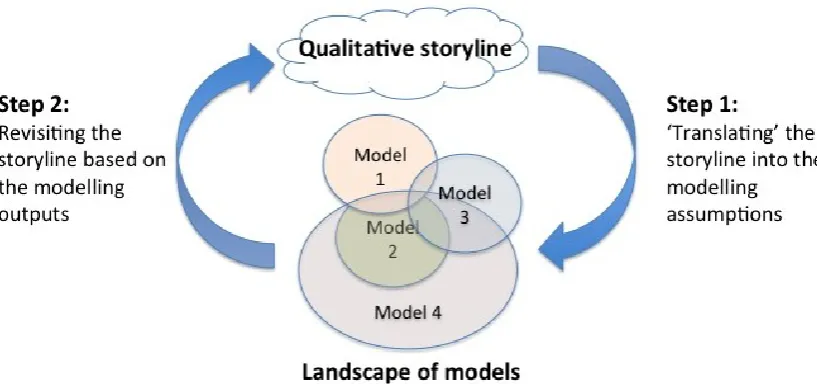
3. The process of linking the storyline with the multiple models 404
405
This Section describes the process (Figure 4) of linking the Central Co-406
ordination storyline with the insights from the eight models. First, the qualitative 407
storyline is ‘translated’ into a set of harmonised assumptions that are necessary 408
for conducting the model runs, specifically tailored for this storyline (Section 409
3.1). The models are then run with these harmonised assumptions. Second, the 410
outputs from the models are used for revisiting the qualitative statements of the 411
storyline (Section 3.2). Generally, neither the storyline nor the multiple models 412
are fixed; they are all being updated given the new developments in the real 413
world, new data sources, feedback from peer review and so on. Thus, in line with 414
[2], the process from Figure 4 is repeated iteratively for updating the storyline. 415
416
[image:20.595.96.505.347.539.2]417
Figure 4. The iterative process of linking storylines with multiple 418
quantitative models 419
420
3.1. Step 1: ‘Translating’ the storyline into the modelling assumptions 421
‘Translating’ such a detailed storyline Central Co-ordination [37, 38] into a 422
set of harmonised assumptions that will be used by the models is a challenging 423
task. On the one hand, these harmonised assumptions will already be a narrower 424
representation of this qualitative storyline that is rich in detail. This is 425
reasonable as quantitative models always represent only a part of the bigger, 426
should not be too narrow and should allow enough flexibility for the quantitative 428
models to express their perspective and to make their distinct contributions. 429
Every model has a broad range of other, model-specific assumptions. As the 430
multiple models used for this analysis are very diverse, it is desirable to 431
harmonise the list of the assumptions so that they could be implemented in all of 432
the models. As a result, there are a lot of possible variations and a certain share 433
of subjectivity involved in the process how a storyline is ‘translated’ into the 434
model assumptions. 435
For translating the Central Co-ordination storyline into the harmonised 436
modelling assumptions, several key aspects of this storyline are taken. These 437
aspects are: (i) a mild growth of the power demand due to the incentives for end-438
use energy efficiency, (ii) the increased use of large-scale low-carbon 439
technologies, especially of those where UK industry could take a global lead, and 440
a medium uptake of decentralised generation, (iii) the achievement of the 441
emission mitigation goals and (iv) low risk of investment due to the tenders for 442
tranches, issued by the Strategic Energy Agency. More specifically, the models 443
are tuned to match these harmonised assumptions as closely as possible: 444
i. Total power demand in the UK: 445
- In 2020, the total power demand, including losses, stabilises at 350 446
TWh/year; 447
- In 2030, it increases to 390 TWh/year due to increased electric 448
heating and electric vehicles; 449
- In 2050, it is equal to 410 TWh/year. 450
ii. Power generation mix in the UK: 451
- In 2020, 40% of the produced power comes from low-carbon sources, 452
prioritising coal CCS, nuclear and renewable sources. At least 25% of 453
the produced power comes from renewable sources, such as offshore 454
and onshore wind, wave, tidal barrage and tidal stream. 455
- In 2030, the power generation mix bridges the mixes of 2020 and 456
2050. 457
- In 2050, 75% of total produced power comes from large-scale low-458
carbon sources, such as nuclear, coal and gas CCS, offshore wind, 459
carbon decentralised sources, such as onshore wind and biomass 461
combined heat and power (CHP) plants. 462
iii. Greenhouse gas emissions: 463
- In 2020, the average carbon intensity in the whole UK power system is 464
300 gCO2/kWh of power produced;
465
- In 2030, this value drops to 30 gCO2/kWh;
466
- In 2050, it is as low as 20 gCO2/kWh.
467
iv. Investment: 468
- Social discount rate of 3.5% is used for the calculation. 469
470
Not all of the eight models can implement all of these harmonised 471
assumptions. First, the Demand, FESA models and EEA cannot consider the last 472
assumption about the discount rate as they do not consider costs at all. They, 473
therefore, by-passed this assumption, but implemented the remaining 474
assumptions. Second, the EconA and EEA are appraisal techniques and require 475
inputs about the whole power demand structure and generation mix rather than 476
modelling assumptions. Thus, the EconA and EEA are conducted on the basis of 477
the initial quantitative representation of the storyline (Figure 2), which is in line 478
with the harmonised assumptions described above. 479
480
3.2. Step 2: Revisiting the storyline based on the modelling outputs 481
The qualitative statements from the Central Co-ordination storyline are 482
scrutinised from the perspective of the outputs of every model. The storyline 483
pictures the governance arrangements and the role of the different actors and 484
these can hardly be interrogated by the models. But the description of the 485
outputs of these different governance arrangements and the actors’ decisions is 486
analysed. For example, the statement “In the financial budget statement in April 487
2009, the UK Government formally adopts carbon budgets for the periods 2008-488
12, 2013-17 and 2018-22 based on a 34% reduction in greenhouse gas (GHG) 489
emissions by 2020 from 1990 levels” [38, p. 1] is not analysed as it describes the 490
intention of the government. But, the statement “This is realised by the 491
achievement of 25% of electricity to be generated from renewables by 2020” [38, 492
plays an important role here as it helps to highlight the key fields of expertise of 494
every model. In this way, it becomes possible to prioritise the models in 495
scrutinising the specific aspects of the storyline, such as the demand, generation, 496
economic appraisal and so on. 497
498
4. Results and discussion 499
500
4.1. Revisiting the Central Co-ordination storyline 501
Table 2 presents the summarized results of revisiting the Central Co-502
ordination storyline from the perspective of the eight RTP models; detailed 503
results are available in the Electronic Supplementary Material. Every qualitative 504
statement about the outcomes of the governance and actor choices, specified in 505
the storyline, is compared and contrasted with the modelling results. 506
From the perspective of these eight models, the Central Co-ordination 507
storyline is fairly robust (as there are few red cells in Table 2). It can be seen that 508
the storyline is almost completely supported by the Demand, FESA and 509
HESA/UK+ models. This is no surprise because these three models specialise in 510
technical feasibility assessment of the power system transitions. These models 511
can be tailored to mimic the storyline and identify only the key mistakes of 512
technical feasibility. Moreover, the researchers, who work with these models, 513
played an active role in the Technical Elaboration Working Group in the original 514
Transition Pathways project. Thus, the storyline is already partly informed by 515
these models and it is not surprising that there is no divergence. The majority of 516
the diverging insights come from the BLUE-MLP, HAPSO and D-EXPANSE models. 517
These models include a broader range of considerations than technical feasibility 518
(Table 1): heterogeneous behaviour of the key actors, uncertainty, detailed 519
dispatch modelling and maximally different alternatives. Thus, naturally these 520
models question the Central Co-ordination storyline more. 521
Although the results from the eight models are in line with most 522
statements of the Central Co-ordination storyline, several clusters of diverging 523
insights are identified. First, the storyline described only a mild increase in the 524
total power demand (20% higher in 2050 as compared to 2008) due to energy 525
shows that, when the heterogeneity of the behaviour of the different actors is 527
considered, maintaining slow power demand growth through the entire model 528
horizon appears rather wishful thinking. Storylines developed by the various 529
stakeholders and experts often tend to be overly optimistic and fragile from the 530
modelling perspective [10, 11]. This remark is also consistent with a broader 531
argument that failures of effectively mitigating climate change can be expected 532
[64]. The Central Co-ordination storyline envisions a passive role of the civic 533
society. Without the voluntary energy saving action of the civil society, drastic 534
demand reduction may be challenging to achieve. The UK government could 535
enforce some types of measures for mitigating the power demand, such as smart 536
meters, efficient domestic appliances or refurbishment of buildings. But in a 537
democratic society, a rapid and massive implementation of such measures may 538
be problematic. Thus, the expectation from the storyline about the demand 539
needs to be revisited. 540
The Central Co-ordination storyline aspired to the retirement of existing 541
coal and gas power plants by 2037 and their replacement with low-carbon 542
technologies, such as renewable energy sources or gas and coal with CCS. 543
However, both the D-EXPANSE, BLUE-MLP and HAPSO models, which also model 544
the demand response potential, show that this aspiration is challenged by the 545
dispatch (supply-demand balancing) constraint. According to the models, for the 546
aspired high deployment of renewable energy sources there will be a need for 547
significant levels of back-up capacity, mostly gas OCGT power plants. D-EXPANSE 548
model, which explores the maximally different pathways, shows that at least 15 549
GW of gas power plants would be required. The power generation mixes of 550
BLUE-MLP also include 15 GW of gas or coal power plants. The HAPSO model, 551
which evaluates the cost-optimal pathway while taking into account energy 552
security requirements, proposes 50GW of gas OCGT. The value is higher than the 553
one suggested by the D-EXPANSE and BLUE-MLP models because the HAPSO 554
model assumes higher supple security requirements. Overall, the complete 555
retirement of fossil fuel based power plants is questionable and the results 556
suggest that the storyline needs to include more of that type of plant. As 557
HAPSO model. Thus, its conclusion about the 50GW of gas OCGT by 2037 shall be 559
prioritized over the D-EXPANSE and the BLUE-MLP conclusions. 560
The FESA, BLUE-MLP, EEA, HESA/UK+ and HAPSO models all agree that 561
the target of the greenhouse gas emissions in 2035 would not be met. Instead of 562
the aspired 30 gCO2/kWh in the storyline, the modelling outcome range from 33
563
gCO2/kWh to 54 gCO2/kWh for CO2 for operational emissions and equals to 120
564
gCO2eq/kWh for the ‘whole system’ (cradle to gate) emissions. The D-EXPANSE
565
model shows a number of power generation mixes that could meet the target of 566
30 gCO2/kWh, but these mixes are different from the mixes evaluated by the
567
other models. Thus, while reaching the emission target can be technically 568
feasible, this may not be realistic via the means that the storyline describes. 569
According to the EEA, if the ‘whole system’ emissions were considered, then the 570
target would also be missed (although a different target for the ‘whole system’ 571
emissions could be expected). Thus, either the achieved levels of emissions or 572
the measures (power demand and generation mix) need to be revisited in the 573
storyline. 574
When the Central Co-ordination storyline was initially developed in the 575
Transition Pathways project, it had little insights from the experts and models, 576
informed by the economic considerations [37]. This is reflected in the points of 577
divergence between the models and the storyline about the power generation 578
mix. The D-EXPANSE, BLUE-MLP and HAPSO models, which include information 579
about costs, the cost-optimal and near-optimal decisions of actors, both include 580
more nuclear power than anticipated by the storyline. The D-EXPANSE model 581
prioritises onshore and offshore wind power as renewable energy sources rather 582
than wave and tidal power, as envisioned in the storyline. The BLUE-MLP model 583
includes a much more significant deployment of nuclear power due to its costs 584
and emissions performance. The HAPSO model raises concerns about significant 585
curtailment of the power produced by the renewable energy sources due lack of 586
market integration and subsequent development of interconnectors between the 587
UK and the continental Europe. This significant curtailment would reduce the 588
economic feasibility of these sources. While the storyline also describes a high 589
deployment of gas and coal CCS, the D-EXPANSE model shows that many of the 590
mix. The HAPSO model also questions the large deployment of CCS because, from 592
the dispatch perspective, these plants would run on a low capacity factor (24% 593
to 36%) and thus their economic feasibility is challenged. In brief, these results 594
suggest that a revised version of the Central Co-ordination storyline should 595
consider a higher share of nuclear and wind power, but a more pessimistic 596
deployment of coal and gas CCS and other types of renewable energy sources. 597
The Central Co-ordination storyline identifies the technical and economic 598
feasibility of CCS as one of the key risks for implementing the storyline. While 599
most of the eight models include a share of coal and gas CCS, the D-EXPANSE 600
model shows that this is not a prerequisite. D-EXPANSE generates a large 601
number of maximally different cost-optimal and near-optimal scenarios (30% 602
deviation from the least cost scenario). Many of these scenarios do not have CCS. 603
This means that the coal and gas CCS are not prerequisites for implementing the 604
Central Co-ordination storyline, as it is described in the harmonised assumptions. 605
As coal and gas CCS is a relatively costly technology, it appears seldom in the 606
cost-optimal and near-optimal scenarios. In the D-EXPANSE modelling outputs, 607
the environmental gains of the coal and gas CCS are rather replaced by the 608
deployment of other low-carbon technologies (renewable sources and nuclear 609
power), while the role of back-up capacity of coals and gas CCS power plants is 610
compensated by coal and gas plants without CCS. The BLUE-MLP model also 611
provides a range of power generation mixes without CCS. Thus, instead of 612
suggesting the feasibility of CCS as the key risk, these results seem to imply that 613
Central Co-ordination storyline shall consider other risks that are highlighted by 614
diverging insights from the eight models. One of these key risks is the supply-615
demand balancing challenge. As the HAPSO, D-EXPANSE and BLUE-MLP models 616
show, supply-demand balancing may be a big challenge in the Central Co-617
ordination storyline and this may cause public concerns over supply security. 618
Another key risk is the failure to meet the greenhouse gas emissions target. The 619
results of these multiple models from Table 1 already show that the target might 620
be missed in 2035. This failure would become even more likely if, in order to 621
meet the balancing challenge, the needed gas power plants would be installed as 622
the back-up capacity. The third key risk is the need for nuclear power, which—as 623
Despite the fact that the Central Co-ordination storyline is very detailed, it 625
seems to miss or under-represent several aspects that are analysed in the eight 626
models (Figure 3). The storyline does not describe any arrangements regarding 627
power import and export as well as the relations with the other European 628
countries, as modelled by the HAPSO and D-EXPANSE models. The storyline does 629
not discuss the governance arrangements and the choices of actors about the 630
power transmission and distribution grid, covered by the HESA/UK+ and HAPSO 631
models. The demand response levels, important for the dispatch modelling by 632
the FESA, HAPSO and other models, have also been only described to a limited 633
extent. The D-EXPANSE and BLUE-MLP models analyse the influence of 634
parametric and structural uncertainty on the power system transition, but these 635
insights are so far not incorporated into the storyline. The above-listed aspects 636
could be considered, when developing the next version of the storyline. 637
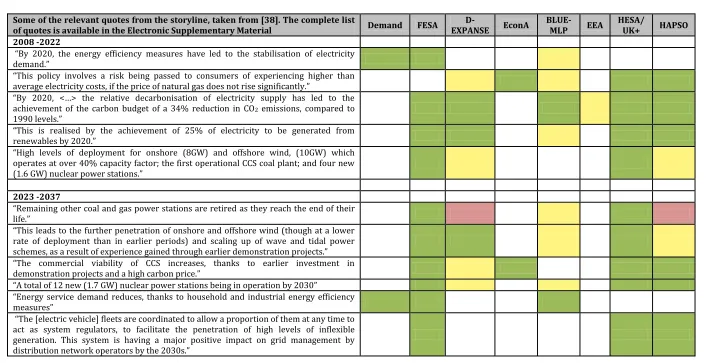
Table 2. Revisiting the storyline with the multiple models (detailed documentation is available in the Electronic Supplementary 640
Material). Green colour means that the model outputs are in line with the storyline, yellow – that there is a minor divergence, red – that 641
the storyline statement contradicts the model outputs, white – the particular statement is not addressed in the model. 642
Some of the relevant quotes from the storyline, taken from [38]. The complete list
of quotes is available in the Electronic Supplementary Material Demand FESA EXPANSED- EconA BLUE-MLP EEA HESA/ UK+ HAPSO
2008 -2022
“By 2020, the energy efficiency measures have led to the stabilisation of electricity demand.”
“This policy involves a risk being passed to consumers of experiencing higher than average electricity costs, if the price of natural gas does not rise significantly.”
“By 2020, <…> the relative decarbonisation of electricity supply has led to the achievement of the carbon budget of a 34% reduction in CO2 emissions, compared to 1990 levels.”
“This is realised by the achievement of 25% of electricity to be generated from renewables by 2020.”
“High levels of deployment for onshore (8GW) and offshore wind, (10GW) which operates at over 40% capacity factor; the first operational CCS coal plant; and four new (1.6 GW) nuclear power stations.”
2023 -2037
“Remaining other coal and gas power stations are retired as they reach the end of their life.”
“This leads to the further penetration of onshore and offshore wind (though at a lower rate of deployment than in earlier periods) and scaling up of wave and tidal power schemes, as a result of experience gained through earlier demonstration projects.” “The commercial viability of CCS increases, thanks to earlier investment in demonstration projects and a high carbon price.”
“A total of 12 new (1.7 GW) nuclear power stations being in operation by 2030”
“Energy service demand reduces, thanks to household and industrial energy efficiency measures”
[image:28.842.65.771.149.512.2]643
“Domestic electricity demand rises due to the adoption of electric heating for 60% of domestic heating systems”
“Overall, electricity demand only rises by just over 10% from 2020 to 2035”
[From 2020 to 2035] “The carbon intensity of electricity generation improves significantly to less than 30 gCO2/kWh (though higher when calculated on a life-cycle basis)”
2038-2052
“So, total electricity demand in 2050 is only 20% higher than in 2008.”
“The deployment of both domestic and non-domestic distributed generation increases, meeting around a quarter of total demand by 2050, with significant shares from onshore wind and biomass CHP systems.”
“The centralised generation system is now almost totally decarbonised, with eighteen large nuclear power plants with a total of 30 GW capacity providing the largest share of generation. There is significant further investment in CCS systems, resulting in 10GW of coal with CCS and 20 GW of gas with CCS by 2050. Overall, 65 GW of renewables capacity is installed, mainly onshore and offshore wind and wave and tidal power.”
“The average carbon intensity of electricity generation has now been reduced to below 20 gCO2/kWh by 2050, resulting in the almost complete decarbonisation of power generation, though carbon emissions are significantly higher when calculated on a life-cycle basis.”
Key risks
4.2. Discussion on the generalised process 644
In the Section 4.1 the limitations of the Central Co-ordination storyline 645
were identified from the perspective of eight models (Figure 3). This Section 4.2 646
critically reflects the reported process of linking the storyline with the multiple 647
models in the RTP project and highlights procedural insights, relevant for the 648
general approach (Figure 2). 649
The starting point of this analysis was the Central Co-ordination storyline 650
that was developed in the original Transition Pathways project [37, 38]. This 651
storylines is lengthy (five pages) as it aimed to richly represent the complex 652
power system transition. The storyline also aimed to encapsulate numerous 653
details, coming from the different parts of the power system, viewpoints 654
(government, power companies, consumers etc.), stakeholder and expert inputs. 655
Such a process, however, has shortcomings. First, when so many diverse inputs 656
are brought into one storyline, the internal consistency of this storyline becomes 657
at risk. The comparison of the storyline with the outputs of the eight models 658
revealed several inconsistencies. For example, the storyline describes the role of 659
civil society as passive, while the envisioned substantial decrease in the energy 660
service demand may not be feasible without voluntary action of energy 661
consumers. In order to avoid such cases, it seems likely that the development of 662
internally consistent, stakeholder-based storylines, facilitated by formal 663
techniques such as cross-impact balance or formative scenario analysis [5, 12, 664
19-21], would increase the robustness of the qualitative storyline itself. 665
Second, some of such internal inconsistencies as well as other mistakes 666
due to the lack of analytical foundation can be eliminated by comparing the 667
storyline with the models (given that these models are available), as done in this 668
paper. This is essential because the power system transition is inherently 669
complex and qualitative storylines-based approach on its own cannot capture 670
this complexity [11]. The afore-mentioned cross-impact balance or formative 671
scenario analysis can be used for mediating among the diverging perspectives of 672
the experts. The insights from the multiple models could thus perhaps be 673
brought into these analyses too in order to derive storylines that are informed by 674
Third, lengthy and detailed storylines may be easier for the audience to 676
imagine, but they also lead to overconfidence about how realistic they are [12]. 677
This is problematic because such exercises distract the attention of the audience 678
from other, as likely or as desirable, scenarios. The scenario approach is 679
expected, however, to expand rather than narrow down the understanding about 680
the plausible futures. Therefore, there is a threshold for how long and detailed 681
the storyline shall be. When storylines are combined with the multiple models as 682
in this paper, a meaningful approach would be to keep in the storyline the details 683
about the governance and the choices of the actors, while leave the power 684
system description to the multiple models. 685
The way a qualitative storyline is ‘translated’ into the assumptions for the 686
quantitative models (Step 1 in Figure 2) is decisive for the comparison of the 687
storyline and the modelling results. There is a trade-off between the number of 688
assumptions and how much flexibility the models have to express their 689
perspective. If a large number of assumptions is used, the models would be 690
tailored to mimic the storyline almost completely. In this way, the added value of 691
models, which have different rationales than described in the storyline, would be 692
ignored. For example, the cost-optimising models, like HAPSO or D-EXPANSE, 693
could be tailored to produce the results, similar to the storyline if there are no 694
major inconsistencies in the storyline. But this would gloss over the fact that the 695
cost-optimal and near-optimal—thus, perhaps more realistic pathways—may be 696
very different than the one described in the storyline. The modelling 697
assumptions thus shall better allow more flexibility for the models to express 698
their perspective. However, it is challenging to define what the optimal number 699
and type of assumptions are. Moreover, one qualitative statement might have a 700
range of quantitative representations which need to be captured systematically 701
[10, 11]. The ‘translation’ procedure, used in this paper, is acknowledged as one 702
of the weaknesses. To some extent, this fragility arose because only one storyline 703
was analysed through the perspective of the eight models. If all three storylines 704
of the RTP project were analysed (Central Co-ordination, Market Rules and 705
Thousand Flowers), this problem could be resolved to some extent, as a unified 706
would need to be defined. By comparing three storylines, a more robust 708
framework could be developed. 709
The landscape of models (Table 2 and Figure 3) proved to be a useful 710
approach for understanding and mapping the fields of expertise of the eight, very 711
diverse models of the RTP project. This landscape helped to understand where 712
the models overlap and where they have their key, individual fields of expertise 713
as compared to the other seven models. In line with [16], this landscape 714
approach assumes that the usefulness of the model is the local matter. There is 715
no single best model that covers all the relevant aspects in sufficient depth and 716
breadth. The usefulness of the model depends on the model’s suitability to 717
answer the specific question at hand and to fill a gap among the other existing 718
models. In the reported process, due to their different key fields of expertise, all 719
eight models proved to be useful for assessing the storyline (Table 2). However, 720
this landscape of models is not complete because not all of the qualitative 721
statements in the storyline could be assessed. First, the statements about wider 722
developments of industry and the national economy could not be addressed. For 723
this purpose, a macro-economic model or a whole energy system model would 724
be needed in the landscape. This whole energy system model would need to be 725
broader than the already used HAPSO model, which addresses only the power 726
system. This model would need to have as wide system boundaries as UK 727
MARKAL or TIMES [45, 65] and to address the whole supply chain of the whole 728
energy system (not only the power system) and energy-economy interactions. 729
Second, assuming a substantial deployment of distributed generation, 730
there would be a need for improved modelling of local voltage control and two-731
way power flows. This problem would increase even more if the Thousand 732
Flowers storyline would be analysed, because this storyline pictures a significant 733
uptake of decentralised generation. A model that addresses these issues would 734
need to be added to the landscape of models too. 735
Third, the storyline raised issues about public acceptability of rising 736
energy prices or, as suggested by the models, possibly decreasing supply security 737
due to the deployment of intermittent renewable energy sources. While the 738
public acceptability issues are challenging to model, they are of high relevance 739
assessment of the storyline, a social scientific assessment is required. This social 741
scientific analysis already took place in the Transitions Pathways project [66] 742
and thus, together with the landscape of models, it could improve the analytical 743
assessment of the qualitative storylines. 744
The iterative loop in Figure 2 would be completely closed by revising the 745
qualitative storyline on the basis of the results of the eight models. The exercise, 746
reported in Table 2, helped to identify the points of fragility of the storyline. The 747
diversity of the eight models here proved to be especially useful as the results of 748
the different models were at times diverging. While some models were in line 749
with all or almost all storyline statements, there was almost always at least one 750
model that diverged from the storyline. Any of these divergences can have 751
credible reasons leading to the fragility of the storyline. Unpicking the underlying 752
mechanisms of this divergence (as already reported in Section 4.1.) is thus 753
essential for understanding why this divergence appears and, if necessary, 754
revising the storyline. The next step of this process would be a collaborative, 755
reflexive effort between the storyline developers and the modellers. In this way, 756
an improved storyline version could be developed. 757
The iterative loop in Figure 2 is a two-way reflexive collaboration 758
between the storyline and the models. In this paper, a storyline-led approach is 759
reported. The storyline was developed first and then was assessed from the 760
perspective of the different models, at the same time reflecting on the potentially 761
relevant models that were missing from the analysis. Models alone can hardly 762
capture the broader picture, covered in the storyline, such as the power system 763
governance ‘logics’ and the choices of the key actors. As these aspects are very 764
challenging to model, it is meaningful to use a storyline-led approach. However, 765
an alternative, modelling-led approach could also be used to derive storylines 766
too. This could be based on the generation of a large number of scenarios with 767
multiple models and extracting a smaller range of scenarios with fundamentally-768
different structures and describing them in storylines. Some research in this 769
direction is already reported in [6, 11, 52, 53, 67-69]. Such process could be 770
organised similar to the process of Figure 2, but it would start with the modelling 771
exercise. 772