Automated Video Processing and Image Analysis
Software to Support Visual Inspection of AGR Cores
Paul Murray
1, Graeme West
1, Kristofer Law
1, Stephen Buckley-Mellor
2,
Graeme Cocks
2, Chris Lynch
31 Dept. Electronic and Electrical Engineering, University of Strathclyde, Glasgow, G1 1XW 2 Amec Foster Wheeler - Booths Park, Knutsford, Cheshire. WA16 8QZ
3 EDF Energy – Generation, Barnett Way, Barnwood, Gloucester, GL4 3RS
Email: [email protected]
Abstract
Remote visual inspection of fuel channels in Advanced Gas-cooled Reactor (AGR) cores provides nuclear operators with an understanding of the condition of the UK’s fleet of nuclear power plants. During planned, periodic outages, specialist inspection tools equipped with video cameras and other sensors are manipulated inside fuel channels selected for inspection and a video of the entire inner surface of the channel is recorded. If cracks are observed in this process, a montage of the entire crack region needs to be: produced, analysed and sentenced (classifying the crack morphology, location, orientation and size) before the station is returned to service – provided it is safe to do so. At the present time, the video analysis and crack montage production is done manually by an expert team of inspection engineers. In line with this process, bespoke image stitching software named “ASIST” (Automated Software Image Stitching Tool) has been trialled in the last 18 months and evaluated using data from Dungeness, Hunterston B, Hinkley Point B, Heysham 1 and Torness outages. The software is now approaching the point of acceptance at which time it is likely to replace the manual process to provide higher quality images with 100% channel visualisation properties in a fraction of the time taken by the current approach. This paper provides a summary of the ASIST evaluation work undertaken and describes recent research endeavours aiming to provide ASIST with algorithms to detect and quantify features in the channel such as brick interfaces, keyways and trepanned holes for which the physical dimensions are known. These features will provide a metric for converting pixel based measurements into millimetres and will support crack sizing in future. Recent research into automated crack detection is also described along with methods to compute Structure-from-Motion which will facilitate the extraction of 3D depth information directly from the 2D video footage. The outcomes of this new research activity will initially provide EDF with new decision support software for crack sentencing. It will also allow station operators to make better use of visual inspection data by facilitating the inference of depth and hence channel bore measurements directly from video.
Keywords
Inspection, Fuel Channels, Automated Image Processing
INTRODUCTION
has played an important role in providing part of the supporting evidence required for lifetime extension and, over the years, has allowed station operators to better understand and visualise to the condition of their reactors. However, performing RVI is a costly process which can only be conducted during planned, periodic reactor outages at which time the station is not at power and this results in a loss of revenue estimated to be around £0.5M per day. RVI also requires expensive specialist inspection tools and trained, experienced personnel to manipulate the equipment within the fuel channels selected for inspection to record video footage of the entire channel bore. Once acquired, the data is analysed by a team of expert inspection engineers who view the video footage, locate abnormalities and manually generate montage images of any defects and cracks found. Generating these images is a time consuming process which can take up to one full working day to complete before the resulting montages are passed on and later studied at a Graphite Assessment Panel (GAP) where the cracks are categorised based on their: morphology, location, orientation and size, in a process known as “Crack Sentencing”. Ultimately, the longer it takes to capture and process the data to be presented at the GAP, the more costly the outage can become since crack sentencing (among a number of other critical activities) must be completed before the station can be returned to service. Techniques for reducing the time taken to capture and process the data and support the crack sentencing process could therefore potentially shorten the total outage duration to reduce outage costs.
In recent years, Murray, West et al. (2016) have researched and developed a number of techniques for automatically converting inspection videos into large, high-quality, 360° panoramic images of the entire fuel channel known as “chanoramas”. A chanorama can be produced in approximately 30 mins - a fraction of the time taken by the manual approach while making better use of the data to provide 100% channel coverage. These methods were delivered to EDF Energy as a prototype software tool, ASIST (Automated Software Image
Stitching Tool), in Nov 2014. Since this time ASIST has been trialled in parallel with the manual image stitching process by a team of inspection engineers at Amec Foster Wheeler. To date, ASIST been used to generate over 225 chanoramas from 225 inspection videos.
ASIST is approaching the point of acceptance at which time steps will be taken to allow it to replace the existing manual process. In this paper we provide a summary of the evaluation that ASIST has undergone in the last 18 months. This paper also presents some early findings of recent research into developing methods to perform automated chanorama analysis to automatically identify and size features and cracks in the channel walls. Finally, we present some very recent developments of applying Structure-from-Motion techniques to facilitate the extraction of 3D depth information directly from the 2D video inspection footage.
DATA ACQUISITION, PROCESSING AND CHANORAMA GENERATION
After the fuel has been removed from a channel selected for inspection, either NICIE Mk2 or CBIU is lowered into the channel and an inspection video is captured which contains the following:
1. Footage from a forward facing camera looking down into the channel as the tool is lowered to the bottom
2. A series of overlapping scans of the channel wall captured at one of six different orientations (0°, 60°, 120°, 180°, 240°, 300°) by imaging a mirror which is placed in front of the camera at an angle as the tool is hoisted up the channel. (additional scans at different orientations are sometime recorded as required)
3. Continuous overlapping footage of defects found in which NICIE/CBIU has been lowered to the location of the defect and used to follow it from its start point to its end point. This so called “crack following footage” only exists if cracks/defects are found.
The footage from the forward facing camera is generally not used in the subsequent data analysis, although some attempts have been made by the authors to extract full channel images directly from this portion of the video. The series of overlapping vertical scans provide full channel coverage and are viewed in order to spot anomalies while the video is being recorded. If any cracks/defects are seen, their location is noted and this section of the channel is revisited after all scans have been performed and additional “crack following footage” is recorded. Here, the start of any defect is identified and the inspection tool is raised, lowered and rotated around the channel while following the trajectory of the crack/defect until its end point is reached. It is this crack following footage that is used by the inspection engineers to manually generate the crack montage required by the GAP.
ASIST SOFTWARE EVALUATION AND TESTING
The first version of the software, ASIST v1.0, was delivered to EDF energy in Nov 2014 and in the last 18 months has been trialled by Inspection Engineers at Amec Foster Wheeler in line with the manual process which is currently in place. Based on some early feedback from EDF Energy and Amec Foster Wheeler, ASIST v1.1 was released in Sept 2015. This update contained the same underlying image stitching methods but offered improved user interaction capabilities. The ASIST software contains a suite of image and video processing algorithms (Murray, et al. 2016) which processes the inspection videos and:
1. automatically identifies the portion of the video which contains the overlapping scans recorded as NICIE/CBIU is hoisted up the channel at different orientations
2. generates a static image for each scan of the channel at each different orientation 3. aligns and combines each image generated using brick interfaces and other features in
the images to create a chanorama - a 360° visualization of the entire channel wall
has now been demonstrated to work on approximately 225 videos which include examples from both NICIE and CBIU inspection tools deployed at all 7 AGR stations in the UK. Based on the 225 videos processed using a desktop PC running 64 bit Windows 7 on an Intel(R) Xeon(R) CPU E5-1650v3 3.5GHz processor with 64GB RAM, the average time taken to generate a chanorama is around 30 minutes. This is a significant improvement on the full working day required by the manual approach to stich an image of just a small portion of the channel. Around 20% of the videos processed generated chanoramas completely automatically while approximately 70% required a small amount of manual intervention to correct some aspects of the stitching process using only the interfaces provided in ASIST. The remaining 10% have highlighted areas for future research which will see the development of techniques to suppress noise and other artefacts in these chanoramas as well as a method to guarantee the repeatability of all results. This enhanced functionality will be released in ASIST v1.2 and it is anticipated that this will be the final iteration of the software before the case is made to switch from the manual process to an automatic one using ASIST.
AUTOMATED IMAGE PROCESSING FOR CHANORAMA ANALYSIS
Once a crack montage has been created, inspection engineers analyse the result and measure the relative size of any cracks based on that of known features in the channel. Such features include keyways, brick interfaces, trepanned holes, gas flutes and gas holes. In this section, techniques which are currently being developed by the authors for automatically detecting brick interfaces, keyways and trepanned holes are described. The output of these algorithms will then be particularly useful for automatically estimating the relative size of cracks which can also be extracted from the data using image processing techniques described herein. In addition, since the metric size of these channel features are known, they can be readily used to convert pixel based measurements into real metric quantities with millimetre accuracy.
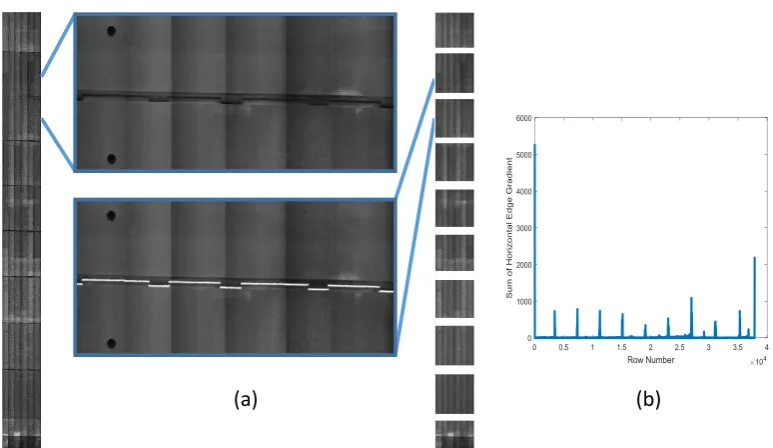
Automatic brick interface detection
(a) (b)
Figure 1 Brick Interface detection (a) Chanoramas and zoomed in brick interfaces and results of detection (b) The signal generated to identify the candidate brick interface regions
Automatic keyway localisation
Keyways which physically connect one brick layer to others above and below are shown in Figure 1 and Figure 2. Since the keyway shape and size are known, the Hit-or-Miss Transform (HMT), a well-known template matching method from Mathematical Morphology (Serra, 1968) is used to detect their presence in chanoramas and store their location. The HMT uses a complementary pair of templates, known as Structuring Elements (SEs) in morphology, to search an image for places where both SEs simultaneously fit the image. One SE, the foreground template, Figure 2(a), searches for and marks locations where it is completely contained in the image. Then, a second SE, the background template (Figure 2(b)) marks places where it fits the complement image (the background). The output of the HMT is the set of points where both the foreground and background SEs simultaneously fit the image. These locations mark the presence of the sought object in the image as shown in Figure 2(e).
(a)
(e) (c)
(b)
x
x
x
x
x
x
x
x
[image:5.595.99.490.537.716.2](d)
Automatic trepanned hole recognition and quantification
To allow station operators to evaluate changes in the material properties of the graphite core due to prolonged periods of irradiation, small samples for analysis are trepanned from selected fuel channels during inspection. This is achieved using a specialist inspection tool which is equipped with angular-controlled, diamond-tipped, hollow cutting tools capable of trepanning 19mm diameter samples which are 70mm long (Bradford, 2014). These samples are analysed off-site and the material properties of the sample are measured to help station operators understand the condition of the core. These measurements are also used to validate and support the future development of mathematical models of the core.
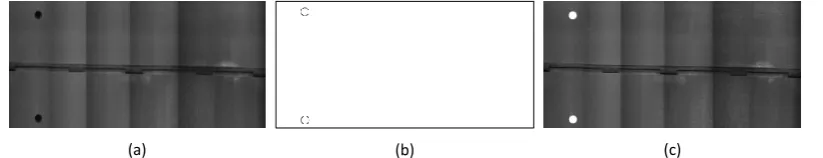
Since the size and shape of the trepanned holes is known, and since they can be seen clearly in any chanoramas produced for any fuel channels which have been trepanned, these features can be detected using image processing techniques and their dimensions can be extracted in pixels, converted to mm and used to accurately size any cracks or defects present. Furthermore, detecting and quantifying holes in the channel due to trepanning will facilitate their analysis too. The Hough Transform for circle detection (Kimme et al., 1975) is therefore used to search the chanoramas for circles whose dimensions match that of the trepanned holes in the chanorama. The Hough Transform is a well-known approach for circle detection in image processing which operates on binary edge images, is robust to noise and can be designed to detect circles of any size in a given image. In our case, the search can be restricted to save processing time based on the expected dimensions of trepanned holes in the chanoramas. An example input image which contains two trepanned holes and the result of applying Hough Transform for circle detection is shown in Figure 3.
[image:6.595.95.507.431.510.2](a) (b) (c)
Figure 3 Trepanned hole detection using Hough Transform for circle detection – (a) original image (b) Binary result of circle detection algorithm (c) circles detected overlaid on original and filled in
Automatic crack detection
in the result. The connected components which remain are then considered to be cracks and a final post-processing stage tracks the trajectory of all cracks and recovers pixels which are likely to lie on a crack but were removed in the previous step. This process and the output at each stage is shown in Figure 4.
(a) (b) (c)
[image:7.595.99.495.135.362.2](d) (e) (f)
Figure 4 Crack detection process based on (Oliveira, Correia, 2014). (a) original input image (b) saturated image (c) Gaussian fitted to image histogram and threshold computation (d) result of
thresholding (e) thresholded result after post-processing (f) final result overlaid on (a).
EXTRACTING 3D INFORMATION FROM INSPECTION VIDEOS
One way to make even better use of visual inspection data captured from inside the reactor core would be to derive the 3D structure of the fuel channel using image processing techniques known as Structure-from-Motion (SfM). SfM techniques can estimate 3D point locations from 2D image sequences which contain multiple views of the same object.
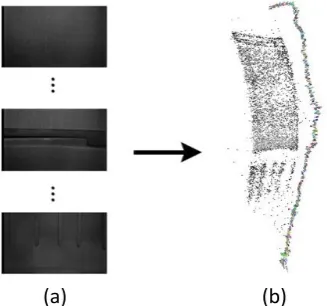
(a) (b)
Figure 5 Extracting 3D structural estimates from overlapping video frames using SfM (a) subset of the video frames used from the bottom of the channel at one orientation (b) 3D point cloud using SfM
[image:7.595.213.377.529.682.2]inspection, theoretically, the 3D geometry of any fuel channel can be obtained and, preliminary work has yielded promising results as shown in Figure 5. To create the point cloud shown in Figure 5, a small section of one inspection video was converted into frames and a feature detection algorithm known as SIFT (Scale Invariant Feature Transform) was used to extract feature descriptors from each image (Lowe, 2004). Sequence-based matching was then performed to determine feature correspondences between images before triangulation was used to estimate the 3D point locations and camera poses. Finally, Bundle Adjustment was used to fit a non-linear model to optimise the resulting 3D structure and viewing parameters. While initial results are promising, this work has highlighted various challenges for SfM including: a lack of discriminative features on the fuel channel interior, scale ambiguity caused by a monocular camera model, and non-uniform illumination and reflectance properties of the graphite itself.
CONCLUSIONS
Visual inspection of the fuel channels of the AGR cores in the UK’s fleet of nuclear power plants plays a critical role in allowing station operators to assess the condition and safety of their plant and provides evidence which can be used to support the case for plant lifetime extension. In this paper we have provided an overview of the visual inspection process and have highlighted its importance. We have described the functionality of the recently created ASIST software and have summarised the outcomes of its evaluation performed by Amec Foster Wheeler. ASIST has now been applied to approximately 225 inspection videos to generate the same number of high quality chanoramas. In looking towards an automated approach for chanorama analysis, a series of algorithms have been presented in this paper for automatically detecting: brick interfaces, keyways and trepanned holes which can be used to scale any cracks or defects detected. A method for automated crack detection has also been presented and the initial results are promising. Finally, a new approach for extracting 3D structural information based on 3D SfM algorithms have been presented and demonstrated to work well in a challenging feature-poor environment.
Acknowledgements
The authors would like to thank EDF Energy for supporting this work.
References
Bradford, M. R., 2016 Reactor Inspection and Monitoring and its Role in the Reactor Safety Case, Proc. 4th EDF Energy Nuclear Graphite Symposium, pp 331 – 340
Cole-Baker, A. and Reed, J. "Measurement of AGR graphite fuel brick shrinkage and channel distortion," in Management of Ageing Processes in Graphite Cores. vol. 309, G. B. Neighbour, Ed., ed: Royal Society of Chemistry, 2007, pp. 201-208.
Kimme C, Ballard D. and Sklansky J. "Find circles by an array of accumulators," Comm. of the ACM, vol 18, no. 2, pp 120-122, 1975.
Lowe, D.G., 2004. Distinctive image features from scale-invariant keypoints. International journal of computer vision, 60(2), pp.91-110.
Murray, P., West, G., Marshall, S. and McArthur, S., 2016. Automated in-core image generation from video to aid visual inspection of nuclear power plant cores. Nuclear Engineering and Design, 300, pp.57-66.
Oliveira, H.; Correia, P.L.; "CrackIT – An image processing toolbox for crack detection and characterization", Proc. IEEE International Conf. on Image Processing - ICIP, Paris, France, October, 2014.
Riveiro, B., Lourenço, P.B., Oliveira, D.V., González‐Jorge, H. and Arias, P., 2015. Automatic Morphologic Analysis of Quasi‐Periodic Masonry Walls from LiDAR. Computer‐Aided Civil and Infrastructure Engineering.