City, University of London Institutional Repository
Citation
:
Fonseca, J., O'Sullivan, C., Coop, M. R. and Lee, P. D. (2013). Quantifying the
evolution of soil fabric during shearing using directional parameters. Géotechnique, 63(6),
pp. 487-499. doi: 10.1680/geot.12.P.003
This is the unspecified version of the paper.
This version of the publication may differ from the final published
version.
Permanent repository link: http://openaccess.city.ac.uk/3534/
Link to published version
:
http://dx.doi.org/10.1680/geot.12.P.003
Copyright and reuse:
City Research Online aims to make research
outputs of City, University of London available to a wider audience.
Copyright and Moral Rights remain with the author(s) and/or copyright
holders. URLs from City Research Online may be freely distributed and
linked to.
City Research Online:
http://openaccess.city.ac.uk/
[email protected]
Fonseca, J. et al.(2013). Ge´otechnique 63, No. 6, 487–499 [http://dx.doi.org/10.1680/geot.12.P.003]
487
Quantifying the evolution of soil fabric during shearing using directional
parameters
J. F O N S E C A, C . O ’ S U L L I VA N † , M . R . C O O P ‡ a n d P. D. L E E §
Over the past 50 years, experimental studies have repeatedly demonstrated that the mechanical behaviour of sand is sensitive to the material fabric, that is, the arrangement of the grains. Up until now there have been relatively few attempts to describe this fabric quantitatively. Much of our understanding of the link between the particle movements and interactions and the macro-scale response of granular materials, including sand, comes from discrete-element modelling and experiments on ‘analogue’ sands with simple, idealised shapes. This paper investigates methods of quantifying the directional fabric of a real sand and its evolution under loading. Statistical analyses of the distribution of fabric directional data in terms of particle, contact normal, branch vector and void orientations were carried out at different stages of shearing deformation. The data show that the initial particle orientation fabric that develops during the deposition of the material tends to persist during shearing, while in the post-peak regime the contact normals seem to be reoriented along the direction of the major principal stress. Different patterns were observed within the shear band, as both the particles and the contact normal vectors appeared to rotate along the shear plane.
KEYWORDS: fabric/structure of soils; laboratory tests; microscopy; sands
INTRODUCTION
The response of soils and other granular materials is known to be sensitive to the material fabric, that is, the topology of the internal structure of the material. In geomechanics re-search, fabric has been qualitatively described, and the fabric changes have frequently been inferred from macro-scale observations of soil response: for example, anisotropy of small-strain stiffness (e.g. Kuwano & Jardine, 2002), anisotropy of permeability (e.g. Chan & Kenney, 1973), or comparison of the mechanical response of specimens pre-pared using different approaches (e.g. Vaid & Sivathayalan, 2000). Quantitative observations of fabric have been made with physical models using photoelastic discs (e.g. Oda et al., 1985) or Schneebeli rods (e.g. Ibraim et al., 2010), as well as using numerical discrete-element modelling (DEM) (e.g. Thornton, 2000). Most prior measurements of real soil fabric and the preferential orientation of elements of the soil fabric have been via observation of two-dimensional images using either optical microscopy or scanning electron micro-scopy (e.g. Tovey & Dadey, 2002; Wilkinson, 2011). Fabric can be quantified using either scalar parameters or direc-tional parameters. Examples of scalar measures of fabric include the coordination number, the void ratio distribution within the sample, and the contact index. Directional fabric can be measured using particle long-axis orientations or contact normal orientations, and the statistical approaches to analyse datasets of orientation vectors are relatively well established (Satake, 1982; Oda et al., 1985; Thornton, 2000).
Experimental evidence of the effect of fabric on the mechanical behaviour of sands has been shown by compar-ing the behaviour of intact and reconstituted samples (e.g. Cresswell & Powrie, 2004; Ventouras & Coop, 2009). These experimental studies have demonstrated significant differ-ences in the peak strength and dilation for both materials. The intact material also had a markedly higher stiffness than the reconstituted sand. The sensitivity of the mechanical response of sands to fabric can also be observed when the mechanical responses of reconstituted samples formed using different preparation procedures are compared (e.g. Been & Jefferies, 1985; Ibrahim & Kagawa, 1991). Oda (1972) and Arthur & Menzies (1972) were among the first to demon-strate the influence of the initial fabric orientation on the strength of sands. Experimental evidence of the effect of fabric anisotropy on soil stiffness was reported by Zdravko-vic & Jardine (1997) (for silts) and Kuwano & Jardine (2002) (for sands). All of these macro-scale datasets are manifestations of a particle-scale anisotropic response, and the relationship between these two scales is considered quantitatively here.
The key contribution of the current work beyond these earlier studies is the use of micro-computed tomography (micro-CT) data to generate three-dimensional datasets for real soils giving particle, contact, branch vector and void orientations. The data were obtained at different stages during shearing for both intact and reconstituted samples, and so they allow fundamental observations of material response. This work extends the earlier contributions of Fonseca et al. (2012), who considered scalar fabric and particle morphology respectively. The paper first gives sum-mary information on Reigate sand and the triaxial tests performed. An overview of the methods used to quantify directional data is given. Then the analysis and results obtained for the four datasets (the particles, the contacts, the branch vectors and the voids) are presented in turn. Finally, the conclusions discuss correlations between the datasets, and consider the results in relation to published DEM analyses.
Manuscript received 3 January 2012; revised manuscript accepted 28 May 2012. Published online ahead of print 16 October 2012. Discussion on this paper closes on 1 October 2013, for further details see p. ii.
Laboratoire 3SR, Universite´ Joseph Fourier, Grenoble, France.
† Department of Civil Engineering, Imperial College London, UK. ‡ Department of Civil and Architectural Engineering, City University, Hong Kong.
SOIL DESCRIPTION AND TRIAXIAL TESTS
The sand investigated in this study was Reigate sand. This forms part of the Folkestone Beds formation (Lower Green-sand), and the intact samples were retrieved from a quarry near Reigate (south-east England) where this geological formation outcrops. The material has ad50 of about 300ìm,
and the grain geometries vary from being near-spherical to highly non-spherical. Fonseca et al. (2012) discuss the use of micro-CT and laser scanning data to quantify the particle morphologies for this material. Owing to the very high density and the interlocked fabric of the sand in its intact state, Reigate sand has been classified as a ‘locked sand’ meeting the criteria proposed by Dusseault & Morgenstern (1979). The sand provides an extreme example of fabric; in its intact state the grains are interlocked, and have no bonding between them. The reconstituted samples were obtained by tamping and vibration to densities close to those of the intact samples. The breakage of the fractured grains observed during reconstitution allowed the high densities to be attained even in the absence of interlocked grains; the reduction of the average mean particle diameter was of 13% (Fonsecaet al., 2012).
Thirteen triaxial tests were performed on a mixture of intact and reconstituted samples. Detailed test descriptions are given in Fonseca et al. (2012) and Fonseca (2011), and only a brief overview is provided here for clarity. All of the tests were carried out on dry samples that were isotropically consolidated to 300 kPa and then subjected to strain-con-trolled axial compression while keeping 3 constant. As has
been documented in prior studies (e.g. Cuccovillo & Coop, 1999; Cresswell & Powrie, 2004), in comparison with the reconstituted sand the intact material was stiffer, it attained a higher peak stress ratio, and it exhibited a higher rate of dilation. For both materials, equivalent tests were stopped at similar stages of the evolution of behaviour, but these corresponded to different axial strain levels. A single, well-defined shear plane has developed in both the intact and reconstituted samples. At the end of each test the sample was impregnated with an epoxy resin, and small cores were extracted for micro-CT. Four different shearing stages were thus considered: (1) prior to the start of compression; (2) at the onset of dilation; (3) the start of a visible shear band; and (4) as the sample approached a critical state. For stages 3 and 4 cores were taken both away from the developing shear band and across the shear band. The latter are identi-fied with an ‘S’ in the sample reference in Table 1. The cores were larger than the shear band, which had an approx-imate thickness of 7d50 and 11d50 for the intact and
recon-stituted material respectively. Consequently the data from these samples cannot represent exclusively the soil within the shear band, and although care was taken to identify the shear band location, it is not possible to say exactly what propor-tion of these samples was from inside and outside the shear band. As described elsewhere (e.g. Fonseca et al., 2012) and summarised in Table 1, micro-CT scan data from eight intact and five reconstituted samples with a voxel size of 5ìm were reconstructed and processed to generate the data used in the current study to quantify the material anisotropy. The data were stored as three-dimensional arrays, where each voxel in the three-dimensional image was mapped to an array cell, and the analyses were then carried out using MATLAB (Mathworks, 2011).
Using watershed segmentation (Beucher & Lantuejoul, 1979) implemented in an in-house code (Atwood et al., 2004), each particle-phase voxel was assigned an integer identification number (id) to associate it with a specific grain. Contacts were identified along the boundaries of two regions of particle voxels by considering the voxel id num-bers. Watershed segmentation was also used to identify individual voids.
QUANTIFYING DIRECTIONAL FABRIC
Figure 1 shows a schematic diagram of the fabric of an intact sample with an indication of the data considered in this study: the particle long-axis orientations (PO), the contact normal orientations (CN), the branch vector orienta-tions (BV) and the void orientaorienta-tions (VO). Prior to present-ing the data it is important to outline how the fabric was quantified. For each dataset considered three approaches were used to quantify the fabric: two-dimensional rose diagrams, the distribution of contact orientations measured relative to the horizontal (angle ł), and eigenvalue analysis of the three-dimensional fabric tensor.
Rose diagrams
[image:3.595.144.468.603.779.2]A convenient way to plot the distribution of vector orientations is to use a rose diagram (i.e. an angular histogram). Where the vectors are three-dimensional these vector orientations can be plotted as a three-dimensional diagram; however, interpretation of this diagram is difficult. In the current study, for ease of visualisation, rose diagrams of the vector projections on the horizontal and vertical planes are presented. In the vertical plane the angle is measured relative to the horizontal, and in the horizontal
Table 1. Information on the samples investigated
Sample reference
Load stage details No. of particles No. voxels per particle (average)
a q/p9 Total Inner
plane is measured to a reference vertical plane. Furthermore, as the vector data presented here are orientations without a specific direction, only one half of the plane need be consid-ered (i.e. in the x–y plane a vector with an orientation of 3308 to the positive x-axis is equivalent to a vector with an orientation of 1508to the same axis). The dataset available from the micro-CT scans allowed correlations between parti-cle, contact and void geometries and orientations to be made, and these correlations were explored by shading the bins in the rose diagrams, for example by average particle size.
Anglełinclination
In three dimensions the orientation of any vector can be described in spherical coordinates as a combination of two angles: the azimuth angle, giving the inclination of the horizontal (x–y) projection to the x-axis; and the angle ł, which, as illustrated in Fig. 2(a), is the angle between the vector and the horizontal (x–y) plane (i.e. the zenith angle is 908ł). For axisymmetric or cross-anisotropic samples, provided the material is isotropic in the horizontal plane, the frequency distribution of theł angles for a specimen gives an indication of the fabric anisotropy. As illustrated in Fig. 2(a), this distribution is determined by considering all the unit vectors describing the orientations to originate at the centre of a unit sphere. Then the number of vectors that intercept the surface of the sphere over an angular increment of dł are counted and normalised by the total number of vectors. For an isotropic material the frequency distribution is determined by considering incremental area dA(Fig. 2(a)) divided by the total surface area of the hemisphere. Ob-viously, close to the apex of the sphere (for ł values close to 908) the area dA associated with the angular increment dł is much smaller than the dA value associated with ł values close to 08, and so in the isotropic case the resultant distribution takes the non-linear form illustrated in Fig. 1(b). For the data presented here the angular increment considered was 58. In all cases there was scatter in the experimental data (owing to the finite number of particles and contacts considered); consequently, for each dataset considered, both the raw data and the smoothed (filtered) data are presented. The data were smoothed with the loess method available in
MATLAB (Mathworks, 2011), which uses local regression with weighted linear least squares and a second degree polynomial.
Fabric tensor
The fabric tensor is commonly used to describe the preferred orientation of a dataset of vectors and its asso-ciated intensity. It takes generally the form of a second-order symmetric tensor. Following Satake (1982), the fabric tensor definition used here is
Öij¼ 1
N
XN
k¼1
niknkj (3)
whereN is the total number of vectors in the system and nk i is the unit orientation vector along direction i. This defini-tion of fabric can be applied to different direcdefini-tional vectors describing the soil packing, including the orientation of the particle major axes (e.g. Dafalias et al., 2004; Ng, 2004). However, this definition does not account for the shape of the particles. A particle whose intermediate axis length is only slightly bigger than its minor axis length would have the same contribution to the overall tensor as a particle whose intermediate axis length is just smaller than its major axis length. A fabric tensor that considers both particle
Individual particle
Contact
Individual void
Best-fit plane
CN CN
[image:4.595.51.273.53.251.2]BV VO PO
Fig. 1. Schematic diagram of fabric for intact sample, with indication of main features and vectors used for fabric quantification: particle orientation (PO), void orientation (VO), contact normal (CN) and branch vector (BV). Geometrical definition of CN vector included
z
Area dA
y
dψ ψ
x
0 15 30 45 60 75 90
0 0·01 0·02 0·03 0·04 0·05 0·06
ψ
: deg
rees
Frequency (no. vectors/total no. vectors) (b)
(a)
Fig. 2. (a) Definition of angle ł, giving vector inclination to horizontal and illustration of discretisation of unit sphere to calculate distributions; (b) distribution of łvalues for isotropic case
[image:4.595.299.532.59.420.2]shape and particle orientation was introduced by Oda et al.
(1985), and is given by
Öpart
ij ¼ 1 º
XNp
k¼1
TkipTljpSij (4)
whereNpis the number of particles, andTijis the orientation tensor for particle p, which can be understood as follows. For a given point on the particle with coordinates xi in a Cartesian coordinate system centred at the particle centroid,
xlpj ¼Tijxip gives the coordinates of the same point with reference to a local coordinate system also centred on the particle centroid, but with axes aligned with the principal axes of inertia of the particle. The tensorSijp is defined as
Sijp¼
ap 0 0
0 bp 0
0 0 cp
2 4
3
5 (5)
where ap,bp andcp are the major, intermediate and minor half lengths of the particle, respectively. The indexº can be calculated by
º¼X
Np
p¼1
apþbpþcp
ð Þ
For each dataset considered, the sample anisotropy can be quantified by considering the difference between the maxi-mum and minimaxi-mum eigenvalues of the fabric tensor – that is, Ö1Ö3: The orientation of the eigenvector associated
with the maximum eigenvalue gives an indication of the preferred fabric orientation.
PARTICLE ORIENTATIONS
The vectors describing the particles’ major axis orienta-tions were obtained by applying principal component analy-sis (PCA) to the cloud of points defining each grain. PCA is a mathematical tool that can be used to reduce the dimen-sionality (number of variables) of a dataset while retaining most of the original variability in the data, and the mathe-matics are outlined by Haralick & Shapiro (1992). This technique has been applied to tomographic data in other fields (e.g. Phillionet al., 2008; Zhanget al., 2009). Fonseca
et al. (2012) used PCA when determining the particle aspect ratios. As the particles intercepting the boundary of the
image were truncated, only the orientations of the inner, complete particles of the image were considered.
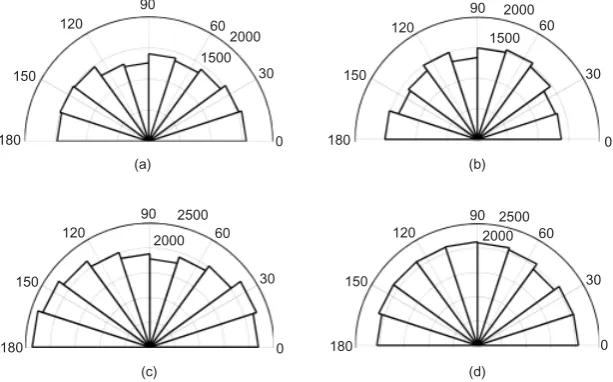
Figure 3 shows the rose diagrams of the projections of the particle long-axis orientation vectors onto the vertical (x–z) plane and horizontal (x–y) plane for representative intact and reconstituted samples prior to loading. As would be expected for this cross-anisotropic material, the projections onto the two orthogonal vertical y–z and x–z planes are equivalent, and so only one vertical projection is presented here (i.e. the x–z plane). Each bin of the histogram is shaded according to the average elongation, as defined by the aspect ratio (ratio of minor axis length to major axis length) for the particles whose orientations are within that angular increment. Considering Fig. 3(a) (intact) and Fig. 3(c) (reconstituted), the distributions of the PO vectors for both sample types show a greater concentration around the horizontal plane: that is, perpendicular to the direction of deposition. This horizontal bias in the orientations is more marked for the intact soil. These data are reasonable, as when particles fall under gravity they tend to come to rest in their most stable positions: that is, their minor principal axes will be vertical (e.g. Cavarretta, 2009). Geological processes could cause post-depositional orientation changes for the intact material, but during site visits no significant dip was observed in the soil strata, and there were no obvious depositional features such as cross-bedding. For the intact soil the more elongated particles, whose lower aspect ratio values are represented by the lighter shading, are more likely to come to rest in this ‘stable’ position. The elonga-tion bias is less marked in the reconstituted samples. The horizontal projections of both datasets do not indicate any particular directional bias; the small variations in the ob-served frequencies are a consequence of the finite number of PO vectors considered (Figs 3(b) and 3(d)).
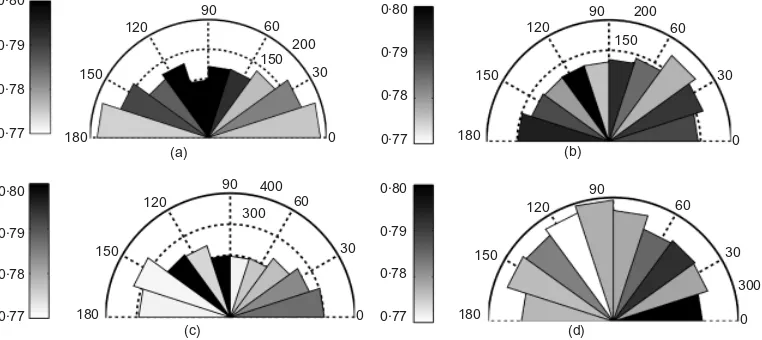
The evolution of the particle orientations in the vertical plane during shearing can be appreciated by reference to Fig. 4, where rose diagrams for stage 3 (emergence of shear band) and stage 4 (close to the critical state) are presented. Referring to Fig. 4(a), outside the shear band in the intact material the particle orientations in the vertical plane be-come more isotropic, compared with Fig. 3(a); the same trend was observed for load stage 4. This is believed to be due to detachment of the small fragments as the particles undergo breakage (Fonseca et al., 2012), because these fragments would be more likely to have random orientations. This hypothesis is supported by the fact that in the recon-stituted material the initial orientations are affected only by the appearance of the shear band. In comparison with the
0·80 0·79 0·78 0·77 180
150 120
90 60 150
200 30
0 (a)
0·80 0·79 0·78
0·77 180 150
120 90
60 150
200
30
0 (b)
0·80 0·79 0·78
0·77 180 150
120
90
60 400 300
30
0 (c)
0·80 0·79 0·78
0·77 180 150
120 90
60
300 30
[image:5.595.116.497.571.741.2]0 (d)
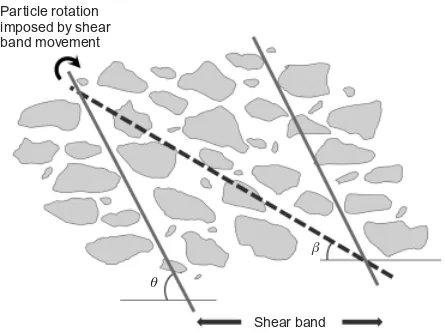
initial condition, the particle orientations in the intact sam-ples are no longer aspect-ratio dependent. While there is evidence that the particles fragmented along pre-existing cracks in the material, this process did not significantly change the range of aspect ratios in the material (Fonsecaet al., 2012). In both cases the particles in the samples that intercept the shear band (Figs 4(b), 4(c), 4(f) and to a lesser extent Figs 4(d) and 4(e)) reorient during shearing, illustrat-ing the heterogeneity of the sample response. As schematic-ally illustrated in Fig. 5, the particles reorient in response to the shear band developing, an observation also reported by
Oda & Kazama (1998). The predominant particle orientation is given by the major principal fabric (angle ), and the orientation of the shear band is represented by Ł.
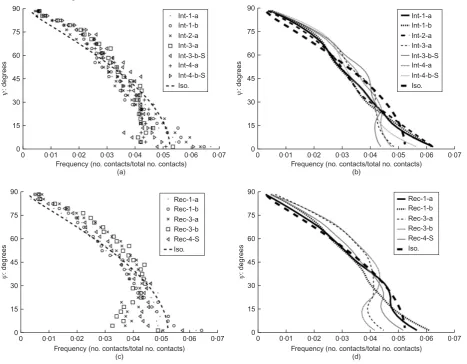
The distributions of the ł angles for the intact and reconstituted samples are illustrated in Fig. 6. Presenting the data in this format allows easy visualisation of the evolution of orientations. The smoothed data presented in Figs 6(b) and 6(d) confirm the trends observed in the rose diagrams. In comparison with an isotropic material, initially (stages 1 and 2) fewer particles are oriented with ł.308, and more particles have close to horizontal orientations (i.e. ł,308) for both the intact and reconstituted soils. Outside the shear planes, the intact samples in stages 3 and 4 (3-a and Int-4-a) have an almost isotropic distribution, with slightly fewer horizontally oriented particles (i.e. ł,308) than in stages 1 and 2.
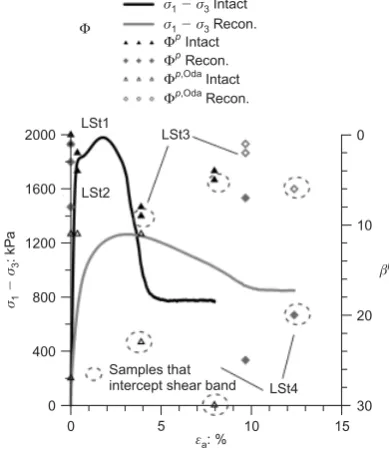
The deviatoric fabric data for the particlesÖ1pÖ3p are
given in Fig. 7, both considering the unweighted particle orientations and using the particle fabric tensor proposed by Oda et al. (1985). As was evident from the rose diagrams, the anisotropy of the intact material outside the shear band seems to decrease during loading. This evolution is not evident for the reconstituted material. Oda’s fabric tensor indicates less significant differences in the anisotropy when comparing the material inside and outside the shear band. The orientation of the major principal fabric to the horizon-tal is illustrated in Fig. 8. The data confirm, to some extent, the earlier observations from Figs 3, 4 and 6: initially, with the exception of one data point, the orientations are less than 208 from the horizontal, indicating a strong preference towards horizontal orientations. As shearing progresses, the orientations become less clearly horizontal; however, the eigenvector orientations appear to be less effective than the
0·80 0·79 0·78
0·77 180 150
120
90
60 30
0
0·80 0·79 0·78
0·77 180 150
120
90
60 Shear band
30
0
Shear band
400
500
Shear band
400
(a) (b)
0·80 0·79 0·78
0·77 180 150
120
90
60 400
500 30
0 (c)
0·80 0·79 0·78
0·77 180 150
120
90
60 300
30
0 (d)
0·80 0·79 0·78
0·77 180 150
120 90
60 400 300
30
0 (e)
0·80 0·79 0·78
0·77 180 150
120 90
60 300
30
0 (f)
[image:6.595.91.492.53.371.2]300 300
Fig. 4. Rose diagrams giving evolution of particle orientations during loading (shading indicates average aspect ratios of particles oriented within each angular bin): (a) vertical (x–z) plane Int-3-a; (b) vertical (x–z) plane Int-3-b-S; (c) vertical (x–z) plane Int-4-b-S; (d) vertical (y–z) plane Rec-3-a; (e) vertical (x–z) plane Rec-3-b; (f) vertical (x–z) plane Rec-4-S
Particle rotation imposed by shear band movement
θ
β
Shear band
Fig. 5. Schematic diagram of change in fabric observed inside and outside shear band: angle Ł indicates orientation of shear band; alignment of particles inside shear band given by angle (major principal fabric)
[image:6.595.51.273.567.733.2]rose diagrams or frequency distributions in identifying a change in orientation. This may be because the material becomes less anisotropic as shearing progresses.
The eigenvector orientations provide insight into the material response within the shear bands. The shear band orientations at load stage 4 were 638and 578relative to the horizontal for the intact and reconstituted specimens respec-tively. Table 2 gives the orientations of the major principal eigenvectors to the horizontal (P) using both the weighted and weighted particle fabric tensors. The un-weighted fabric tensors give angles of 238 and 308 for the intact samples affected by the shear band at load stages 3 and 4 respectively, and 208 for the reconstituted sample at load stage 4. The weighted fabric tensor adds more weight to the larger particles to give angles that are considerably lower (58to 98); this is an average value, and the results will also be influenced by those particles that are in the samples but not in the shear band. It is difficult to relate these orientations directly to the shear plane orientation, owing to the three-dimensional nature of the shear plane, and uncer-tainty about the exact orientation of the cylindrical core relative to this plane. This shows that for both intact and reconstituted samples the small particles have more random orientations, diverging from the main trend.
CONTACT ORIENTATIONS
The voxel set defining each contact formed an irregular surface, so, as schematically illustrated in Fig. 1, a least-squares regression was applied to identify a best-fit plane for each surface, and this plane defined the contact normal
orientation. Figs 9 and 10 present rose diagrams of the contact normal orientations prior to shearing and for stages 3 and 4. In Figs 9 and 10 each bin is shaded by the average area of the contacts whose normal orientations lie within that bin. As the contact areas change significantly during shearing, a common greyscale range cannot be adopted for all the plots. The horizontal projections are not shown, as they were isotropic. Fig. 11 presents the distributions of contact normal orientations to the horizontal, and Figs 12 and 13 present the anisotropy and preferred orientations as calculated by eigenvalue analysis of the fabric tensor. Two fabric tensors were considered: in the first case, equation (3) was applied directly using the unit contact normal vectors, and in the second case a weighted fabric tensor was calcu-lated as
ÖCN(W)
ij ¼
1 ø
XN
k¼1
niknkjøk (6)
where ø is the sum of all the contact sizes, and øk is the size of contact k. Referring to Figs 9 and 11, prior to loading the vectors show essentially an isotropic distribution with a slight bias in the vertical direction, for both samples. The contacts are significantly smaller for the reconstituted sample. There is also a bias in the intact sample for the larger contacts to have horizontally oriented contact normals, and this bias is not evident for the reconstituted material. Once shearing commences, there is a reduction in the contact areas for the intact samples. There is also a clear reorientation of the preferential contact normal orientations towards the vertical (Figs 10, 11(b) and 11(d)), with the
0 15 30 45 60 75 90
0 0·01 0·02 0·03 0·04 0·05 0·06 0·07
ψ
: deg
rees
Frequency (no. particles/total no. particles) (a)
Int-1-a Int-1-b Int-2-a Int-3-a Int-3-b-S Int-4-a Int-4-b-S Iso.
Int-1-a Int-1-b Int-2-a Int-3-a Int-3-b-S Int-4-a Int-4-b-S Iso.
0 15 30 45 60 75 90
0 0·01 0·02 0·03 0·04 0·05 0·06 0·07
ψ
: deg
rees
Frequency (no. particles/total no. particles) (b)
Rec-1-a Rec-1-b Rec-3-a Rec-3-b Rec-4-S Iso.
0 15 30 45 60 75 90
0 0·02 0·04 0·06 0·08
ψ
: deg
rees
Frequency (no. particles/total no. particles) (c)
0 15 30 45 60 75 90
0 0·02 0·03 0·06 0·07
ψ
: deg
rees
Frequency (no. particles/total no. particles) (d)
Rec-1-a Rec-1-b Rec-3-a Rec-3-b Rec-4-S Iso.
[image:7.595.77.537.47.408.2]0·01 0·04 0·05
extent of this reorientation being similar for both materials, as evidenced in the principal fabric orientation data pre-sented in Fig. 13. This type of realignment of contact normals to be approximately coincident with the major principal stress orientation has been demonstrated in numer-ous DEM simulations using ideal particle geometries and contact models (e.g. Barreto, 2009). It suggests the forma-tion of chains of particles with relatively large, and hence stable, contacts that are parallel to the major principal stress direction. The relationship between deviatoric stress (13) and fabric (ÖCN1 Ö
CN
3 ) previously observed in
DEM simulations (e.g. Thornton, 2000) is less evident. In particular, comparing load stages 1 and 2 in Fig. 12 there is an initial decrease in anisotropy caused by the destruction of the inherent fabric upon shearing. For both the intact and reconstituted materials the values of ÖCN1 ÖCN
3 are larger
in stages 3 and 4 than in stages 1 and 2, but it is not known when this increase occurred, or whether it was pre-peak. However, there is then a clear overall decrease in
ÖCN
1 ÖCN3 between load stages 3 and 4.
BRANCH VECTOR ORIENTATIONS
The branch vector is defined as the vector connecting the centroids of two particles in contact, as illustrated in Fig. 14. The rose diagrams for the initial branch vectors are
0 0·04 0·08 0·12 0·16
0 5 10 15
εa: %
(a) 2000
1600 1200 800 400 0 LSt1
σσ13
: kP
a
⫺ pΦ⫺1
Φ
p 3
LSt2
LSt3
LSt4
Samples that intercept shear band
σ1⫺σ3Intact
σ1⫺σ3Recon. Φp
1⫺Φ p 3 Intact Φp1⫺Φ
p 3 Recon.
0 0·01 0·02 0·03 0·04
0 5 10 15
εa: %
(b) 2000
1600 1200 800 400 0 LSt1
σσ13
: kP
a
⫺ pΦ⫺1
Φ
p 3
LSt2
LSt3
LSt4 Samples that intercept shear band
σ1⫺σ3Intact
σ1⫺σ3Recon. Φ1p⫺Φ
p
[image:8.595.319.514.55.282.2]3 (Oda) Intact Φ1p⫺Φp3 (Oda) Recon.
Fig. 7. Deviatoric fabric for particle orientations: (a) using ‘simple’ unweighted fabric tensor; (b) using fabric tensor for particle orientations proposed by Odaet al.(1985)
30 20 10 0
0 5 10 15
εa: %
2000 1600 1200 800 400 0
LSt1
σσ13
: kP
a
⫺
LSt2
LSt3
LSt4 Samples that
intercept shear band
σ1⫺σ3Intact
σ1⫺σ3Recon.
ΦpIntact
ΦpRecon.
Φp,OdaIntact
Φp,OdaRecon.
βp
[image:8.595.294.532.55.650.2]Φ
Fig. 8. Evolution of major principal fabric orientation using ‘simple’ unweighted fabric tensor for particle orientations, and fabric tensor for particle orientations proposed by Oda et al.
[image:8.595.55.272.58.512.2](1985)
Table 2. Comparison of values for unweighted (Öp) fabric
tensor and using Odaet al.(1985) particle fabric tensor (Öp,Oda)
for samples intercepting shear band
Sample reference p: degrees p,Oda: degrees
Int-3-b-S 23 9
Int-4-b-S 30 5
Rec-4-S 20 6
500 475 450 425
400 180 150
120
90
60 30
4000 0
95 90 85 80
75 180 150
120 90
60 30
2500 0 (b)
(a)
Fig. 9. Rose diagrams of contact orientations for intact and reconstituted samples prior to loading (shading indicates average contact area in ìm2 for contacts with normals oriented within
each angular bin): (a) vertical (x–z) plane Int-1-b; (b) vertical (x–z) plane Rec-1-a
[image:8.595.300.538.374.659.2]illustrated in Fig. 15, and as there was no apparent bias in the orientations with branch vector lengths, shading has been omitted for clarity. In comparison with the contact normal orientations these vectors have a more isotropic distribution in the vertical plane. The eigenvector orientations during shearing are shown in Fig. 16, and it is clear for the intact samples that as shearing progresses the branch vectors are more likely to have a vertical orientation, excluding the samples that partially intercept the shear band; this tendency is less evident for the reconstituted samples. As was the case with the deviatoric fabricÖCN1 ÖCN3 it is difficult to assess
in Fig. 17 whether ÖBV1 ÖBV
3 increases between the initial
and peak stages, but there does appear to be a decrease in
ÖBV
1 ÖBV3 between load stages 3 and 4.
It does not necessarily follow that the branch vectors and the contact vectors should be collinear, and referring to the schematic diagram in Fig. 14, where these vectors are not collinear, there is a moment transmission at the contacts (e.g. O’Sullivan, 2011). The relationship between the branch vectors and the contact normals was investigated by consid-ering the angle between the two vectors, denoted by Æ. The distribution of Æ is plotted in Fig. 18 for the intact samples outside the shear band (Int-1-a, Int-2-a, Int-3-a and Int-4-a). With the exception of a few cases the maximum value of Æ is 608, and the most frequent value of Æ is approximately 208. No significant variation can be seen for samples at different load stages, which is in agreement with the ob-servation made by Ng (1999), although Ng did report a significantly narrower range of Æ values. For the current studyÆtended to decrease with increasing contact size.
VOID ORIENTATIONS
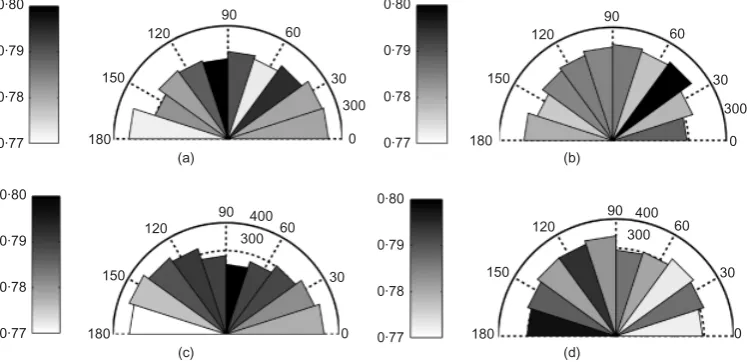
While particles are physical features in the image, the definition of individual voids is more abstract or subjective, as voids connect with each other (Shire et al., 2012). As noted above, here a watershed segmentation approach was used to distinguish individual pores (Atwood et al., 2004). The void analysis was carried out for six samples at load stages 1 and 3. Given the smaller amount of void data, the eigenvalue analysis data are not considered here. Fig. 19 illustrates the initial void orientations, and they seem to have a slight bias towards being horizontally oriented, particularly for the reconstituted sample. However, during shearing this bias is eliminated, with the voids seeming to be slightly vertically oriented (Fig. 20). The shear band clearly influ-ences the overall distribution of void orientations, as evi-denced in Fig. 20(b).
DISCUSSION
The analyses of the micro-CT data, including the particle morphologies (Fonseca et al., 2012), the scalar data on soil fabric and the directional fabric data presented here, allow a conceptual model of the soil response to be created, as summarised in the schematic diagrams in Fig. 21. Fig. 21(a) shows the intact soil prior to loading; the majority of the particles are horizontally oriented, and a similar trend is observed for the voids. Both the contact normal vectors and the branch vectors show a more isotropic distribution. For the intact soil in the post-peak regime, the larger particles are essentially horizontal, while the detached fragments
105
2000
2000
(a) (b)
300 280 260 240 180
150 120
90
60
3000 30
0 (c)
95 90
80
75 180 150
120
90 60
2500 30
0 (d)
95 90
80
75 180 150
120 90
60
2500 30
0 (e)
95 90
80
75 180 150
120 90
60 300
30
0 (f)
125 120
110
105 180 150
120
90
60 30
0 115
125 120
110
180 150
120 90
60 1500
30
0 115
2000
85
85 85
[image:9.595.101.512.53.373.2]3000
Fig. 10. Rose diagrams giving contact orientations for intact and reconstituted samples at stages 3 and 4 (shading indicates average contact area inìm2for contacts with normals oriented within each angular bin): (a) vertical (x–z)
exhibit random orientations (Fig. 21(b)). At this stage the voids show an increase in size as a consequence of the dilation, and their orientations are more random compared with the previous stage. Outside the shear band the contact
Int-1-a Int-1-b Int-2-a Int-3-a Int-3-b-S Int-4-a Int-4-b-S Iso.
Int-1-a Int-1-b Int-2-a Int-3-a Int-3-b-S Int-4-a Int-4-b-S Iso.
Rec-1-a Rec-1-b Rec-3-a Rec-3-b Rec-4-S Iso.
Rec-1-a Rec-1-b Rec-3-a Rec-3-b Rec-4-S Iso. 0
15 30 45 60 75 90
0 0·01 0·02 0·03 0·04 0·05 0·06 0·07
ψ
: deg
rees
Frequency (no. contacts/total no. contacts) (a)
0 15 30 45 60 75 90
0 0·01 0·02 0·03 0·04 0·05 0·06 0·07
ψ
: deg
rees
Frequency (no. contacts/total no. contacts) (b)
0 15 30 45 60 75 90
0 0·01 0·02 0·03 0·04 0·05 0·06 0·07
ψ
:
d
eg
rees
Frequency (no. contacts/total no. contacts) (c)
0 15 30 45 60 75 90
0 0·01 0·02 0·03 0·04 0·05 0·06 0·07
ψ
: deg
rees
[image:10.595.58.526.49.413.2]Frequency (no. contacts/total no. contacts) (d)
Fig. 11. Contact normal orientation (angle) distributions for intact samples: (a) raw data for intact samples; (b) smoothed data for intact samples; (c) raw data for reconstituted samples; (d) smoothed data for reconstituted samples
0 0·04 0·08 0·12 0·24
0 5 10 15
εa: %
2000
1600
1200
800
400
0 LSt1
σσ13
: kP
a
⫺
LSt2
LSt3
LSt4
Samples that intercept shear band
σ1⫺σ3Intact
σ1⫺σ3Recon.
0·20 0·16
Φ
CN 1
⫺
Φ
CN 3 ΦCN1 ⫺Φ
CN 3 Intact ΦCN1 ⫺Φ
CN 3 Recon. ΦCN(W)1 ⫺Φ
CN(W) 3 Intact ΦCN(W)1 ⫺Φ
CN(W) 3 Recon.
Fig. 12. Contact normal deviatoric fabric evolution during loading
80 60 0
0 5 10 15
εa: %
2000
1600
1200
800
400
0 LSt1
σσ13
: kP
a
⫺
LSt2 LSt3 LSt4 Samples that intercept shear band
σ1⫺σ3Intact
σ1⫺σ3Recon.
20
40
ΦCNIntact
ΦCNRecon.
ΦCN(W)Intact
ΦCN(W)Recon.
[image:10.595.52.278.476.747.2]βCN
Fig. 13. Evolution of major principal fabric orientation for contact normals using unweighted fabric tensor for particle orientations, and weighted fabric tensor for particle orientations
[image:10.595.304.532.476.689.2]normals have a strong concentration along the vertical, and the branch vectors show a slight concentration, also along the vertical direction. For the same stage, the movement along the shear band causes the particles to rotate in the direction of the shear plane (Fig. 21(c)). Therefore, inside the shear band, the contact normal vectors and the branch vectors show a deviation from the vertical plane towards the direction of the shear plane.
For the reconstituted soil prior to loading, as identified by Fonseca et al. (2012), the small fragments have been detached from the large particles during reconstitution, even if the reconstitution process was carried out very gently. The majority of the particles, regardless of their size, show a horizontal orientation (Fig. 21(d)). The distribution of the branch vectors and the voids shows a slight concentration along the horizontal direction, while the contact normals exhibit an isotropic distribution. In the post-peak regime the particles remain essentially horizontal outside the shear band, while the contact normals show a strong concentration along the vertical direction, and a similar – yet less pronounced – trend is observed for the branch vectors (Fig. 21(e)). At the same stage, the movement caused by the shear band makes the particles rotate towards the direction of the shear plane, and the contact normal and branch vectors also tend to
deviate from the vertical direction inside the shear band (Fig. 21(f)).
CONCLUSIONS
Micro-CT was used to extend our understanding of soil response at the particle scale by directly and quantitatively analysing the directional fabric of intact and reconstituted soil in three dimensions at various points during shearing.
(a) In their initial state the particle long-axis orientations tended to be oriented in the horizontal plane, that is, perpendicular to the direction of deposition.
(b) For the reconstituted samples, the initial horizontal preferred orientation persisted even after a critical state had apparently been reached (for the particles not affected by the shear band movement).
(c) For the intact soil, the small fragments detached during the dilation of the soil exhibit random orientations, but the large grains remain essentially horizontal. A particle
α
[image:11.595.323.546.55.262.2]BV CN
Fig. 14. Schematic diagram illustrating branch vector and con-tact normal
2000 2000
180 150
120
90
60 30
0 1500
(a)
180 150
120
90
60 30
0 1500
(b) 2000
180 150
120
90
60 30
0 2500
(c)
180 150
120
90
60 30
0 2500
(d) 2000
Fig. 15. Branch vector orientations for both sample types prior to loading: (a) vertical (x–z) plane Int-1-a; (b) horizontal (x–y) plane Int-1-a; (c) vertical (x–z) plane Rec-1-a; (d) horizontal (x–y) plane Rec-1-a
0 0·01 0·04 0·05 0·07
0 5 10 15
εa: %
2000
1600
1200
800
400
0 LSt1
σσ13
: kP
a
⫺
LSt2
LSt3
LSt4
Samples that intercept shear band
σ1⫺σ3Intact
σ1⫺σ3Recon.
0·06
Φ
BV 1
⫺
Φ
BV 3 ΦB V1 ⫺Φ
B V 3 Intact ΦB V
1 ⫺Φ B V 3 Recon.
[image:11.595.65.291.59.214.2]0·02 0·03
[image:11.595.153.460.549.740.2]orientation fabric tensor that takes into consideration the size and shape of the grains is better to describe the fabric evolution of this material upon shearing.
(d) The concentration of contact normals along the direction of the major principal stress was observed in the post-peak regime for both the intact and reconstituted soil, as postulated by the force chain theory and observed in prior photoelastic tests and DEM analyses. The effect of the movement inside the shear band was to deviate the contact normal vectors from the vertical, which is associated with the buckling of the force chains. In contrast to the response observed in photoelastic and DEM analyses, upon shearing, for both materials, the contact normal deviatoric fabric exhibits an initial decrease, indicating a destructuring of the material. (e) The branch vector orientations also became more vertical
during shearing, but the trend was slightly different in those samples that intercepted the shear band. The branch vectors and contact normals tended not to be collinear, with the angles frequently differing by 208.
(f) Initially the voids tended to have a slight horizontal bias in their long-axis orientations, just as was the case for the particles, but upon shearing this bias became less evident.
ACKNOWLEDGEMENTS
The investigation presented in this paper was carried out under the financial support of a Portuguese government
80 60 0
0 5 10 15
εa: %
2000
1600
1200
800
400
0 LSt1
σσ13
: kP
a
⫺
LSt2
LSt3 LSt4 Samples that
intercept shear band
σ1⫺σ3Intact
σ1⫺σ3Recon.
20
40
ΦCNIntact
ΦCNRecon.
[image:12.595.300.535.44.390.2]βBV
Fig. 17. Evolution of major principal fabric orientation for branch vectors
0 0·05 0·10 0·15 0·20
0 15 30 45 60 75 90
F
requency
α: degrees (a)
Int-1-a:α50⫽20·1° Int-2-a:α50⫽19·6° Int-3-a:α50⫽20·3° Int-3-b-S:α50⫽21·3° Int-4-a:α50⫽21·0° Int-4-b-S:α50⫽20·8°
Rec-1-a:α50⫽20·9° Rec-3-a:α50⫽21·4° Rec-4-S:α50⫽21·1°
0 0·05 0·10 0·15 0·20
0 15 30 45 60 75 90
F
requency
[image:12.595.55.275.56.279.2]α: degrees (b)
Fig. 18. Distribution of angle Æ between branch vectors and contact normals, indicating median values (i.e. Æ50): (a) intact
samples; (b) reconstituted samples
0·80 0·79 0·78
0·77 180 150
120 90
60 30
0 0·80 0·79 0·78
0·77 180 150
120 90
60 30
0 0·80
0·79 0·78
0·77 180 150
120 90
60 400 300
30 0
400 0·80
0·79 0·78
0·77 180 150
120
90 60 300
30
0
300 300
(a) (b)
(c) (d)
Fig. 19. Void long-axis orientations for both intact and reconstituted samples prior to loading (shading indicates average void volume in ìm3 for voids with long axes oriented within each angular bin):
(a) vertical (x–z) plane Int-1-a; (b) horizontal (x–y) plane Int-1-a; (c) vertical (x–z) plane Rec-1-a; (d) horizontal (x–y) plane Rec-1-a
[image:12.595.104.478.552.733.2]body, Fundac¸a˜o para a Cieˆncia e a Tecnologia, as part of the PhD research of the first author. The authors would also like to express their gratitude to GE Measurement & Control Solutions (Du¨sseldorf, Germany). The authors gratefully acknowledge the EPSRC (EP/F001452/1 & EP/I02249X/1) for funding.
NOTATION
dA incremental area
ap,bp,cp major, intermediate and minor half lengths of particlep d50 mean particle size
N total number of vectors in system
Np number of particles
nk
i unit orientation vector along directioni
p9 mean normal effective stress (¼(13)/3) q deviatoric stress (¼13)
Sijp shape tensor for particlep Tij orientation tensor for particlep
Æ angle between branch vector and contact normal
angle given by the major principal eigenvector of fabric tensor
P for the fabric tensor of the particle long axis a axial strain
Ł orientation of shear band
0·80 0·79 0·78
0·77 180 150
120 90
60 30
0 0·80
0·79 0·78
0·77 180 150
120 90 60
200 30
0
0·80 0·79 0·78
0·77 180 150
120 90
60 200
30
0 0·80
0·79 0·78
0·77 180 150
120
90 60
30
0
300 150
(a) (b)
(c) (d)
100
[image:13.595.119.490.53.234.2]150
Fig. 20. Void long-axis orientations for intact and reconstituted samples, illustration of evolution during loading (shading indicates average void volume inìm3 for voids with long axes oriented within each
angular bin): (a) vertical (x–z) plane Int-3-a; (b) vertical (x–z) plane Int-3-b-S; (c) vertical (x–z) plane Rec-3-a; (d) vertical (x–z) plane Rec-3-b
θ⬇63° β⬇23–30°
θ⬇57°
β⬇20°
(a) (b) (c)
(d) (e) (f)
[image:13.595.59.545.313.589.2]Poisson’s ratio
1 axial effective stress
3 radial effective stress
Öij fabric tensor
Ö1,Ö3 maximum and minimum eigenvalues of fabric tensor Öpart
ij fabric tensor that considers the shape and orientation of
particles
dł angular increment
ł angle measured from the horizontal (x–y)
ø sum of all contact sizes
øk size of contactk
REFERENCES
Arthur, J. & Menzies, B. (1972). Inherent anisotropy in a sand.
Ge´otechnique 22, No. 1, 115–128, http://dx.doi.org/10.1680/ geot.1972.22.1.115.
Atwood, R. C., Jones, J. R., Lee, P. D. & Hench, L. L. (2004). Analysis of pore interconnectivity in bioactive glass foams using X-ray microtomography.Scripta Mater.51, No. 11, 1029–1033. Barreto, D. (2009). Numerical and experimental investigation into
the behaviour of granular materials under generalised stress states. PhD thesis, University of London, UK.
Been, K. & Jefferies, M. G. (1985). A state parameter for sands.
Ge´otechnique35, No. 2, 99–112, http://dx.doi.org/10.1680/geot. 1985.35.2.99.
Beucher, S. & Lantuejoul, C. (1979).Use of watersheds in contour detection. Rennes, France: CCETT.
Cavarretta, I. (2009).The influence of particle characteristics on the engineering behaviour of granular materials. PhD thesis, De-partment of Civil and Environmental Engineering, Imperial College London, UK.
Chan, H. T. & Kenney, T. C. (1973). Laboratory investigation of permeability ratio of New Liskeard varved soil. Can. Geotech. J.10, No. 3, 453–472.
Cresswell, A. & Powrie, W. (2004). Triaxial tests on an unbonded locked sand. Ge´otechnique 54, No. 2, 107–115, http://dx.doi. org/10.1680/geot.2004.54.2.107.
Cuccovillo, T. & Coop, M. R. (1999). On the mechanics of structured sands. Ge´otechnique 49, No. 6, 741–760, http://dx. doi.org/10.1680/geot.1999.49.6.741.
Dafalias, Y., Papadimitriou, A. & Li, X. S. (2004). Sand plasticity model accounting for inherent fabric anisotropy.J. Engng Mech.
130, No. 11, 1319–1333.
Tovey, N. K. & Dadey, K. A. (2002). Quantitative orientation and micro-porosity analysis of recent marine sediment microfabric.
Quaternary Int.92, No. 1, 89–100.
Dusseault, M. B. & Morgenstern, N. R. (1979). Locked sands.Q. J. Engng Geol.12, No. 2, 117–131.
Fonseca, J. (2011). The evolution of morphology and fabric of a sand during shearing. PhD thesis, Imperial College London, University of London, UK.
Fonseca, J., O’Sullivan, C., Coop, M. R. & Lee, P. D. (2012). Non-invasive characterisation of particle morphology of natural sands.Soils Found.52, No. 4, 712–722.
Haralick, R. & Shapiro, L. (1992). Computer and robot vision. Boston, MA, USA: Addison Wesley Longman.
Ibrahim, A. A. & Kagawa, T. (1991). Microscopic measurement of sand fabric from cyclic tests causing liquefaction.Geotech. Test. J.14, No. 4, 371–382.
Ibraim, E., Lanier, J., Muir Wood, D. & Viggiani, G. (2010). Strain path controlled shear tests on an analogue granular material.
Ge´otechnique 60, No. 7, 545–559, http://dx.doi.org/10.1680/ geot.8.P.100.
Kuwano, R. & Jardine, R. J. (2002). On the applicability of cross-anisotropic elasticity to granular materials at very small strains.
Ge´otechnique 52, No. 10, 727–749, http://dx.doi.org/10.1680/ geot.2002.52.10.727.
Mathworks (2011). MATLAB Release 7.12. Natick, MA, USA: Mathworks, Inc.
Ng, T.-T. (1999). Fabric study of granular materials after compac-tion.J. Engng Mech.125, No. 12, 1390–1394.
Ng, T.-T. (2004). Macro- and micro-behaviors of granular materials under different sample preparation methods and stress paths.Int. J. Solids Struct.41, No. 21, 5871–5884.
Oda, M. (1972). Initial fabric and their relations to mechanical properties of granular material.Soils Found.12, No. 1, 17–36. Oda, M. & Kazama, H. (1998). Microstructure of shear bands and
its relation to the mechanisms of dilatancy and failure of dense granular soils. Ge´otechnique 48, No. 4, 465–481, http://dx.doi. org/10.1680/geot.1998.48.4.465.
Oda, M., Nemat-Nasser, S. & Konishi, J. (1985). Stress induced anisotropy in granular masses.Soils Found.25, No. 3, 85–97. O’Sullivan, C. (2011).Particulate discrete element modelling.
Lon-don, UK: Taylor & Francis.
Phillion, A. B., Lee, P. D., Maire, E. & Cockcroft, S. L. (2008). Quantitative assessment of deformation-induced damage in a semisolid aluminum alloy via X-ray micro tomography. Metall. Mater. Trans. A39, No. 10, 2459–2469.
Satake, M. (1982). Fabric tensor in granular materials. Proceedings of the IUTAM conference on deformation and failure of granular materials, Delft, pp. 63–67.
Shire, T., O’Sullivan, C., Barreto, D. & Gaudray, G. (2012). Quantifying stress-induced anisotropy using inter-void constric-tions.Ge´otechnique, http://dx.doi.org/10.1680/geot.11.T.020. Thornton, C. (2000). Numerical simulations of deviatoric shear
deformation of granular media.Ge´otechnique50, No. 1, 43–53, http://dx.doi.org/10.1680/geot.2000.50.1.43.
Vaid, Y. P. & Sivathayalan, S. (2000). Fundamental factors affecting liquefaction susceptibility of sands.Can. Geotech. J.37, No. 3, 592–606.
Ventouras, K. & Coop, M. R. (2009). On the behaviour of Thanet Sand: an example of an uncemented natural sand.Ge´otechnique
59, No. 9, 727–738, http://dx.doi.org/10.1680/geot.7.00061. Wilkinson, S. (2011). The microstructure of UK mudrocks. PhD
thesis, Imperial College London, University of London, UK. Zdravkovic, L. & Jardine, R. (1997). Some anisotropic stiffness
characteristics of a silt under general stress conditions. Ge´otech-nique 47, No. 3, 407–438, http://dx.doi.org/10.1680/geot.1997. 47.3.407.
Zhang, Q., Lee, P. D., Singh, R., Wua, G. & Lindley, T. C. (2009). Micro-CT characterization of structural features and deformation behavior of fly ash/aluminum syntactic foam. Acta Mater. 57, No. 10, 3003–3011.