A Novel Visual Pipework Inspection System
Rahul Summan
1, a, William Jackson
1, Gordon Dobie
1, Charles MacLeod
1, Carmelo
Mineo
1, Graeme West
1, Douglas Offin
2, Gary Bolton
2, Stephen Marshall
1,
Alexandre Lille
11 - Department of Electronic and Electrical Engineering, University of Strathclyde, Glasgow, G1 1XW, United Kingdom
2 - National Nuclear Laboratory, Chadwick House, Warrington Road, Birchwood Park, Warrington, WA3 6AE, United Kingdom
a)Corresponding author: [email protected]
Abstract. The interior visual inspection of pipelines in the nuclear industry is a safety critical activity conducted during outages to ensure the continued safe and reliable operation of plant. Typically, the video output by a manually deployed probe is viewed by an operator looking to identify and localize surface defects such as corrosion, erosion and pitting. However, it is very challenging to estimate the nature and extent of defects by viewing a large structure through a relatively small field of view. This work describes a new visual inspection system employing photogrammetry using a fisheye camera and a structured light system to map the internal geometry of pipelines by generating a photorealistic, geometrically accurate surface model. The error of the system output was evaluated through comparison to a ground truth laser scan (ATOS GOM Triple Scan) of a nuclear grade split pipe sample (stainless steel 304L, 80mm internal diameter) containing defects representative of the application – the error was found to be submillimeter across the sample.
INTRODUCTION
Remote internal visual (RVI) inspection of the pipework in the nuclear industry is a periodic activity done to ensure the safe operation of the plant. Currently such inspection is carried out by the operator by monitoring the live camera view of the surface. This can be challenging as with distance, observing the surface defects can be difficult. The limited field of view of the camera provides minimal context awareness making it difficult to quantify large defective regions. The quality of the images is often very low causing further issues in identifying defects.
A probe system consisting of a laser profiler, fish eye lens camera and inertial measurement unit (IMU) is developed. Using bespoke hardware and an image feature based Structure from Motion (SFM) algorithm, the system is capable of generating a photorealistic, geometrically accurate surface model. The image sequence returned from the camera is processed by a structure from motion (SFM) algorithm to construct a 3D surface model of the pipe. Amongst the many advantages of this probe over the conventional RVI equipment the most significant are improved inspection quality and traceability, provide accurate defect localization and sizing, Minimization of inspection/interpretation time of video and also that the probe can act as a positioning system for additional sensors [1].
PROBE DESIGN
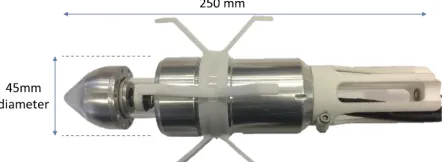
camera which enabled the acquisition of a 360°, 640 x 480 pixel image of a subsection of the pipe surface in a single shot. The laser profiler projects a red laser line onto the surface of the pipe and into the field of view of the camera, by which the cross sectional geometry of the pipe can be measured through the principles of triangulation. The probe is also equipped with an Inertial Measurement Unit (IMU) which is used to assist when low/zero feature regions are encountered. The IMU can synchronize the measurements with the camera and also have a potential to provide a source of scaling information for the reconstruction. The probe is also designed to have centraliser legs to hold it approximately central in pipe. This is an add on feature and is not a requirement for measurements.
[image:2.612.203.424.169.250.2]FIGURE 1. Dimensions of the probe.
FIGURE 2. Associated subsystems of the probe.
IMAGE FEATURE EXTRACTION
The image processing front end makes use of SIFT (Scale Invariant Feature Transform) features [2] to track the motion of the camera and compute a surface point cloud. Prior to online operation, the camera must be calibrated to determine the mapping from a 3D scene point to a 2D image point. The OCamCalib Toolbox [3] was used to calibrate the camera with sub-pixel accuracy. The image is summarised by a set of point features corresponding to textured 16x16 pixel patches of the image. For 3D reconstruction at least 8 features must be matched across the images to compute the essential matrix and must be evenly distributed around the image. If more features are available least squares estimate can be used. Essential matrix is decomposed into a rigid body transform which can be parameterised as in equation (1)
𝑝 = [𝑥, 𝑦, 𝑧, 𝜃𝑥, 𝜃𝑦, 𝜃𝑧] (1)
wherex,yandz correspond to 3D position while the remaining elements 𝜃𝑥, 𝜃𝑦 and 𝜃𝑧 are the roll, pitch and yaw
angles of the probe respectively.Importantly, by tracking the pose of the probe there is no requirement for it to travel axially along the pipe, this has clear advantages with respect to the deployment mechanism. An example of features tracked between successive image frames is shown in Fig. 3 - a zoomed in region is also shown for clarity. The red dots indicate features extracted in the first image while the blue dots indicate where these feature move to in the second image as a result of camera motion. However, the computed translation is a unit vector indicating the direction of motion rather than the true magnitude of the translation [4]. This leads to two separate problems related to scaling in
Laser Line Projector
Fisheye Camera, LED Illumination Ring and
Diffuser
Inertial Measurement Unit and Drive
terms of local and global scale ambiguity. This problem is resolved using a rescaling technique [5] and thus enables a scaled model to be constructed.
FIGURE 3. Features tracked in successive frame images.
In SIFT each feature is a 2D projection of a 3D point lying on the surface of the pipe. If the same point is observed from at least two images, triangulation may be employed to recover the 3D coordinates of the point [6]. Through estimation of the camera pose and triangulation of image features across a sequence of images for linear travel inside the pipe, the point cloud can be generated. During image acquisition the camera underwent linear motion along the pipe axis and so it can be seen that camera path is successfully reconstructed from the image data. The global scale ambiguity in this case was solved by incorporating prior knowledge of the pipe diameter. The point cloud generated by the camera gives rises to a number approaches for the visualisation of the pipe. A meshing approach of [7] to enable arbitrary shape modelling is utilized for the visualization of the pipe. The use of multiple short segments allows bends in the pipe to be modelled. A curve fitting procedure was used to fit each ring to the cross sectional point clouds comprising the main point cloud.
LASER PROFILER - CALIBRATION
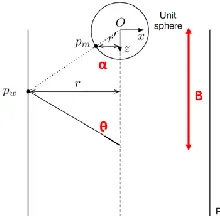
Collinearity of the optical elements of the probe is of critical importance for accurate laser measurements. To profile the interior of the pipe, the probe system is placed inside the pipe where it projects its circular pattern onto the inner pipe wall and captures images of it while it is driven through the pipe. The information contained in the images is then used to measure the shape of the pipe and to detect any surface defects. The geometry of the laser and camera configuration is shown in Fig. 4.
[image:3.612.251.361.578.686.2]This arrangement contains two geometric parameters, baseline OD and opening angle α, which are needed for triangulation – these can be obtained through calibration prior to operation. The laser is emitted orthogonally to the optical axis of the camera corresponding to an angle α = 180̊. With the knowledge of the baseline and the direction vector corresponding to each laser pixel, triangulation can be employed to estimate the 3D position of each these pixels. The camera model described by Scaramuzza et al [3] can be used to estimate the vector corresponding to a pixel. When the laser and image plane are misaligned, the radial distance observed by the camera is not its true value. Aligning both camera and laser to the same object implies laser and camera are aligned. The development of a calibration tool would enable mechanical adjustment of laser plane pitch/yaw orientation.
[image:4.612.246.374.239.381.2]To do so, a two-step procedure needs to be implemented – (a) aligning camera with the main axis of a calibration pipe and (b) centre laser ring with the centre of the end of the calibration pipe. In order to centre the mirror with the camera system such that the error in translation and rotational both can be quantified, the camera system needs to be aligned within a pipe of known dimensions and known features. To do so, the initial model of this pipe is 3D printed as shown in Fig. 5.
FIGURE 5. Actual printed pipe.
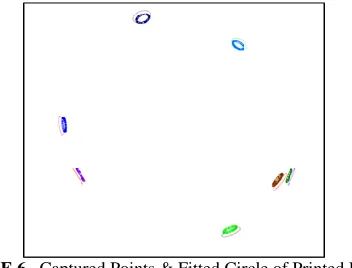
To position the camera two translation stages and one tilt and tip stage is used as the roll is not a parameter of interest in this experimentation this allows all axis of interest to be finely adjusted. The camera can then be aligned so it is co-linear within the pipe, from this the laser module can be adjusted so the center of the imaged laser line is in center with the center of the pipe. A reference structure is required to reference the cameras location to, initial tests involved using brightly coloured stickers on a standard pipe. This had the benefits of a highly accurate diameter of pipe but the location of the stickers was arbitrary and determining precise locations of them would prove difficult. The solution to this problem involved printing a 3D pipe with recessions in the wall. To measure the center of the locations of these recessions a FARO arm was used, a small 3mm diameter ball on the end of a ‘gun’ is used to measure the circumference of the recession in 3D space. With the use of Spatial Analyser, a circle was fitted to these points as seen in Fig. 6.
FIGURE 6. Captured Points & Fitted Circle of Printed Pipe.
[image:4.612.224.400.527.661.2]the PROTO toolbox. Fitting a cylinder is achieved this takes in a series of points in 3 dimensional space and returns an axis vector, cylinder centre and radius. A point is chosen as an ‘origin’ and all the other remaining points are referenced to it. The axes of the cylinder are also defined. The x axis is defined as the normalised vector between chosen origin point and cylinder centre. The y axis is determined by the cross product of the x and z axes.
To create an origin that is based in the centre of the cylinder i.e. when the cylinder is viewed from the ‘top’ perspective it will be centred on 0 the origin is based on a chosen point and not defined as a chosen point. The first step in creating this origin is to find the vector which travels from the selected point on the cylinder perimeter and passes through the origin. This is defined as follows in equation (1)
𝑣𝑒𝑐 = (𝑎 − 𝑃) − ((𝑎 − 𝑃)𝑛)𝑛 (1)
where a is the cylinder origin [x, y, z], P is the selected point [x, y, z] and n is the cylinder axis [x, y, z]. The origin can then be defined as in equation (2)
𝑜𝑟𝑖𝑔𝑖𝑛 = 𝑣𝑒𝑐 + 𝑃 (2)
To visualise the result a cylinder is created in MATLAB which is then extended to a suitable length. However, the cylinder is centred at [0, 0, 0] and therefore needs to be rotated and moved. To achieve this, it is multiplied by the rotation vector UU which is defined in equations (3) - (5).
𝐺 = [𝑛𝑜𝑟𝑚 (𝐴 𝐵)𝐴 𝐵 −𝑛𝑜𝑟𝑚 (𝐴 𝐵) 0𝐴 𝐵 0
0 0 1
] (3)
𝐹𝑖= [𝐴
(𝐵−𝐴 𝐵)𝐴
𝑛𝑜𝑟𝑚(𝐵−𝐴 𝐵)𝐴 𝐵 𝐴] (4)
𝑈𝑈 = 𝐹𝑖 𝐺 𝑖𝑛𝑣(𝐹𝑖) (5)
FIGURE 7. Fitted Cylinder in the Reference Coordinate Frame.
[image:6.612.121.478.193.310.2]An alignment tool was created to centre the mirror with the camera system. Although this has the result of reducing the error in translation. The graphical interface of the system is shown in Fig. 8. To determine rotational error, the camera is positioned using two translation stages and one tilt and tip stage is used as the roll is not a parameter of interest in this experimentation this allows all axis of interest to be finely adjusted. The camera can then be aligned so it is co-linear within the pipe, from this the laser module can be adjusted so the centre of the imaged laser line is in centre with the centre of the pipe.
FIGURE 8. Alignment System.
LASER LINE EXTRACTION
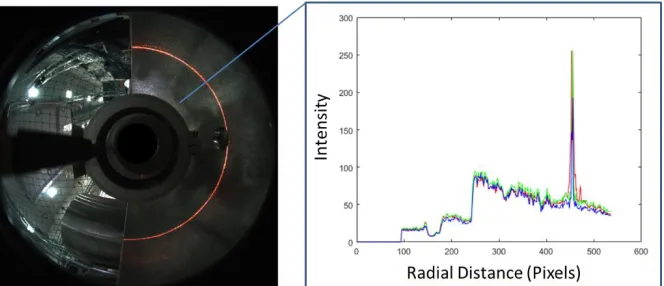
[image:6.612.149.481.493.636.2]Knowing the circular form of the pipe, several techniques exist to extract the laser stripe. The extraction of the laser stripe on images is more accurate with a radial line scan than with radial circle scan or a column scan for unwrapped images. The method involves picking a point in the image and denote it as origin. The radius of the largest circle (circle A) that can be inscribed in the image is calculated. Using the Bresenham’s line algorithm, a line from the origin to a point lying on the circumference of circle A is drawn. The coordinates of the pixel point that satisfy the decision criterion are extracted. This procedure is repeated for each point lying on the circumference of circle A — such that it is scanned to 360°. Thus, the radial line search enables extraction of a general curve. The peak detection algorithm used to select pixel representing laser line from possible set of red pixels, the results of which are seen in Fig. 9.
COMPARISON OF THE PROBE PERFORMANCE WITH GOM SCANNER
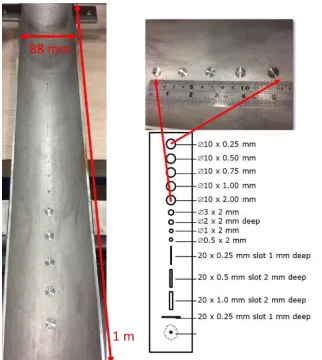
[image:7.612.232.393.169.349.2]The probe is compared with the GOM Atos scanner for evaluating its accuracy and also to validate models constructed with this sensor. The model of the pipe processed with the median pixel approach is compared to reference models reconstructed with the GOM Atos scanner. A split machined pipe is created to enable comparison of MAPS scan of defects with ground truth. On it circular and slot defects of varying dimensions are machined as seen in Fig. 10.
FIGURE 10. Split pipe sample with the various circular and slot defects.
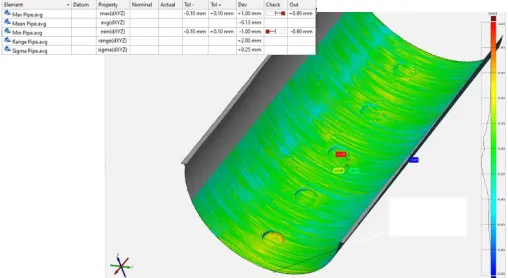
To compare models, GOM Inspect is used. This powerful and free software allows to align models and then to calculate distance between them. Distance between models can be seen directly on a single model where colours represent length between them. The model with the probe are meshed with Matlab while models constructed with scanners are meshed with Meshlab. For each comparison, the software GOM Inspect provides four mains statistics between models - Mean distance, maximum distance, minimum distance, sigma. This last criteria Sigma is the most important. It corresponds as the standard deviation between models and thus allow to characterize models.
RESULTS
The scan done by the laser profiler on the split pipe is done by the probe being driven on a linear path by a KUKA robot in 0.5 mm steps. The initial raw results indicated that 5 machined round holes are visible as seen in Fig. 11 but it should be noted that there are certain limitations in the scan due to the probe/robot mechanics.
[image:7.612.209.416.541.672.2]The comparison between the GOM model and the probe model constructed with the Median Pixel Approach is presented Figure 12. It is noted that the mean alignment error is 0.13 mm with the greater errors being in the defect indentations. However, the results are encouraging in nature and can be used ultimately provide greater accuracy and precision than the image based reconstruction.
FIGURE 12. Comparison of the GOM and probe model.
ACKNOWLEDGMENTS
This work was funded by Innovate UK in the “Mosaicing for Automated Pipe Scanning” project (Innovate UK -102067). The authors would like to thank the project partners: National Nuclear Laboratory, Wideblue, Inspectahire and Sellafield Ltd.
REFERENCES
1. R. Summan, G. Dobie, F. Guarato, C. MacLeod, S. Marshall, C. Forrester, G. Pierce, and G. Bolton. "Image mosaicing for automated pipe scanning", to QNDE Conference Proceedings, vol. 1650, no. 1, pp. 1334-1342, 2015.
2. D. G. Lowe, “Distinctive Image Features from Scale-Invariant Keypoints” International journal of computer
vision, 2004.
3. D. Scaramuzza, A. Martinelli and R. Siegwart, "A Toolbox for Easy Calibrating Omnidirectional Cameras", Proceedings to IEEE International Conference on Intelligent Robots and Systems (IROS), 2006.
4. R. Summan, G. Dobie, G. West, S. Marshall, C. Macleod, and G. Pierce, "The influence of the spatial distribution of 2D features on pose estimation for a visual pipe mapping sensor," IEEE Sensors Journal (2017).
5. I. Esteban, L. Dorst, and J. Dijk, “Closed Form Solution for the Scale Ambiguity Problem in Monocular Visual Odometry”, Intelligent Robotics and Applications Springer,2010.
6. R. Hartley and A. Zisserman, “Multiple View Geometry in Computer Vision”, Cambridge University Press
2003.