ISSN Online: 1947-3818 ISSN Print: 1949-243X
A Case Study to Determine Optimal Capacity of
a Stand-Alone Wind/PV/Battery System
Zhonglei Shao, Kwok Lun Lo
University of Strathclyde, Glasgow, UK
Abstract
In this paper, a stand-alone hybrid microgrid consisting of wind turbines, photovoltaic (PV) arrays and storage battery banks is developed for use in Qinghai Province, China. With the help of Software Homer and Matlab, dif-ferent variables such as annual average wind speed, annual average load de-mand, and annual capacity shortage are considered. The net present value is then used during an entire project lifetime for the optimization solution.
Keywords
Stand-Alone Hybrid Systems, Optimal Sizing, Tech-Economical
1. Introduction
It is necessary to develop some renewable energy resources in some remote rural areas where the grid extension is unavailable technologically or economically. Some renewable energy resources are used to support local facilities. For in-stance, the International Resources Group conducted a survey in Sri Lanka where people use a 50-W PV/battery system to support several compact fluores-cent lights [1]. Because wind generation is intermittent and the continuity of so-lar energy depends on the extent of cloud cover, the combination of them to-gether in a system can make an efficient complementation at some points.
This paper models a stand-alone hybrid system in Qinghai Province, China, where several households are regarded as an object group. Three variables i.e. average annual wind speed, average daily load demand and annual capacity shortage are set with different values for more valid comparison.
2. Stand-Alone Microgrid Power System
2.1. Wind Resources
In this case, the hourly wind speeds in a period are recorded. After wind re-How to cite this paper: Shao, Z.L. and Lo,
K.L. (2017) A Case Study to Determine Optimal Capacity of a Stand-Alone Wind/ PV/Battery System. Energy and Power En-gineering, 9, 300-307.
https://doi.org/10.4236/epe.2017.94B035
source data is produced, the wind speed at hub height can be matched. Either the logarithmic law or the power law can be used to achieve this. The power law formula is used here [2] [3],
.( )
i i
H v v
H α
= (1)
v-wind speed at hub height, H (m/s)
vi-wind speed at a reference height, Hi (m/s)
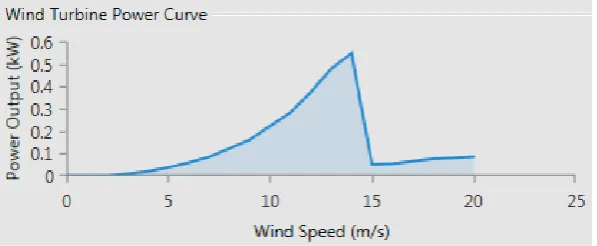
α-power-law exponent (usually it is set to be 1/7 for normal condition) There are 8760 hours in one year and as the simulation is done hourly which means it is the number of simulation steps. Each wind speed matches an output of power according to the wind turbine’s power curve under standard conditions of temperature and pressure. Different wind turbines have different power curves provided by manufacturers. In this case, the SW AIR-X wind turbine is used and its power curve is shown in Figure 1, and the cut-in wind speed is around 2.5 m/s where the wind turbine begins to output power. And the cut-off wind speed is nearly 20 m/s where there is no output power from the wind tur-bine [4].
Other factors that can affect the overall efficiency of wind turbine output such as environmental losses, wake effects losses, curtailment losses are not consi-dered. In this paper, these are not included in the design process.
2.2. Solar Resources
For solar sources, the solar radiation incident on the PV array and the ambient temperature at different hours are also recorded. Combining them together and assuming the use of maximum power point tracking (MPPT) which is a tech-nique used with wind turbines and PV solar systems to maximize power extrac-tion under all condiextrac-tions, the output of a particular PV array can be calculated as in [5],
[1 ( )]
pv pv pv r T STC
STC
G
P f P T T
G
α
−
= + − (2)
[image:2.595.226.525.595.718.2]where Ppv-r is the rated capacity of the PV array under its standard test condi-tions, fpv is derating factor. Gstc and Tstc are the incident radiation on the PV ar-ray and the PV cell temperature under normal test conditions, respectively. G
and T are the incident radiation and temperature of the PV cell at current steps respectively. α is the temperature coefficient of power.
Derating is a major factor that is applied to the PV array power output to ac-count for reduced output in real-world operating conditions compared to the conditions under which the PV panel was rated. It is set at 80% in this paper. In actual operating conditions, factors such as soiling of the panels, wiring losses, shading, snowing cover, aging etc. all can have adverse effects on the perfor-mance of PV arrays [5].
Another significant factor that cannot be ignored is the temperature coeffi-cient. The power output of the PV array can be affected by the cell temperature
i.e. the surface temperature of the PV array. Usually, the higher the cell temper-ature, the lower would be the output of the PV array. The value of the tempera-ture coefficient can be found in the product brochures which are provided by manufacturers.
2.3. Battery Models
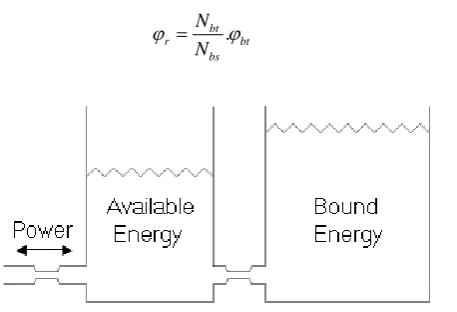
The Kinetic battery model is a traditional representation of the operating condi-tion of the battery [6]. It is based on the concept of electrochemical kinetics which forms a two-tank storage system as shown in Figure 2.
In Figure 2, the available energy is the energy which is ready for conversion to DC electricity. The bound energy is the energy that is chemically bound and as a result this is not available for an immediate conversion to practical use.
The total amount of energy stored in the battery is defined as the sum of the available energy and bound energy,
1 2
Q=Q +Q (3)
Q1 and Q2 are the available power and the bound energy respectively.
Overall, two conditions are considered. When the power from the wind tur-bines and the PV module generators exceed the demand, the surplus will be stored in the batteries. When the power from the wind turbines and the PV module generator is not enough to support load, then energy will be extracted from the battery banks.
The nominal battery capacity can be modeled as below [7],
.
bt
r bt
bs
N N
[image:3.595.264.493.560.716.2]ϕ = ϕ (4)
where Nbt is the total number of batteries, Nbs is the number of cells in series,
bt
ϕ is the nominal unit capacity (Ah) of a battery.
Another important factor that characterizes the battery behavior is the state of charge (SOC) of a battery. The state of charge at a time “t” can be obtained using the following equation [8]:
. ( ) . ( ) ( )
( ) ( 1) wind wind PV L
b b
N P t N Ps t P t
SOC t SOC t
V C
+ −
= − + (5)
PL(t) is the electric power demand at time “t”, Vb is the battery voltage, Cb is the capacity of the battery bank, Nwind is the number of the wind turbine, and
NPV is the number of PV module.
If Nwind.Pwind( )t +NPV.Ps t( )>P tL( ), the power generated by wind turbines
and PV arrays exceeds the load which leads the battery to charge.
If Nwind.Pwind( )t +NPV.Ps t( )<P tL( ), the power produced by wind turbines
and PV arrays is not able to supply the load which leads the battery to discharge. A minimum state of charge of the battery bank (SOCmin) is also set in this pa-per to help expand the entire lifetime of the battery.
min (1 ). r
SOC = −DOD SOC (6)
where DOD (%) is the maximum depth of discharge of the battery bank, a level of 60% is used in this paper; SOCr is the rated state of charge of the battery bank, a level of 100% is used in this paper. As a result, the minimum state of charge of the battery bank would be 40% in this paper.
2.4. Economic Issues
The net present cost is an important parameter used for comparison in different optimal type combinations of the micro-grid system [9]. The net present cost (or life-cycle cost) of a component is the present value of all the costs of installing and operating that component over the project lifetime, minus the present value of all the revenues that it earns over the project lifetime. In this article, the net present cost includes the initial capital cost, the operation, and maintenance cost and the components replacement cost. As a result, the total net present value over the project period is the sum of different parts [10].
system capital operation replacement revenues
H =H +H +H −H (7)
3. Case Study
3.1. Information about the Selected Area
The area is at the 34.5N latitude and 95.5E longitude locating in Qinghai Prov-ince, China where the sea level is above 4000 meters. Residents live sparsely, and most of them make a livelihood by farming and grazing. It is not uncommon that only several households can be seen around a ten kilometers radius. Differ-ent types of territories such as forests, deserts and wet meadows increase the dif-ficulties for grid extension.
average load demand varies from 0.5 kWh/d to 2 kWh/d.
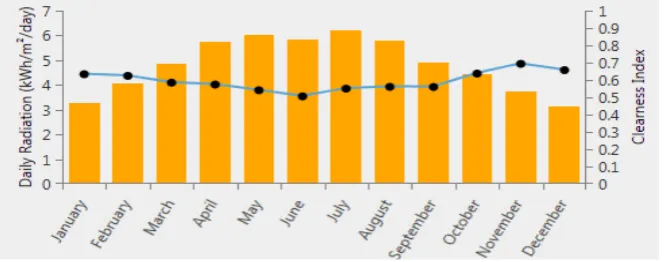
Data are obtained from the NASA Surface Meteorology and Solar Energy website. With the annual average solar radiation of 5.18 kWh/m2/d, a figure pro-viding monthly average solar monthly average solar radiation values and the curve represent clearness index over 22 years period is shown in Figure 3. The clearness index is defined as the ratio of the horizontal global irradiance to the corresponding irradiance available out of the atmosphere.
Figure 4 shows the monthly average wind speed values over a ten year period with anemometer height of 50 m. Annual average wind speed in this area is 6.87 m/s.
3.2. Results and Analysis
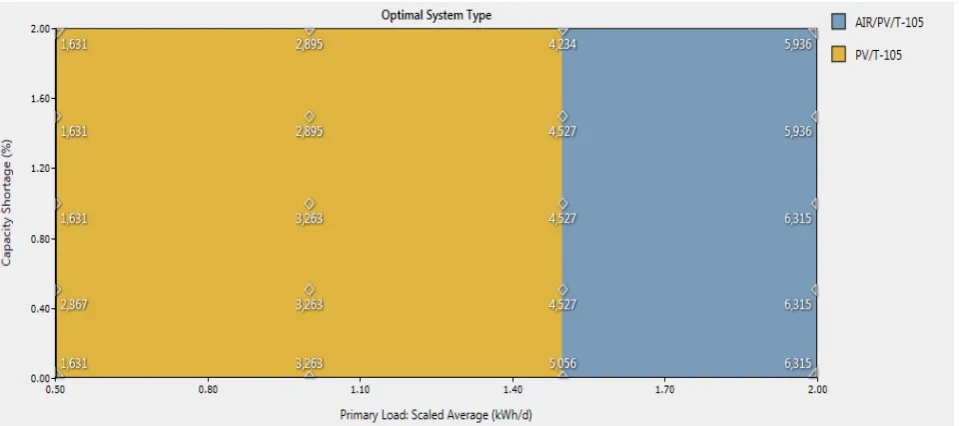
[image:5.595.209.544.402.533.2]Three variables are studied in this case i.e. the annual capacity shortage (%), the annual average load demand (kWh/d) and the annual average wind speed (m/s). A capacity shortage is a shortfall that occurs between the required operating ca-pacity and the actual amount of operating caca-pacity the system can provide. In other words, the customers are willing to accept some unmet load in order to al-low a smaller, less expensive power system. The total number of wind turbines is varied from 0 to 3. The total size of PV arrays varies from 0 kW to 0.4 kW. The total number of batteries is set from 0 to 8. All the total net present costs of dif-ferent optimal system type combinations that satisfy the reliability required by
[image:5.595.212.540.564.713.2]Figure 3. The average solar resources over 22 years.
the hybrid system are calculated. An optimal system model with the least total net present cost would be the best solution in this case.
As is seen in Figure 5, the annual average wind speed set to be 5 m/s, the val-ue below a particular hollow dot represents the least total net present cost of all optimal system type combinations at that point. For instance, at a point where the allowed annual capacity shortage is 0%, and annual average load is 0.5 kWh/d, the best solution is optimal system type combination of PV modules and batteries (PV/T-105) leading to a least total net present cost of 1631$. When the annual average wind speed and annual capacity shortage remain unchanged, the increasing of demand side would lead to a change of the best optimal system type. As a result, the study of the amount of load demand is quite important. For example, the optimal system type is the combination of wind turbines, PV mod-ules, and batteries (AIR/PV/T-105) after the annual average load is increased to 1.5 kWh/d. what is more, it is clear in Figure 5 that when the annual average load demand and the wind speed remain unchanged, the more annual capacity shortage is allowed, the less expensive the whole system would be.
When the annual average wind speed increases to 6 m/s, the area of distribution of the best optimal system type changes, shown in Figure 6. The total net present cost of the best solution of the optimal system model decreases dramati-cally especially for the optimal system type of wind turbines, PV modules and batteries (AIR/PV/T-105). And some distribution areas of the optimal system type of PV modules and batteries (PV/T-105) are replaced by the optimal system type of wind turbines, PV modules, and batteries (AIR/PV/T-105).
[image:6.595.61.541.504.717.2]When the annual average wind speed increases to 7 m/s, the total net present cost of the best solution of the optimal system type of wind turbines, PV mod-ules and batteries (AIR/PV/T-105) drops again compared with the value of the same point in Figure 7. More areas in the graph are covered by the optimal sys-tem type of wind turbines, PV modules and batteries (AIR/PV/T-105). What is
Figure 6. Optimal system type when wind speed at 6 m/s.
Figure 7. Optimal system type when wind speed at 7 m/s.
more, it is the first time that optimal system type of wind turbines and batteries (AIR/T-105) appears in the graph. When the annual capacity shortage is be-tween 1.00% and 1.20%, the annual average load demand is bebe-tween 0.8 kWh/d and 0.9 kWh/d, the best solution of the optimal system type is the combination of wind turbines and batteries (AIR/T-105). And it is predictable that when the annual average wind speed increases to more than 7 m/s, more areas in the graph would be covered by the optimal system type of wind turbines, PV mod-ules and batteries (AIR/PV/T-105).
4. Conclusions
[image:7.595.59.538.304.504.2]Yu-shu, China is presented. Three variables are accounted i.e. the annual average wind speed (m/s), the annual average load demand (kWh/d) and the annual ca-pacity shortage (%). A least total net present cost of all the optimal system type that meets the reliability of the microgrid would be the best solution. All the best solutions representing different optimal system types are shown in various graphs.
It is discovered that when both of the annual average wind speed and annual average load demand are lower than a particular point, the optimal system type would be the combination of PV modules and batteries. When either the annual average wind speed or the annual average load demand increases to a particular point, the optimal system type would be the combination of wind turbines, PV modules and batteries. When the annual average wind speed increases more and more, the optimal system type would be the combination of wind turbines and batteries.
References
[1] (2003) World Bank/Sri Lanka Energy Services Delivery Project, Impacts Assessment and Lessons Learned. International Resources Group, Washington, DC.
[2] Borowy, B. S. andSalameh, Z. M. (1994) Optimum photovoltaic Array Size for A Hybrid Wind/PV system. In IEEE Trans. On energy Conversion,9, 482–488. https://doi.org/10.1109/60.326466
[3] Borowy, B. S.; Salameh, Z. M. (1996) Methodology for optimally sizing the combi-nation of a Battery Bank and PV Array in a Wind/PV Hybrid System. IEEE Trans. on Energy Conversion,11, 367–375.https://doi.org/10.1109/60.507648
[4] (2016)Southwest WindPower.http://www.windenergy.com/
[5] Xu, L.; Ruan, X.B., Mao, C.X., Zhang, B.H. and Luo, L. (2013) An Improved Optimal Sizing Method for Wind-Solar-Battery Hybrid Power System. IEEE Trans. Sustain. Energy, 4, 774–785.https://doi.org/10.1109/TSTE.2012.2228509
[6] Manwell, J.F. and McGowan, J.G. (1993) Lead Acid Storage Model for Hybrid Energy Systems.Solar Energy, 50, 399-405.
https://doi.org/10.1016/0038-092X(93)90060-2
[7] Belfkira, R., Reghem, P., Raharigaona, J., Barakat, G. and Nichita, C. (2009) Non-Linear Optimization Based Design Methodology of Wind/PV Hybrid Stand Alone System. EVERE, Ecologic Vehicule.Renewable Energies, MONACO, 26-29. [8] Jing, L., Wei, W. and Ji, X. (2012) ASimple Sizing Algorithm for Stand-Alone
PV/Wind/Battery Hybrid Microgrids. Energies,5307-5323.
[9] Shao,Z.L. and Lo,K.L.(2016)An Overview of Research on Optimization of Integrated Solar/Wind Power Generation Systems, World Journal of Engineering and Tech-nology,35-42.
[10]Eftichios, K., Dionissia, K.,Antonis, P. and Kostas, K. (2006) Methodology for Op-timal Sizing of Stand-Alone Photovoltaic/Wind-Generator Systems Using Genetic Algorithms. Solar Energy, 80, 1072–1088.
https://doi.org/10.1016/j.solener.2005.11.002
Submit or recommend next manuscript to SCIRP and we will provide best service for you:
Accepting pre-submission inquiries through Email, Facebook, LinkedIn, Twitter, etc. A wide selection of journals (inclusive of 9 subjects, more than 200 journals)
Providing 24-hour high-quality service User-friendly online submission system Fair and swift peer-review system
Efficient typesetting and proofreading procedure
Display of the result of downloads and visits, as well as the number of cited articles Maximum dissemination of your research work
Submit your manuscript at: http://papersubmission.scirp.org/