City, University of London Institutional Repository
Citation
:
Nadimi, S., Fonseca, J. & Taylor, N. (2015). A microstructure-based finite
element analysis of the response of sand. Paper presented at the Sixth International
Symposium on Deformation Characteristics of Geomaterials, 15-11-2015 - 18-11-2015,
Buenos Aires.
This is the accepted version of the paper.
This version of the publication may differ from the final published
version.
Permanent repository link:
http://openaccess.city.ac.uk/13010/
Link to published version
:
Copyright and reuse:
City Research Online aims to make research
outputs of City, University of London available to a wider audience.
Copyright and Moral Rights remain with the author(s) and/or copyright
holders. URLs from City Research Online may be freely distributed and
linked to.
A microstructure-based finite element
analysis of the response of sand
Sadegh NADIMIa,1, Joana FONSECAa and Neil TAYLORa aCity University London, UK
Abstract. This paper presents a novel contribution towards understanding the stress distribution amongst the constituent grains of an intact sand under loading. Photoelasticity using birefringent materials has shown that forces in granular media are transmitted from particle-to-particle via their contacts and the mode of load propagation forms a complex force network. Particles carrying above average load appear to form a network with special characteristics where stronger forces are carried through chain-like particle groups, often referred as force chains. Fonseca et al. (2013) showed that for a sand under shearing, the contact normals tend to be orientated along the direction of the major principal stress, which suggests the formation of force chains. Moreover, these quasi-vertically oriented vectors were shown to be associated with contacts having large surface areas, contributing to the formation of solid columnar structures of stress transmitting grains. This early study demonstrates that a full characterization of force chains for real soils requires accounting for the effects of the soil microstructure, including grain morphology and contact topology, which the idealized nature of the particles used for discrete element method simulations and photoelasticity studies cannot capture. In the present work, high resolution x-ray tomographic data of an intact sand is converted
into a two dimensionalfinite element mesh, so that the microstructural details, such
as the geometrical arrangement of the grains and pores, as well as grain shape and contact topology are incorporated in the model. In other words, the soil microstructure is modelled using a computation approach that considers all available geometrical data. The results suggested that the ability of the grains to transmit stress via their contacts is directly associated to the degrees of freedom they have to move and rearrange, which in turn is controlled by the topology of the contacts. The insights into the effects of microstructure on the stress transmission mechanisms provided in this study are fundamental to better understand and predict the macro scale response of soil.
Keywords. Fabric/microstructure of soil, image, sand, µFE, finite element modelling
1. Introduction
The bulk behavior of granular materials subjected to external loading is determined by the mode of propagation of the forces transmitted from particle-to-particle via their contacts, the force networks [1]. The experimental measurement of these forces is non-trivial, therefore, numerical modelling that account for the interaction of the constituent particles of a sample under loading has been developed. For example, the Discrete Element Method (DEM) has been extensively used for numerical simulation at the grain
1 Corresponding Author: Research Centre for Multi-Scale Geotechnical Engineering, City University
scale and has contributed to improve our understanding of the mechanical behavior of granular materials. However, the idealized nature of the DEM simulations, i.e. spherical shapes that are commonly used, remains an important drawback of the methodology. While the influence of particle shape in the stress distribution amongst discrete grains has been demonstrated in the literature [2, 3, 4], previous experimental studies have shown that the influence of particle shape can be more significant than inter-particle friction and surface roughness on the macro scale response of soil [5]. Grain morphology, including size and shape, and contact topology properties are a consequence of the geological history and the depositional settings of the soil. Consequently, intact soils possess unique fabric features, in particular in terms of contact topology and grain orientation, which are often lost in reconstituted soils and in addition cannot be reproduced in the laboratory.
This paper presents a two dimensional microstructure-based finite element (µFE) model, which takes into account the natural depositional grain scale characteristics of an intact sand. The model employs an image-based meshing method using x-ray tomographic containing all the geometric information regarding the fabric of the sand. FE methods have been widely used for solving problems in continuum mechanics [6]. In order to account for the discrete nature of particle-to-particle interaction on the simulations, FE methods that address contact mechanics applications and its effectiveness have recently been established [7]. In particular, a number of contact laws have been developed for DEM analysis based on these FE methods [8, 9].
2. Methodology
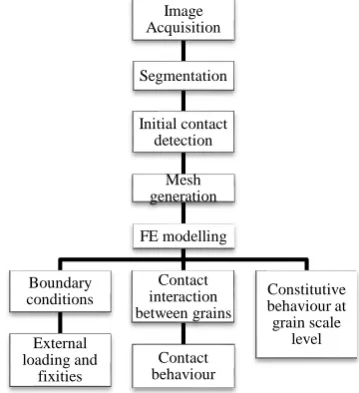
The methodology proposed in this study is summarized in the flow chart illustrated in Figure 1. This includes image acquisition, image segmentation and contact detection, which serve as input data for the image-based meshing and the µFE modelling. This Section discusses each stage of the methodology and provides a brief description of the properties of the intact sand used in this study.
2.1.Image acquisition and segmentation
The material used in this study is Reigate sand, part of the Lower Greensand formation (England). Reigate sand is a quartz-rich sand, with a median grain diameter (d50) of
300μm and characterized by very high densities and an interlocked fabric which enables the use of block sampling to collect intact samples from an outcrop of this material [10]. A minimal cement content was observed in the samples retrieved. The shape of the grains in this geologically old, once deep buried sand, varies from near-spherical to highly non-spherical with embayment [11]. The most striking feature of this sand is the predominance of flat, extended contacts, contrasting to the point contacts found in more recent sand formations or in reconstituted samples of the same sand.
the overall grain shape can be well captured. While the µCT scans carried out generated three dimensional images (3D), only slides along the full volume, i.e. two dimensional (2D) images were investigated in this study.
[image:4.595.216.396.278.475.2]In order to identify the individual grains, image segmentation techniques were used [10]. This consisted of binarizing the image using a pre-set threshold value of intensity to separate the pore space from the solid phase, followed by a watershed technique to isolate the grains touching; details can be found in [11]. Figure 2b shows the segmented image where each individual grain is represented by a unique color, the particle’s id that takes values from 1 to N (N being the total number of grains) and the pore space that takes the value 0 and is represented in black.
Figure 1. Flow chart showing the steps of the proposed µFE model.
(a) (b)
Figure 2. (a) µCT raw image and (b) segmented image. Image
Acquisition
Segmentation
Initial contact detection
Mesh generation
FE modelling
Boundary conditions
External loading and
fixities
Contact interaction between grains
Contact behaviour
Constitutive behaviour at grain scale
2.2.Contact detection
In order to complete the initial microstructure configuration, the contact region between two contacting grains was detected and directly introduced in the model. Considering two contacting grains, each grain has been defined as a set of pixels with a unique intensity value in the segmented image, the particle’s id. Pixels are classified as ‘contact pixels’ if they are connected to a pixel with a different and non-zero id. The pixel contact classification used in this study was based on a 4-connectivity pixel neighborhood relation, i.e. face-to-face pixel connection. This operation required a total of four orthogonal ‘passes’ through the data along the x and y directions (x being the horizontal and y the vertical directions). The size of the contacts was calculated by multiplying the number of pixels defining each contact by the area of each pixel (i.e. the image resolution). The contact surfaces were introduced in the µFE model as the initial contacts and the contact properties were assigned to them, as discussed later.
2.3.Image-based meshing
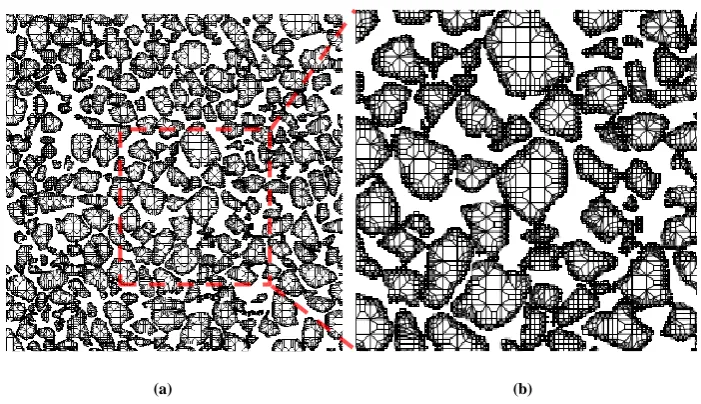
The segmented image representing the internal microstructure, in terms of grain arrangements and real grain morphology, is the starting point for the image-based mesh. In this work, an open source software package OOF2 (Object Oriented Finite Elements v2, NIST) has been employed to create the mesh directly from the image [12]. An easy and straight-forward approach to generate the mesh is by using a direct pixel-to-element conversion. However, the computational costs of running the model, in this case, will be very high due to large number of elements. A more efficient approach is proposed here, which assumes that the grains are homogenous and therefore each grain can be represented by larger elements containing a few pixels. These elements can be represented by various polygonal shapes, for which the respective size and shape depend on the size and shape of the grains.
The meshing process begins with specifying the minimum and maximum size of the features presented in the image, i.e. the grains. The image is subsequently gridded according to the specified sizes. It was found that that this automated gridding can often introduce errors in the generated mesh, in particular, by creating elements that contain part of two different grains or part of a grain and void space, named the ‘inhomogeneous elements’. Amendment of these inhomogeneous elements can carried out either by subdividing the elements, which increase the number of elements, or running a routine that changes the topology of element without increasing the number of elements, which is preferable. In these routines, nodes can be added, removed or reconnected to increase the homogeneity of mesh. The effectiveness of enhancing the quality of the mesh by modifying its topological structures has been recognized in previous studies [6]. Moreover, in order to model the contact interaction between grains more accurately, the elements along the boundary of each grain were locally refined.
The assessment of the quality and efficiency of the mesh was taken into account by quantifying i) the ability of the mesh to represent the features in the images, using the
homogeneity index, and ii) the mesh convergence behavior, using the shape index [12]. When all the pixels in the image are associated to a mesh element, the homogeneity index
The 600 × 600 pixel segmented image shown in Figure 2b was used to generate the mesh for the example here presented. Mesh enhancement and refinement, resulted in a
homogeneity index of 0.97 and a shape index of 0. In total, it comprised 61884 nodes and 48963 elements. As can be seen in Figure 3a and in more detail in Figure 3b, the number of elements containing more than one pixel, and in some cases a large number of pixels, is significant, and this is critical to reduce the processing time and consequently improve the computational efficiency.
[image:6.595.126.477.243.445.2](a) (b)
Figure 3. (a) Image-based mesh showing the refined elements along the boundary of each grain (b) Detailed image of the mesh.
3. The µFE model
This µFE model consists of a 2D array of approximately 250 grains subjected to strain controlled isotropic compression. In the case of a 2D simulation, it can happen that a few grains do not exhibit any contact in the plane of the image and appear to be not in contact to any surrounding grain. This is a limitation of 2D analysis and in order to minimize its impact in the simulation the model was set to be capable of simulating large displacement without inducing strain.
3.1.Contact interaction
Each contact between two given grains was modelled as ‘surface-to-surface’ with properties of hard contact in the normal direction and Coulomb friction in the tangential direction. The effectiveness of these conditions when compared to Classic Hertzian and MD theories’ described in the literature for idealized circular shape [8, 9, 14].
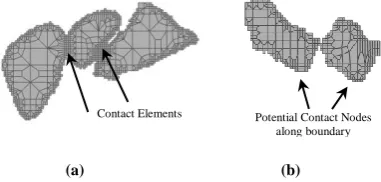
An element-based contact approach was considered, where the contacts were detected in the initial assembly, prior to loading (Figure 4a). In addition, a node-based contact has been defined along the free part of the boundary of each grain, i.e. defined by the pixels in the grain that are in contact with pixels of value 0, i.e. pixels defining the edge of the grain in contact to the pore space. This node-based contact represents the potential surface of contact after grain rearrangement, imparted by the external loading conditions (Figure 4b). For grains with irregular shape, as it is the case of real sand, it is more appropriate to allow the whole free surface to potentially become a contact, which was done by modelling all grains as ‘general contact’.
A refined mesh of approximately one element per pixel was used for the contacts, which avoids potential noise in the measurement of the contact forces and, thus, enabling a more accurate modeling of the forces at the contact interface. The surface-to-surface technique was used to discretize the contact interfaces, which each contact constraint was formulated based on an integral over the region surrounding the contact node, and improves the accuracy of measuring the contact stresses. The coefficient of inter-particle friction for the silica grains was considered to be 0.23 taken from experiments at the grain scale [15]. To solve the model, a scripting user interface or ‘Abaqus command’ was used as the element based contact is not supported in the graphical user interface ‘Abaqus/CAE’.
[image:7.595.206.397.483.574.2](a) (b)
Figure 4. Schematic definition of contacts: (a) element-based contact and (b) node-based contact.
3.2.Constitutive parameters
Linear and isotropic material behavior was assumed for the grains in this study. It is important to note that plasticity or viscosity can also be introduced to model, and their influence on the behavior at a grain scale level, investigated. Averaged values of 100 GPa for Young’s modulus and 0.15 for Poisson’s ratio, corresponding to bulk modulus of K=47.6GPa and shear modulus of G=43.5GPa [16], were used. Here, we are assuming that the bulk behavior is controlled by grain rearrangement and not by plastic behavior at the grain scale.
4. Result and discussion
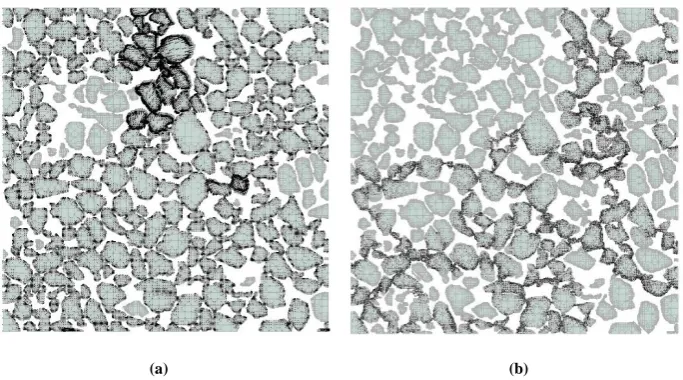
The results were investigated in terms of grain displacement and stress distribution. Figure 5a shows the arrows representing the displacement of the grains, in this case, the node displacement. In the same way, the stress at the nodes is illustrated in Figure 5b. It can be observed that the grains showing larger displacement, i.e. significant rearrangements, are associated with very small or zero stresses, while the grains carrying the majority of the stress through contacts have more stable positions. This suggests that the contact topology, in particular, the large area contacts, is responsible for controlling the ability, or in this case the inability, of the grain to rearrange and therefore to be able to transmit stresses, i.e. to be part of the force chain. Another key point to highlight from these results is the anisotropy of the contact network of stress transmitting grains, when responding to an externally applied load. This anisotropic and heterogeneous network is a result of the irregular shapes and sizes of the grains and the complexity of the associated geometrical arrangement or fabric.
In order to interpret the results, an awareness of limitations of a 2D analysis is required. As already discussed previously, the fact that the 2D slice of the volume image may not cut thought the contact between two given grains makes these grains more vulnerable to move and lead to misrepresentative results.
[image:8.595.128.470.383.573.2](a) (b)
Figure 5. (a) Grain displacement represented by black arrows indicating the direction and magnitude (given by the arrow’s length). (b) Stress distribution at the nodes of each grain in black.
5. Conclusion
transmission under the applied loading and boundary conditions. The ability of the grains to transmit stress via their contacts seems to be directly associated to the degrees of freedom they have to move and rearrange. It is suggested that grains forming large contact areas are more stable and therefore more likely to transmit stress and be part of a force chain. This observation highlights the need to account for fabric of real soil and in particular the intact fabric features imparted during geological history. The inherent limitations of a 2D analysis are discussed. On-going work includes the 3D extension of this µFE model.
Acknowledgments
Authors acknowledge the National Institute of Standards and Technology (NIST), an agency of the U.S. government, as the source of the code OOF2 used in this research and the first author would like to express his thanks to City University London for his doctoral scholarship.
References
[1]T.S. Majmudar, R.P. Behringer, Contact force measurements and stress-induced anisotropy in granular
materials. Nature 435 (2005), 1079-1082.
[2]H.G. Matuttis, Simulation of the pressure distribution under a two dimensional heap of polygonal particles,
Granular Matter 1 (1998), 83-91.
[3]I. Zuriguel, T. Mullin, The role of particle shape on the stress distribution in a sand pile, Proc. R. Soc. A
464 (2008), 99-116.
[4]I. Zuriguel, T. Mullin, J.M. Rotter, The effect of particle shape on the stress dip under a sandpile, Phys.
Rev. Lett. 98, 028001 (2007).
[5]I. Cavarretta, M. Coop, C. O’Sullivan, The influence of particle characteristics on the behaviour of coarse
grained soils, Géotechnique 60 (2010), 413–423.
[6]O.C. Zienkiewicz, R.L. Taylor, The Finite Element Method. 6th Edition, Elsevier, Oxford, 2005.
[7]P. Wriggers, Computational Contact Mechanics, Springer, 2006.
[8]Q.J. Zheng, H.P. Zhu, A.B. Yu, Finite element analysis of the contact forces between a viscoelastic sphere
and rigid plane, Powder Technology 226 (2012), 130–142.
[9]L. Vu-Quoc, X. Zhang, L. Lesburg, Normal and tangential force–displacement relations for frictional
elasto-plastic contact of spheres, International Journal of Solids and Structures 38 (2001), 6455–6489.
[10] C.C. Reyes-Aldasoro, Biomedical Image Analysis Recipes in MATLAB: For Life Scientists and Engineers,
Wiley-Blackwell, London, 2015.
[11] J. Fonseca, The evolution of morphology and fabric of a sand during shearing, PhD Thesis, Imperial College London, (2011).
[12] A.C.E. Reid, S.A. Langer, R.C. Lua, V.R. Coffman, S. Haan, R.E. García, Image-based finite element
mesh construction for material microstructures, Computational Materials Science 43 (2008), 989-999.
[13] J.R. Shewchuk, What is a Good Linear Element? Interpolation, Conditioning, and Quality Measures,
Invited Talk, 11th International Meshing Roundtable, Springer-Verlag, (2002), 115-126.
[14] E. Dintwa, E. Tijskens, H. Ramon, On the accuracy of the Hertz model to describe the normal contact of
soft elastic spheres, Granular Matter 10 (2008), 209–221.
[15] K. Senetakis, M.R. Coop, M.C. Todisco, The inter-particle coefficient of friction at the contacts of
Leighton Buzzard sand quartz minerals, Soils and Foundations 53 (2013),746-755.
[16] R. Holtzman, D.B. Silin, T.W. Patzek, Mechanical properties of granular materials: A variational
approach to grain-scale simulations Int. J. Numer. Anal. Meth. Geomech; 33 (2009),391–404.
[17] J. Fonseca, C.C. Reyes-Aldasoro, C. O'Sullivan, M.R. Coop, Experimental investigation into the primary
fabric of stress transmitting particles, Geomechanics from Micro to Macro, Eds. Soga et al., Taylor & Francis Group, London.
[18] K.J. Hanley, X. Huang, C. O’Sullivan, F.C. Kwok, Temporal variation of contact networks in granular