Factors that influence the decision to adopt
software upgrades in Australian small and
medium sized businesses
A dissertation submitted by
David Roberts, B App Sc., Dip Ed, Grad Dip IT,
MSc
For the award of
Doctor of Philosophy
_________________________________________________________________________________ i
Abstract
_________________________________________________________________________________ iii
Certification of the Dissertation
I certify that the ideas, interviews, survey work, results, analyses and conclusions reported in this dissertation are entirely my own effort, except where otherwise acknowledged. I also certify that the work is original and has not been previously submitted for any other award.
________________________ _______________
Signature of candidate Date
ENDORSEMENT
________________________ _______________
Signature of supervisor Date
________________________ _______________
_________________________________________________________________________________ iv
Acknowledgements
I wish to express my sincere appreciation to those who have advised and assisted throughout this investigation. Due to staff changes I have experienced a number of supervisorial changes. To my early supervisors, Professor Angèle Cavaye, Professor Andy Koronios, and Dr Meredith Lawley, I want to express my thanks for assisting and advising me at the beginning of my investigation.
A special thanks is extended to my principal supervisor Professor Mark Toleman from whom assistance, guidance and advice were always willingly given. I wish to also thank my assistant supervisor Associate Professor Aileen Cater-Steel for her encouragement, assistance, and advice. I am very thankful that both of you were able to help me finalize the thesis.
I must also acknowledge my colleagues who have helped at various stages in the research, and also thank the participants who willingly participated in the interviews and surveys.
_________________________________________________________________________________ v
Table of contents
Abstract ... i
Certification of the Dissertation ... iii
Acknowledgements ... iv
Table of contents ... v
List of Figures ... ix
List of Tables ... xi
List of Appendices ... xiii
1 Introduction ... 1
1.1 Research problem and aim ... 1
1.2 Background to the research ... 2
1.3 Significance of the research ... 4
1.4 Methodology ... 6
1.5 Data analysis ... 7
1.6 Contribution of the research ... 7
1.6.1 Contributions to academic research ... 7
1.6.2 Contributions to Small Business Practice ... 7
1.7 Limitations of the research ... 8
1.8 Outline of the dissertation ... 8
2 Literature review ... 10
2.1 Introduction ... 10
2.2 Diffusion of innovations ... 12
2.3 Adoption of information technology in small business ... 14
2.4 Organisational buying behaviour ... 15
2.5 Adoption of software upgrades ... 16
2.5.1 Hidden costs of software upgrades ... 16
2.5.2 Benefits of software upgrades ... 17
2.5.3 Pressure to upgrade software ... 17
2.5.4 Investment analysis ... 17
2.6 Research question ... 18
2.7 Factors identified from the literature ... 19
2.7.1 Innovativeness ... 19
2.7.2 Business impact ... 19
2.7.3 Organisational characteristics ... 20
2.7.4 Prior experience ... 20
2.7.5 Educational level ... 20
2.7.6 Relative advantage ... 21
2.7.7 Compatibility ... 21
2.7.8 Past behaviour ... 21
2.7.9 Information ... 21
2.7.9 External influences ... 21
_________________________________________________________________________________ vi
2.8 Preliminary model ... 23
2.9 Conclusion ... 23
3 Methodology ... 24
3.1 Introduction ... 24
3.2 Research philosophy ... 24
3.3 Sequential exploratory methodology ... 25
3.4 Qualitative study ... 26
3.5 Protocols used in the interviews ... 27
3.6 Quantitative study ... 29
3.7 Development of the survey ... 29
3.7.1 Prepare the draft questionnaire ... 31
3.7.2 Question content ... 32
3.7.3 Question wording ... 32
3.7.4 Response format ... 33
3.7.5 Structure and layout ... 34
3.7.6 Pre-test and revise questionnaire ... 35
3.7.7 Assess reliability and validity of questionnaire ... 35
3.7.8 Sampling strategy ... 35
3.7.9 Data analysis ... 36
3.8 Ethical considerations ... 37
3.9 Conclusions ... 37
4 The qualitative study... 39
4.1 Introduction ... 39
4.2 Profile of businesses used in the interviews ... 39
4.3 Topics explored ... 40
4.3.1 Why do you upgrade? ... 41
4.3.2 Business upgrade policy ... 41
4.3.3 Cost-benefit analysis ... 41
4.3.4 Advice on the upgrade decision ... 42
4.3.5 Test before purchase ... 42
4.3.6 Adopter type ... 43
4.3.7 Utilization ... 43
4.3.8 Views about ever increasing features ... 43
4.3.9 Upgrade problems encountered ... 44
4.3.10 Concluding interview comments ... 44
4.4 Conclusion ... 44
5 Pilot Study ... 45
5.1 Introduction ... 45
5.2 Factors ... 46
5.3.1 Innovativeness of the manager ... 46
5.3.2 Business impact ... 46
5.3.3 Organisational characteristics ... 47
_________________________________________________________________________________ vii
5.3.5 Educational level ... 47
5.3.6 Relative advantage ... 47
5.3.7 Compatibility ... 48
5.3.8 Past behaviour ... 48
5.3.9 Information ... 48
5.3.10 External influences ... 48
5.3.11 Complexity ... 49
5.4 Survey ... 49
5.4.1 Survey design ... 50
5.4.2 Survey response and demographics ... 50
5.4.3 Business and manager characteristics ... 50
5.4.4 Likelihood of upgrade purchase ... 51
5.4.5 Innovativeness of manager ... 51
5.4.6 Complexity of purchase decision ... 52
5.4.7 Analysis of perceptions regarding the software upgrade purchase . 52 5.4.8 Revised research model... 57
5.5 Discussion ... 57
5.6 Conclusion ... 58
6 Data analysis and discussion of the full scale study ... 59
6.1 Introduction ... 59
6.2 Sample size ... 60
6.3 Sample response and representativeness ... 61
6.4 Non-response bias ... 61
6.5 Response characteristics ... 61
6.6 Constructing composite variables for use in structural equation models ... 64
6.6.1 Splitting the dataset ... 65
6.6.2 Determining the factors ... 65
6.6.3 Modelling the factors ... 73
6.6.4 Desired fit statistics ... 74
6.6.5 Congeneric model for Gains ... 75
6.6.6 Congeneric model for Control ... 79
6.6.7 Congeneric model for Complexity ... 79
6.6.8 Congeneric model for Impact ... 80
6.6.9 Congeneric model for Efficiencies ... 80
6.6.10 Congeneric model for Informed ... 80
6.6.11 Congeneric model for Innovate ... 81
6.6.12 Summary of exploratory constructs ... 82
6.7 Hypotheses ... 83
6.8 Multiple regression analysis ... 84
6.9 Alternative models ... 85
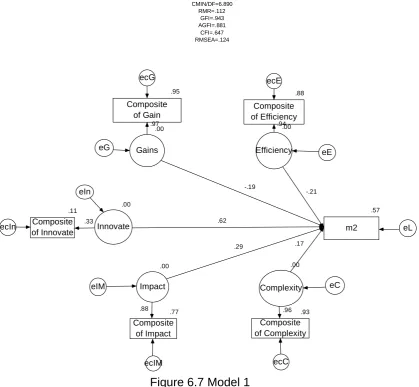
6.9.1 Alternative model 1 ... 85
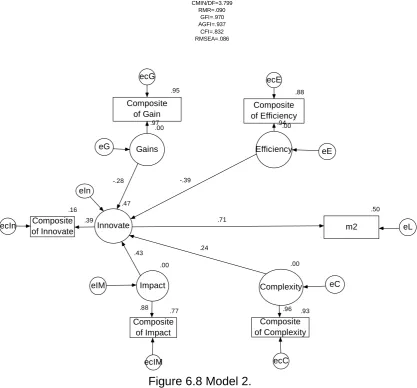
6.9.2 Alternative model 2 ... 86
6.9.3 Alternative model 3 ... 87
_________________________________________________________________________________ viii
6.10.1 Confirmatory congeneric model for Gains ... 89
6.10.2 Confirmatory congeneric model for Complexity ... 89
6.10.3 Confirmatory congeneric model for Efficiency ... 90
6.10.4 Confirmatory congeneric model for Impact ... 90
6.10.5 Confirmatory congeneric model for Control ... 91
6.10.6 Confirmatory congeneric model for Informed ... 91
6.10.7 Confirmatory congeneric model for Innovate ... 92
6.11 Reliabilities for the congeneric models ... 92
6.11.1 Reject alternative model 3 ... 93
6.11.2 Other possibilities ... 93
6.12 A new model ... ..95
6.13 Comments from survey respondents ... ..99
6.14 Conclusions ... 100
7 Conclusions and implications ... 100
7.1 Introduction ... 100
7.2 Outline of the thesis ... 100
7.3 Conclusions ... 102
7.4 Limitations ... 103
7.3 Recommendations for further research ... 105
_________________________________________________________________________________ ix
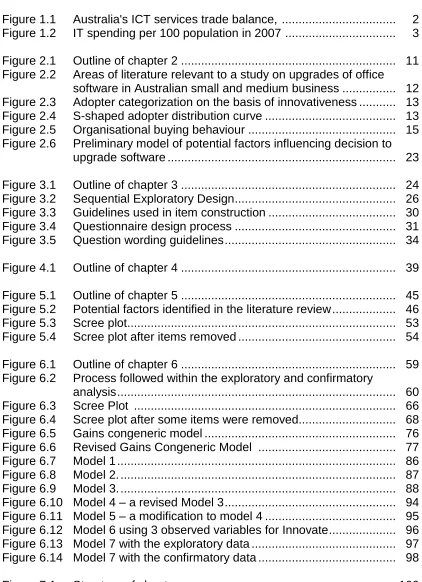
[image:10.612.88.510.107.689.2]List of figures
Figure 1.1 Australia's ICT services trade balance, ... 2
Figure 1.2 IT spending per 100 population in 2007 ... 3
Figure 2.1 Outline of chapter 2 ... 11
Figure 2.2 Areas of literature relevant to a study on upgrades of office software in Australian small and medium business ... 12
Figure 2.3 Adopter categorization on the basis of innovativeness ... 13
Figure 2.4 S-shaped adopter distribution curve ... 13
Figure 2.5 Organisational buying behaviour ... 15
Figure 2.6 Preliminary model of potential factors influencing decision to upgrade software ... 23
Figure 3.1 Outline of chapter 3 ... 24
Figure 3.2 Sequential Exploratory Design ... 26
Figure 3.3 Guidelines used in item construction ... 30
Figure 3.4 Questionnaire design process ... 31
Figure 3.5 Question wording guidelines ... 34
Figure 4.1 Outline of chapter 4 ... 39
Figure 5.1 Outline of chapter 5 ... 45
Figure 5.2 Potential factors identified in the literature review ... 46
Figure 5.3 Scree plot ... 53
Figure 5.4 Scree plot after items removed ... 54
Figure 6.1 Outline of chapter 6 ... 59
Figure 6.2 Process followed within the exploratory and confirmatory analysis ... 60
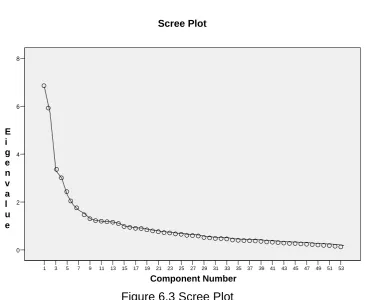
Figure 6.3 Scree Plot ... 66
Figure 6.4 Scree plot after some items were removed... 68
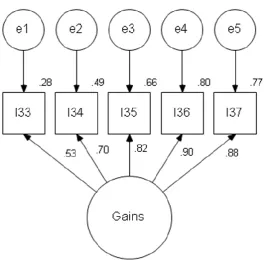
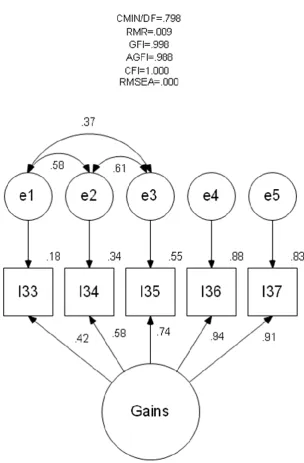
Figure 6.5 Gains congeneric model ... 76
Figure 6.6 Revised Gains Congeneric Model ... 77
Figure 6.7 Model 1 ... 86
Figure 6.8 Model 2. ... 87
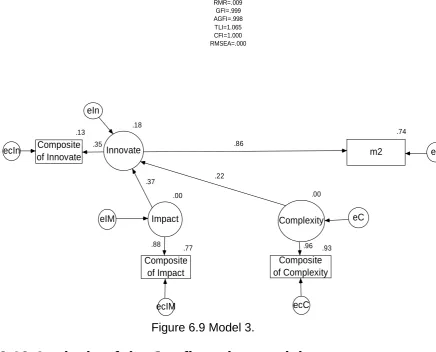
Figure 6.9 Model 3. ... 88
Figure 6.10 Model 4 – a revised Model 3 ... 94
Figure 6.11 Model 5 – a modification to model 4 ... 95
Figure 6.12 Model 6 using 3 observed variables for Innovate ... 96
Figure 6.13 Model 7 with the exploratory data ... 97
Figure 6.14 Model 7 with the confirmatory data ... 98
_________________________________________________________________________________ x
Figure D.1 Control congeneric model exploratory data ... 150
Figure D.2 Complexity congeneric model exploratory data ... 151
Figure D.3 Impact congeneric model exploratory data ... 152
Figure D.4 Efficiencies congeneric model exploratory data ... 153
Figure D.5 Informed congeneric model exploratory data ... 154
Figure D.6 Innovate congeneric model exploratory data ... 155
Figure E.1 Gains congeneric model confirmatory data... 157
Figure E.2 Control congeneric model confirmatory data ... 158
Figure E.3 Complexity congeneric model confirmatory data ... 159
Figure E.4 Impact congeneric model confirmatory data ... 160
Figure E.5 Efficiencies congeneric model confirmatory data ... 161
Figure E.6 Informed congeneric model confirmatory data ... 162
_________________________________________________________________________________ xi
List of tables
Table 1.1 IT industry competitiveness index: Overall scores and ranks ... 3
Table 4.1 Profile of businesses participating in the interviews ... 40
Table 5.1 Likelihood of software upgrade ... 51
Table 5.2 Innovativeness in regards purchase of software upgrade for most important software ... 52
Table 5.3 Factors extracted 1 ... 54
Table 5.4 Factor 1 ... 55
Table 5.5 Factor 2 ... 55
Table 5.6 Factor 3 ... 56
Table 5.7 Factor 4 ... 56
Table 5.8 Factor 5 ... 56
Table 5.9 Factor 6 ... 57
Table5.10 Regression model ... 57
Table 6.1 Position title ... 61
Table 6.2 Purchasing role in software upgrades ... 62
Table 6.3 Highest level of education ... 62
Table 6.4 Years respondent has personally been using computers ... 62
Table 6.5 Number of years the business had computers ... 62
Table 6.6 Full time computer specialist employee ... 63
Table 6.7 Age of the business ... 63
Table 6.8 Number of full time employees ... 63
Table 6.9 Scope of the business ... 64
Table 6.10 Industry type ... 64
Table 6.11 Annual turnover... 64
Table 6.12 Rotated Component Matrix ... 66
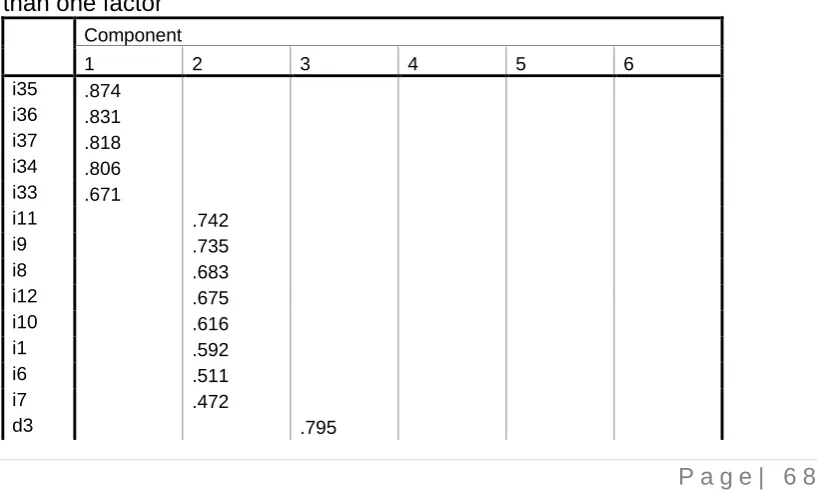
Table 6.13 Rotated factor loadings after the removal of items loading onto more than one factor ... 68
Table 6.14 Rotated factor loadings with the confirmatory data i2 removed 69
Table 6.15 Factors extracted in the Exploratory and Confirmatory data ... 71
Table 6.16 Factor 1 ... 72
Table 6.17 Factor 2 ... 72
Table 6.18 Factor 3 ... 72
Table 6.19 Factor 4 ... 72
Table 6.20 Factor 5 ... 72
Table 6.21 Factor 6 ... 73
Table 6.22 Desired fit statistics ... 75
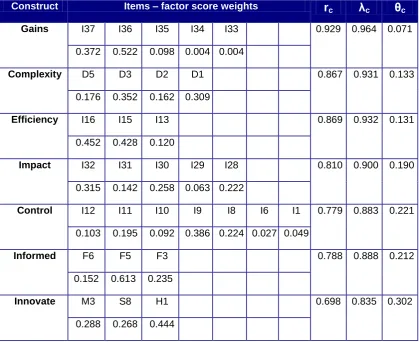
Table 6.23 Gains reliability (rc), loading (λ) and error (θ) ... 78
Table 6.24 Factor score weights for Gains ... 78
Table 6.25 Innovate (hardware) ... 81
Table 6.26 Innovate (most important software) ... 81
_________________________________________________________________________________ xii
Table 6.28 Construct items, loadings, reliability, and error for the
exploratory data ... 83
Table 6.29 Multiple regression model summary ... 84
Table 6.30 Collinearity statistics for the latent variables ... 85
Table 6.31 Measures of fit for the Gains measurement model ... 89
Table 6.32 Measures of fit for the Complexity measurement model ... 89
Table 6.33 Measures of fit for the Efficiency measurement model ... 90
Table 6.34 Measures of fit for the Impact measurement model ... 91
Table 6.35 Measures of fit for the Lack of Control measurement model ... 91
Table 6.36 Measures of fit for the Informed measurement model ... 92
Table 6.37 Measures of fit for the Innovativeness measurement model ... 92
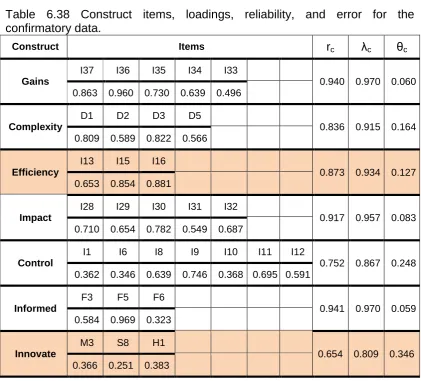
Table 6.38 Construct items, loadings, reliability, and error for the confirmatory data ... 93
Table A.1 Important issues... 122
Table A.2 Decision ... 123
Table A.3 Justification ... 124
Table A.4 Decision maker ... 125
Table A.5 Negatives ... 126
Table A.6 Managing the upgrade ... 127
Table A.7 Information sources ... 128
Table A.8 Testing before buying? ... 129
Table A.9 Adopter type ... 130
Table A.10 Training ... 131
Table A.11 Value of IT ... 132
Table A.12 Utilization ... 133
Table A.13 Dealing with upgrade problems ... 134
Table A.14 Excessive features ... 135
Table A.15 Upgrade problems ... 136
_________________________________________________________________________________ xiii
List of Appendices
Appendix A Interview notes ... 121
Appendix B Software Upgrade Adoption Survey ... 138
Appendix C Script to calculate reliability for congeneric models ... 147
Appendix D Exploratory congeneric models ... 149
Appendix E Confirmatory congeneric models ... 156
P a g e |1
1
Introduction
1.1 Research problem and aim
Since the introduction of the personal computers, small and medium sized businesses have adopted computers. Clearly, these businesses now have experience in purchasing a computer and software. The subsequent utilization of computers within these businesses also means they now possess some computing experience and knowledge.
However, computer technology advances quickly, and what was new quickly becomes old. So the initial purchase, of both the hardware and software, will need to be upgraded.
This study will focus on the software upgrade, and aims to determine the main factors that influence the decision to upgrade software in small and medium sized Australian businesses.
The definition of small and medium sized businesses differs depending on the country involved. Since this research is focusing on Australian businesses, the definitions used by the Australian Bureau of Statistics will be used in this research. The Australian Bureau of Statistics (1999) defines small businesses “as those businesses employing less than 20 people” and further defines a medium business “as those businesses employing between 20 or more people, but less than 200 people”.
According to Microsoft (2009) “An upgrade is a software package that replaces an installed version of a product with a newer version of the same product. The upgrade process typically leaves existing customer data and preferences intact while replacing the existing software with the newer version.” Numerous sources provide very similar definitions. Thus, for the purposes of this study, a software upgrade is a new version of, or addition to a software product that is already installed or in use.
Studies such as those conducted by Maiden and Ncube, 1998; Lai, Trueblood and Wong,1999; Kontio, 1996 and Chau 1995, have dealt with the topic of software selection but only a few research publications have been located that touch on the issue of software upgrades (Howcroft & Light, 2006; Deep, Guttridge, Dani & Burns, 2008; Sawyer, 1999; Ng, 2001; Light, 2001; Carney & Wallnau, 1998 and Montazemi, Cameron & Gupta, 1996). However, these studies have not addressed the specific issue of purchasing software upgrades in the small and medium sized businesses.
P a g e |2
There will always be new software innovations, and for those users who have previously adopted software many of their future purchases will involve upgrades of their existing software. Clearly, there is a need to examine the nature of the adoption of software upgrades. With the ever-increasing reliance on and purchases of application software and the subsequent purchase of upgrades it is obvious that this gap needs to be addressed.
1.2 Background to the research
Australians businesses spend heavily on ICT. According to the Australian Trade Commission (2009), ICT spending in Australia was just over US$60 billion in 2008, and “Australian businesses are looking for new generation IT solutions to maximise productivity and generate revenue.” Australia has a strong computer services sector with exports of almost $2.6 billion during 2002-03 (Houghton, 2006 p.7). However, our imports exceeded this value and the net result was a “…overall deficit on trade in ICT services in 2002-03 of $569 million.” Ignoring the impact that the 2000 Olympic Games had on the ICT services, there have been deficits in the ICT services sector from 1993-94 to 2002-03 as shown in figure 1 below.
Figure 1.1: Australia's ICT services trade balance, 1995-2005 (AUDm) (Source Houghton, 2006)
P a g e |3
Table 1.1 IT industry competitiveness index: Overall scores and ranks (Source: Thomas 2008)
Country Score 2008 rank 2007 rank
United States 74.6 1 1
Taiwan 69.2 2 6
United Kingdom 67.2 3 4
Sweden 66.0 4 7
Denmark 65.2 5 8
Canada 64.4 6 9
Australia 64.1 7 5
In figure 1.2, we see that Australia is among the world leaders in IT spending (Thomas 2008). The Australian federal government is Australia’s biggest spender on ICT and it increased the amount it spends by over 20 percent to be “investing” approximately $5 billion annually on technology. (Bajkowski, 2005)
P a g e |4
However, it is not just government or large organisations that have adopted information technology. One of the main reasons for the increased rate of adoption of computers has been the reduction in the computer prices (Jorgenson 2001). According to Dedrick et al (2003, p16) “the decreasing prices of IT have resulted in a significant increase in its demand, encouraging organizations to substitute IT for labour and for other forms of capital such as plant, machinery, or equipment.”
According to Gartner Consulting’s Worldwide IT benchmark Service (Business Wire July 26 2005) “small and midsized organizations (under $1 billion in revenue) are spending 53 percent to 60 percent of their total information technology (IT) budget on infrastructure, including data centre, voice and data networks, desktop and help desk.” In the US businesses “typically spend over 50 percent of their capital budget on information technology (IT) investments” (Rockart et al., 1996 in Cooper & Bhattacherjee, 2001). IDC (2009) believes IT services will account for 21.1 percent of the ICT spending within Australian manufacturing which is estimated to be worth $4.8 million. Ovum (2009) reported “IT services growth is expect to exceed 4.5 percent in 2010” and by 2013 it is expected to be worth more than $14 billion in Australia and new Zealand. Australian business are investing in IT, which in turn makes software upgrades a significant issue for Australian businesses.
Chesher and Skok (2000) studied the barriers to SMEs getting started but it is now necessary to consider the next stage that the SMEs face. The focus should no longer be on adoption of information technology since most SMEs have done that, but should now be on the understanding how they upgrade their information technology. Chesher and Skok (2000, p.20) found the small business community need “special attention if they are to gain maximum benefit from information and communication technologies.”
Love and Irani (2004) found that “different organisation types significantly differ in the amount they invest in IT and their firm size (in terms of turnover and number of employees) does not influence investment levels in IT.”
1.3 Significance of the research
Computers were first adopted by larger organisations, but the proliferation of computers has been widespread with small businesses now using computers too. The Yellow Pages Small Business Index (1998) found that in Australian small businesses employing fewer than twenty people nearly three-quarters have a desktop computer, and the 2005 Sensis e-Business report found the 95 percent of all small and medium sized business reported owning a computer. By May 2008, the 2008 Sensis e-Business report stated the figure had climbed to 97 percent. Clearly, software upgrades is an issue all of these businesses need to address.
P a g e |5
applications. In 1995 the United States ran an $18 billion trade surplus in off-the-shelf software with Europe alone (Carmel, 1995). The fifth annual BSA and IDC global software piracy study (2007, p.3) states that “by the end of 2007, there were more than one billion PCs installed around the world.” IDC Global anticipates that (2007, p.4) “Globally, businesses and consumers will spend nearly $400 billion on PC software over the next four years.”
The reason for the wide adoption of software packages is they offer many advantages such as lower costs, less risk, high quality, less time to implement, and require fewer resources to obtain.
In 2004, the average amount spent on software by Australian small and medium sized businesses was $3300 (Sensis, 2005). To put this in context, the “average spend for small businesses on computer hardware in 2004 was approximately $4,400, for medium businesses the corresponding spend on hardware was $42,300” and for software, “the average spend for small businesses being $1,900 compared to $31,600 for medium businesses” (Sensis, 2005).
Clearly, Australian small and medium sized businesses spend a significant amount on software. The companies that provide commercial off the shelf packages continually try to improve their product, and to charge for the service. They introduce new features, improve some existing features to make them easier to use, and remodel the software to take advantage of new hardware and operating systems. The result is to entice further spending.
However many consumers have expressed concerns about these improvements for some time. Wysocki (1998) reported that at Aeroquip Corp in USA according, “most office workers at his company use only a small fraction of the computer power, hardware or software, now on their desks.” According to Bove (2005) “Microsoft creates a new product overstuffed with features … to bring the trailing-edge people forward with every release.” So if consumers are not using many of the features of the existing version of the software, why would they be interested in investing in a newer version that will have even more features? Does the degree of utilization of the software impact on the decision to upgrade software?
The use of third party packages brings with it disadvantages such as lack of ownership and lack of control over the code (Stair, 2007). These indirectly expose the business to external changes being forced upon it by the copyright owner of the software. Indeed, the company that owns the copyright to the software will deliver new versions or upgrades to their software when it suits them. Obviously, the timing of the release of the software may not suit the small business purchaser.
P a g e |6
process of defining the need to change an existing system is identified and examined. The analysis in this phase should include justification for the new system. Businesses have, as Love and Irani (2004, p.13) found, “inherent difficulties in identifying and assessing the benefits and costs” making it difficult for them to perform a proper analysis. Consequently, Love and Irani (2004, p.13) report that business are often uncertain “about the expected impact that the investment might have on the business.” Dyerson et al (2009, p.39) reported in the national survey of SMEs use in four sectors, that SMEs are concerned about the cost of their ICT investments and “are uncertain about the business benefits.” So, if businesses are having problems with cost benefit analysis for new software, then what procedures, if any, do small and medium sized businesses follow to purchase an upgrade to their existing software?
This question becomes more important given the frequency with which software is being upgraded and the problems encountered with upgrades. A study by Crameri et al (2007) confirms that problems with upgrades are quite common and that severe disruption can result. So while the cost of a software upgrade is often less than the cost of the new product, the total cost per person of the upgrade is significant when all aspects of the upgrade are taken into account. (Wysocki, 1998; Patterson, 2002)
In summary, most Australian small and medium sized businesses have computers, and must therefore deal with the prospect at some stage of upgrading their software. The cost to business individually and collectively is significant. Small businesses have difficulty understanding the impact of the software upgrade, and dealing with the issues of the software upgrades. Determining the factors that influence the decision to upgrade software in small and medium sized Australian businesses will help to address this significant gap in our knowledge.
1.4 Methodology
This research explores the reasons for adoption of a software upgrade in small to medium sized businesses within Australia. The data collection involves both qualitative and quantitative phases. The qualitative phase provides a detailed view of the variables that influence the decision to upgrade software. The quantitative phase expands the understanding by collecting data from a large sample of the population, allowing quantitative analysis. This is achieved by using a mail survey.
P a g e |7
The research sample for this study consists of a random sample of owner/managers of small and medium sized businesses who are responsible for the adoption of innovative technologies within Australian small and medium sized businesses. The sample size will be large enough so that a reasonable sized dataset is obtained to enable analysis with Analysis of Moment Structures (AMOS) software. To improve both response rates and the research instrument, the design methods suggested by Dillman (1978) and Frazer and Lawley (2000) are used.
The questionnaire consists of a four sections. The first section contains instructions for completing the survey and the purpose of the survey. The second section contains questions to ascertain the current status of software application adoption within the business. The third section includes items to determine the individuals’ perceptions on the upgrading software. The final section collects some demographic information about the respondent and their business.
1.5 Data Analysis
Structural equation modelling techniques have become popular tools in information systems research (Chin, 1998) and will be used to determine from the survey data the factors that influence the decision to upgrade software. Both SPSS V15.0 and AMOS 16 will be used for the analysis of the quantitative data.
1.6 Contributions of the research
The existing knowledge on adoption of innovations and in particular the adoption of technology in small and medium sized business does not address the issue of software upgrades.
Little previous research has been located that deals specifically with the issue of adopting software upgrades to packaged software, especially for small and medium sized business. This research will benefit both the academic and the small business community.
1.6.1 Contribution to academic research
This research will provide a current and comprehensive review of the literature on innovation diffusion of modern technology with an emphasis on upgrade of software. Scales will be developed and refined to measure the decision to upgrade existing software. These scales will provide academics with tools that could be used in both teaching and research.
1.6.2 Contribution to Small Business Practice
P a g e |8
the extent of use of the existing applications should enable the owner/manager to rate the success of the implementation and thus judge previous decisions.
The outcomes of this research will provide guidelines for owners and managers involved in determining requirements for commercial off the shelf software upgrades enabling wiser decisions which should result in savings for the organisation and a greater appreciation of the usage of the current software.
1.7 Limitations of the research
When researching organisations, a number of factors can operate separately or in combination to confound results.
Organisations use a range of software. Most use generic software such as Microsoft Office, accounting packages, and some software that is specific to their industry. The research will ask the respondent to think of the most important piece of software for the purposes of making responses about software upgrades. Naturally, different respondents will be thinking of different software when they respond to these items.
The research is also confined to Australian small and medium sized business, and therefore may not apply to other organisations given the difference in size and nature of Australian small and medium sized business to small and medium sized business in other countries.
1.8 Outline of the dissertation
This dissertation is organised into seven chapters. Chapter one provides an overview of the information technology adoption. The research problem, significance of the research, contribution, and limitations are also included in this chapter.
Chapter two provides details on adoption of technology and reveals the gap that exists in the current literature on adoption of innovations. The scarcity of research conducted in the area of software upgrades is revealed. Following the literature review a conceptual model showing the possible models for further investigation is presented.
The third chapter explains the sequential exploratory methodology employed in this research. The process for the development of the measurement instruments are discussed, the sample used, the data collection, and statistical techniques to be employed are also presented.
Chapter four will provide the details of the data collected from the interviews - the qualitative phase, together with a discussion of the results.
P a g e |9
literature review to develop the survey instrument to be employed in the quantitative stage. The guidelines used to construct the survey are presented. The pilot study will provide details on response rate, expected means, and standard deviations from which an appropriate sample size for the full scale study can be determined.
The full scale study is discussed in chapter six. The aim is to collect a sample large enough to split into two halves. This will enable one half to be used to explore the data and the second half will be used to confirm the findings. Two models will be presented and compared.
P a g e | 1 0
2.1 Introduction
Since 1980, when IBM produced its first personal computer, businesses have spent large amounts of money on personal computers and applications software. By 1998, over $1 trillion dollars had been spent in the U.S. alone (Grover et al. 1998) and since then the amount spent has exploded to the point where worldwide IT spending was expected to exceed $3.3 trillion in 2008 (Gartner, 2007). Over this period there has been rapid progress in chip technology, highlighted by Moore‟s Law, which states “that the number of transistors on a chip will double about every two years and Intel has kept that pace for nearly 40 years” (www.intel.com/technology/mooreslaw/ on 7 Aug 08). This exponential growth in hardware has been paralleled by software improvements making it easier for millions of workers to use desktop computers, even though they know little about computer technology.
As the speed and capacity of computers has improved with each new release, the software running on the machines has changed to take advantage of the faster processing and larger storage. So, while chips are constantly getting faster and are having more features added to them, software vendors are adding new features to their software to exploit the improved chips. This has created what David Flint of Wentworth Research called the “upgrade escalator” (Scott 1998). The upgrade escalator is “the business model designed to entangle the end users into purchasing constantly more expensive and larger software updates”(Open Office, 2008). Diffusion theory provides a general explanation for the way in which innovations are adopted, but is a software upgrade considered an innovation?
P a g e | 1 1
The organisation of this chapter is depicted in figure 2.1. The first section will explore the literature concerned with the diffusion of innovations. Following this is a section on the adoption of information technology in small business. The chapter will then explore organisation buying behaviour to expand on the understanding of how businesses make their purchase decisions. Those areas provide the background for the next section on the adoption of software upgrades to inform the research question. Following the research question, possible factors are identified from the literature. From this a preliminary model is posited. The final section of the chapter is a conclusion, which provides a summary.
P a g e | 1 2
The topics covered in the literature review flow from the parent disciplines of diffusion of innovations, adoption of information technology in small business and organisational buying behaviour as shown in figure 2.2. Each of these areas of literature is discussed in the sections below.
Figure 2.2 Areas of literature relevant to a study on upgrades of office software in Australian small and medium business (Source: developed for this research)
2.2 Diffusion of Innovations
The research into the decision to adopt an upgrade to software is grounded in Rogers‟ (1995) view of innovation and diffusion. The Rogers model is a comprehensive view of the innovation diffusion process and it identifies the five stages to the decision process to adopt an innovation as knowledge, persuasion, decision, implementation, and confirmation.
P a g e | 1 3
Figure 2.3 Adopter categorization on the basis of innovativeness (Source: developed for this research based on Rogers’ categories)
Diffusion is defined as “the process by which an innovation is communicated through certain channels over time among the members of a social system” (Rogers, 1995). The rate of diffusion is best illustrated by the S-shaped diffusion curve shown in figure 2.4.
The research questions addressed by diffusion scholars compare earlier adopters with later adopters, the attributes of the innovation and how it affects the rate of adoption, and why the S-shaped curve “takes off” at about the 1 to 25 percent adoption (Rogers, 1995).
As early as 1990, Brancheau and Wetherbe concluded that innovation diffusion theory did not provide a complete explanation for technology diffusion in organisations. Their work was extended and incorporated into a unified view of the user acceptance of information technology (Venkatesh et al., 2003, p.471) which concluded that “future research should focus on identifying constructs that can add to the prediction of intention and behavior over and above what is already known and understood.” However, all of this
Figure 2.4: S-shaped adopter distribution curve (Source adapted from http://en.wikipedia.org/wiki/Logistic_function)
Time Number of
P a g e | 1 4
prior research has been conducted on adoption of information technology but it has considered the adoption for the first time.
Only a few research publications have been located that refer to software upgrades. However these do not specifically address software upgrades from a small and medium sized businesses perspective. While there will always be new software, the current users have already purchased software, so their future purchases will inevitably involve some upgrades to their existing software. Clearly, there is a need to examine the nature of the adoption of software upgrades. The ever-increasing reliance on and purchase of application software means there will be subsequent purchase of software upgrades. This gap needs to be addressed.
2.3 Adoption of Information Technology in Small
Business
Numerous researchers have investigated the adoption of information technology in small business. When comparing these studies, it is important to realize that there is no universal accepted definition of what constitutes a small business. For example, Ryan and Harrison (2000) in their study based in the United States defined a small business as one having fewer than 250 employees, and a medium business as one having 251-1000 employees. This is different from other countries, and in particular Australia. The Australian Bureau of Statistics (1999) definitions for small businesses and medium business are, “a small business is defined as those businesses employing less than 20 people and a medium business is defined as those businesses employing between 20 or more people, but less than 200 people”. Since this research is based on Australian businesses, the Australian Bureau of Statistics definitions were utilized.
Perceived benefits, organisational readiness, and external pressures to adopt were found to be significant factors for adoption of information technology by small organisations (Iacovou et al. 1995). The Theory of Planned Behaviour was used by Harrison et al. (1997) to predict the decision made by executives to adopt information technology in small business. Their model included the decision process based on attitude, perceived control regarding information technology, firm characteristics, and individual characteristics. Individual characteristics and organisational characteristics were also examined by Thong and Yap (1995).
P a g e | 1 5
2.4 Organisational Buying Behaviour
According to Sheth et al. (1999), the purchase decision is a product of the organisational buying behaviour, which in turn has three key inputs, the organisational characteristics, the nature of the purchase and the information sources. This is represented in figure 2.5.
Figure 2.5. Organisational buying behaviour Source: Adapted from Sheth et al. (1999).
The organisational characteristics identified by Sheth et al. (1999) include size, centralization, purchase orientation and rules and procedures.
P a g e | 1 6
Risk associated with the purchase needs to be considered, “…particularly since one‟s perceptions of risk” would most likely be influenced by the experience in previous purchases (Tanner, 1998).
To facilitate the decision, decision makers rely on information sources that include salespersons, advertisements, product literature, research reports, journals, associations, word of mouth, and vendors (Sheth, 1996).
Undoubtedly, coupled with any purchase of software is the expectation that the new system will result in improvements. A number of factors such as top management support, extent, and nature of user involvement, vendor involvement, quality of system design and the nature of user involvement (Grover et. al, 1998) have been consistently found to show a positive influence on the successful implementation of information systems.
These previous studies dealt with implementation of new systems not upgrades to existing applications software. This research will address the gap that exists in decision to adopt an upgrade to applications software.
2.5 Adoption of Software Upgrades
2.5.1 Hidden costs of software upgrades
The purchase of an upgrade has an obvious financial cost, but additional hidden costs are also incurred when an organisation upgrades its software. Based on the experience of a research institute when it upgraded its operating system the institute found that many of the applications that ran on the previous operating system had to be modified. “This also meant the users had to retrain and learn the use of new commands. Some administrative practices became out of date as a result of the upgrade. The end result was a more efficient and cost-effective system but the cost of accommodating the upgrade went well beyond the retail price of the new software” (Grubb, 2003). Indeed, the costs associated with a software purchase should incorporate other aspects such as an analysis of how well the software will work with the existing software and hardware, whether any data will need to be converted, whether some modification of any software is likely, any ongoing licensing costs, whether the purchase of new hardware will be required, and of paramount importance determine how much staff training may be required (Pereus, 2002).
P a g e | 1 7
2.5.2 Benefits of software upgrades
The benefits of new software include improvements in usability and functionality over the previous version. Software vendors achieve this by conducting usability tests on the new version. Software vendors have had usability laboratories for many years to test how users would react to potential new products and features (Cusumano & Selby, 1995). Rouse et al. (1997) reported that purchasers considered reputation, ease of use and support as the most important criteria for purchase. The numerous studies based on the technology acceptance model (Davis, 1989) agree with ease of use and the perceived ease of use as being determinants of the intention to purchase. These studies however are based on the purchase of a new product, not and upgrade to an existing product.
2.5.3 Pressure to upgrade software
Vendors can be pressured to upgrade their software. If the operating system is changed then they must upgrade their software to work with the new operating system. The new operating system must gain critical mass to make it worthwhile for the vendor to invest in new versions of their software. However, failure to do so could leave the vendor with an unsupported operating system (DeSantis, 2004). This process places added pressure on the vendors to support multiple operating systems. “If you are lucky, most vendors generally will support two versions before the current release. Anything older is too expensive for them to maintain” (Cohen 2004). This happens because users find they are “forced to upgrade” the operating system for one of their critical applications and they then find they have another application has been broken in the process.
In their examination of the software upgrades, Bradley and Dawson (1998) dealt with obsolescence of computer applications. They found the problems associated with obsolescence of software are compounded by the number of software packages used. With an increase in the number of key software packages being used they found a decrease in the expected time to a second re-release. They also found when dominant packages in an organisation are upgraded then hardware was likely to be upgraded, adding to the cost of the software upgrade process.
2.5.4 Investment analysis
P a g e | 1 8
consideration of change management. That is, they incorporated in their investment decision process, costs associated with planning, overseeing, and communicating information to the end users about IT-induced change. Some treated this primarily as an intangible or inestimable cost” (Ryan & Harrison, 2000, p21).
Love and Irani (2004) in an exploratory study of information technology in SMEs found “investment in IT as an act of faith” or the “use of creative accounting” was used as a means of bypassing the justification process.
2.6 Research Question
As technology advances, organisations are faced with the issue of whether they continue with their existing technology or they upgrade. To continually be at the leading edge of technology is an expensive decision to embrace. The vendors‟ continual push for better and faster products coerces the owner/managers to adopt the technology to remain current. Innovation theory presumes the decision to adopt is voluntary; however this may not be the case with upgrades. For example, the inclusion of electronic mail functions in bundled software may result in the innovators and early adopters not being able to communicate effectively with non-adopters. Consequently, the late adopters feel pressured to adopt earlier to alleviate the problem. The following research question will be addressed by this research.
What are the main factors that influence the decision to upgrade software in small and medium sized Australian businesses?
2.7 Factors identified in the literature
There are a number of factors identified in the literature as being significant or potentially significant influences on the decision by small and medium sized businesses to upgrade their software.
2.7.1 Innovativeness
P a g e | 1 9
majority has tried it. The laggards are the last to purchase. They are usually price conscious, suspicious of change, tradition bound, and have to be absolutely certain.
2.7.2 Business impact
Getting it right is critical. There seems to be little concern about hardware upgrades compared with software upgrades. “It's about software, really ... everything else is just hype," said Paul Lindo, CIO of FB2. "Once our mission-critical software can run on Vista reliably, we'll start to move...Moving before the software is safe, though, is suicide. No matter what kinds of performance boosts you can get" (Rist, 2007). Because organisations “rely heavily on a combination of many vendors‟ products,” Benamati and Lederer (2001) p.40) identified „incompatibility‟ between different software packages to be the second most experienced problem, which they concluded “demonstrates the need for IT to work together.” The most experienced problem Benamati and Lederer found was the demands required to train staff. “Learning IT in today's time conscious environment is not easy and existing IT staff are not always positively inclined to reskill to newer technologies. In addition, hiring staff with necessary skills is difficult due to the current shortage of necessary IT skills in the workforce” (Benamati & Lederer, 2001, p40). According to Ryan and Harrison (2000) only a few firms considered the cost of the employees‟ time when determining the training costs.
The impact of the decision to purchase a software upgrade can go beyond the purchase price of the upgrade. New hardware may be required, there may be changes required to other software and of course staff training in the new software needs to be considered. Upgrade costs identified by Ng (2001) consists of software, hardware cost, user training cost, consultancy fees, and cost of data conversion, system analysis, system integration and testing, and a drop in operational efficiency and effectiveness or downtime in relation to the implementation of an upgrade or installation of a new system.
2.7.3 Organisational characteristics
P a g e | 2 0
2.7.4 Prior experience
Tanner (1998) reported on the influence of experience in the purchase decision. Knowledge and understanding of IT were reported as influences in the adoption of e-Commerce for small businesses (Yellow Pages, 1998) which is consistent with the findings of (Abdul-Gader et al., 1995) who found that if decision makers had more computer knowledge, more computer experience, and higher education levels they were less likely to be alienated by computers. Consequently, the business computer experience together with the decision-makers‟ computer experience and decision-makers‟ education level should be examined for their influence on the decision to upgrade computer software.
Many researchers including Davis (1989), Szajna and Scamell (1993), Thompson and Higgins (1994), Taylor and Todd (1995) and Venkatesh and Morris (2000) examined the role of prior experience with computers when developing models of IT adoption. The findings of Taylor and Todd (1995, p.565) showed “that experienced users employ the knowledge gained from their prior experiences to form their intentions.” Clearly the influence of prior experience needs to be considered when developing any models of software upgrade adoption. “IT-related knowledge and experience that a business manager possesses” was explored by Bassellier, Benbasat and Reich (2003, p.317) to determine the “intention to champion IT within their organizations.”
2.7.5 Educational level
Early adopters of PCs tend to have either a university degree or college diploma according to Kangis & Rankin (1996).
Rogers (1995) established a link between knowledge and decision making and as Bassellier, Bebasat and Reich (2003) found “an IT competent manager to be more likely to take action to champion IT than one who lacks such competence”. Indeed, it is not just knowledge or experience with computers, but “highly educated individuals are more likely to know more about information technology and thus exhibit less alienation” (Abdul-Gader et al. 1995). In fact, their study found “decision-maker computer knowledge, computer experience, and education level are closely associated with alienated beliefs and attitudes toward information technology” (p.535).
P a g e | 2 1
2.7.6 Relative advantage
Innovation characteristics as perceived by the adopters are important factors that affect technology adoption (Moore and Benbasat,1991). Tornatzky and Klein (1982) found that compatibility and relative advantage, and complexity have the most consistent significant relationships across a broad range of innovation types. Relative advantage is defined by Rogers (1995) as “the degree to which an innovation is perceived as being better than the idea it supersedes” (p.15) and “has consistently been found to be a predictor of usage in many IS studies” (Karahanna et al. 2002).
2.7.7 Compatibility
“Compatibility is the degree to which an innovation is perceived as consistent with the existing values, past experiences, and needs of potential adopters” (Rogers, 1995, p.15). A software upgrade would be considered compatible if it worked with the current hardware, software and files. Getting multiple software components to work together can be challenging (Spinellis and Szyperski, 2004).
2.7.8 Past behaviour
Two factors that may help with the prediction of intention are a measure of past behaviour and the perception of behaviour control (Thompson & Panayiotopoulos, 1999). Perceived behaviour control as a predictor of intention was proposed by Ajzen (1985) and further studies by Ajzen and others (Ajzen, 1988; 1991; Ajzen and Madden, 1986; Madden et al., 1992) support those findings.
2.7.9 Information
According to Martin and Matlay (2001, p.399) “information acquisition and analysis have been identified as key factors affecting the decision making processes in smaller firms.” Thomas et al. (1991) reported that ICT adoption and implementation costs could be considerably reduced by gathering sound information and Yap et al. (1992) found that successful ICT adoption in small firms is related to the quality of advice provided by external consultants.
2.7.10 External influences
P a g e | 2 2
In 2005, any business involved in importing or exporting goods was forced to comply with Australia‟s new customs system.
Suppliers who release an excessive number of software upgrades force users to purchase unwanted versions while others are struggling with incompatibility issues (Ellison & Fudenberg 2000). Clients can also pressure firms to upgrade software, for example, in Australia, large retailers such as Coles and Woolworths force small wineries to adopt e-commerce and this often involves upgrading existing software packages.
Tornatzky and Fleischer (1990) identified the external environment as a factor influencing small organisations in adopting technology. The external environment includes industry, government regulations and competitors, and provide the environment in which they must operate. Chau and Tam (1997) found external variables less important to the adoption of open systems and Iacovou et al (1995) identified external pressure, such as competitive pressure, and imposition from trading partners, as an influence on EDI adoption practices in small firms.
2.7.11 Complexity
In business buying, the three customer roles - payer, buyer, and user separate out except where the business is a one-person entrepreneur, who makes decisions equivalent to individual decision making (Sheth, Mittal, Newman, 1999, p613). Generally businesses have policies and rules to govern how quotes are obtained, whether any preferential treatment is to be given and how decisions should be made by the buying organization. They go through formal procedures. This formality is less for small businesses that tend to be similar to house hold buyers. This is because the small business tends to be owner-managed.
A concept widely used in industrial marketing is the buyclass model (Robinson et al., 1967). The buyclass model has been tested with varying degrees of success in measuring individual participation and influence across different buying situations (Gronhaug, 1976; Robinson et al., 1967). The buyclass model prescribes that organizations mainly involved with new buying tasks warrant larger and less rigid purchasing configurations than organizations involved with straight and modified rebuys. However, McCabe (1987) questioned generalizations of findings from small group behaviour to overall organisational structure (Xideas and Moschuris, 1998).
Modified rebuys, involving a change in the product class purchased, or a change in source of supply, or both, exhibited significantly higher levels of risk than straight rebuys and even first-time purchases (Newall, 1977). Clearly, these changes add to the complexity of decision.
P a g e | 2 3
although the evidence is limited, suggests some buyclass effect on risk perception.” When making a repeat purchase some degree of loyalty to the existing supplier can be an influence on the decision (Patton et al., 1986). For straight rebuys it seems that some degree of loyalty often exists. For modified rebuy situations that have a moderate to high risk, a group decison models such as a voting tend to be used (Wilson et al., 1991). Loyalty is less likely for modified rebuy situations, but if the purchase decision is high risk then Puto et al. (1985) found strong brand loyalty.
It is expected that likelihood of the software upgrade would deminish as complexity increases.
2.8 Preliminary model
A preliminary model of factors influencing the decision to upgrade software is shown below in figure 2.6. It incorporates all of the factors identified from the literature. At this stage it is impossible to suggest whether any of these factors is more influential than the others.
Figure 2.6 Preliminary model showing potential factors factors influencing decision to upgrade software. Source: developed for this research
2.9 Conclusion
P a g e | 2 4
P a g e |24
3
Methodology
3.1 Introduction
The research problem was detailed in the previous chapter and a theoretical model based on the current literature was outlined. This chapter describes the research methodology used to examine the problem. This is achieved by following the steps shown in figure 3.1. Firstly, the philosophy adopted for this research are presented and then the research design utilized in the study, a sequential exploratory methodology is explained. Following on from this the data collection techniques are described. The data analysis procedures adopted are then outlined. Next, the ethical considerations employed in this research are presented. Finally, the conclusions for the chapter are drawn in section 3.9.
Figure 3.1 Outline of chapter 3
3.2 Research philosophy
P a g e |25
Mixed methods combines both the qualitative and quantitative approaches. The aim of the mixed methods approach is the draw on the strengths of both qualitative and quantitative methods. Mingers (2001, p243) argues the strengths of adopting a mixed methods approach, in that a “research study is not usually a single, discrete event but a process that typically process thorough a number of phases.” Johnson & Onwuegbuzie (2004, p16) believe mixed methods research should “attempt to fit together the insights provided by qualitative and quantitative research into a workable solution.” The pragmatic approach is to adopt research methods that help to best answer the research question.
The previous chapter discussed the diffusion of innovation literature, and factors thought to influence the likelihood to purchase software upgrades were identified: business characteristics, innovativeness, business impact, prior experience, educational level, relative advantage, compatibility, past behaviour, information, external influences, and complexity of purchase decision. However, a gap in the research conducted until now was identified questioning the applicability of these factors.
The research would therefore have to explore the topic. Qualitative research, quantitative research, or a mixture of both was considered. Survey and fieldwork approaches are complementary for information systems research, as traditional survey work is strong in areas where field methods are weak (Gable 1994, Attewell & Rule 1991). Using a mixture of qualitative and quantitative is in keeping with the philosophy of pragmatism, which according to Johnson and Christensen (2008, says researchers should use the approach or mixture of approaches that works. Petter and Gallivan (2004, p.4) suggest that “to the pragmatist perspective, the integration of methods from differing paradigms is a powerful method to enhance the credibility of findings.”
3.3 Sequential exploratory design
When considering a mixture of both qualitative and quantitative research, the options consist of undertaking both the qualitative stage and quantitative stage either in parallel or in sequence. Because of the exploratory nature of the research, a sequential exploratory design was considered to be the best methodology to further study the factors that influence the likelihood to purchase software upgrades.
P a g e |26
in figure 3.2. This design is a mixed-method approach where both qualitative and quantitative data are collected.
Figure 3.2 Sequential Exploratory Design (Creswell, 2003 p. 213)
Firstly, the qualitative data were collected to enable exploration of “the topic with participants at their sites” (Creswell, 2003 p.212). In-depth interviews were conducted with businesses to provide a detailed view of the factors that influence the likelihood to purchase software upgrades. Only after the analyses of the qualitative data was it possible to develop the survey instrument to be used in the next stage. The survey instrument was used to collect data for quantitative analysis.
The quantitative stage builds upon the understanding gained in the qualitative stage by collecting data from a large number of people thereby enabling some quantitative analysis (Creswell, 2003). The survey was completed in two steps. The first step was a pilot study. The data collected from the pilot study was analysed so that any modifications necessary could be made for the second step, the full scale study. The sample size for the full scale study was designed to be sufficiently large enough to enable the data to be split into two halves for analysis. According to Byrne (2001) using split halves makes it possible to use the first half for exploration and to confirm the findings with the second half.
P a g e |27
This is the approach undertaken when a researcher does not have sufficient evidence to determine the number of factors underlying the data, thus making it inappropriate to formulate hypotheses until the data has been explored (Stapleton, 1997). Therefore, exploratory factor analysis is generally thought of as more of a theory-building procedure as opposed to a theory-testing procedure (Stevens, 1996). After the exploratory analysis some hypotheses can be posited, and these can then be tested with the analysis of the second half.
Following the analysis of the quantitative data from the full scale study, the entire analysis can be interpreted to provide answers to which factors influence the decision to intent to purchase a software upgrade. Thus, the inferences of the first stage of data collection, if correct, can be either confirmed or disconfirmed.
The second stage of the study used a mail survey. Both factor analysis using SPSS and structural equation modelling using AMOS were used for the analysis of the data from the mail survey. Reasons for using a mail survey and factor analysis and structural equation modelling are provided in the following sections.
3.4 Qualitative Study
To determine the information required and from whom it should be sought it is necessary to examine the research question:
What are the main factors that influence the decision to upgrade software in small and medium sized Australian businesses?
The potential factors that influence the decision to upgrade software were identified in the literature review. Following this, in-depth interviews were conducted with local small business to ascertain whether further factors might be considered for inclusion in a survey.
Interviews with representatives from the target population were used because interviews are a recognized technique for exploring the issues and determining the scope of the topic (Sekaran 2003; Zikmund 2000). According to Yin (2003) using multiple interviews is considered an appropriate method for gathering information on the current behaviour which can then be used to produce findings that can be generalized.
3.5 Protocols used in the interviews
P a g e |28
Introduction and explanation that the research was about software upgrades within business throughout Australia. This first stage was designed to elicit the perspective of businesses. Talking with people who make the decision to upgrade software will help me clarify issues so that I can develop a questionnaire.
Discuss why the person was selected and ethical issues such as the taking of notes, and how a survey will be developed from the points made in the interviews. While a tape recorder is not being used, it will be necessary to record some key phrases verbatim.
Stress that anything they say will be confidential to protect both the interviewee and the business. Permission was sought to take notes during the interviews.
Obtain consent to proceed.
Start with a warm-up question about the business.
Use open-ended questions and when appropriate use a funnelling technique to explore an issues exposed by the interviewee to seek understanding.
Do not evaluate the responses, but listen to and interpret the information provided.
Do not interrupt.
Let the respondent think and discuss their ideas.
Towards the end of the interview introduce ideas presented in prior interviews to elicit comment.
Check the understanding to ensure their point is clearly understood.
Take notes in preference to tape recording the interview. This will force the interviewer to actively listen and to take clear notes. It also removes any concerns associated with being recorded. The aim was not to make a transcript of the conversation, rather to record keywords and phrases.
Observe the body language and react accordingly.
When finished, ask if there is anything further they wish to add.
Thank the respondent for the time and thoughts.
The businesses were contacted to explain the nature of the research and the purpose of the interview. The most appropriate person to interview was determined at this stage. This person had to be responsible for making the decision to purchase software, and software upgrades. A time and place for the interview was scheduled.
P a g e |29
captured. Each interview lasted until no new ideas were forthcoming, which was usually after one hour.
3.6 Quantitative Study
To further explore the issues identified in the interviews it was necessary to collect survey data from a wider sample of Australian small and medium sized businesses. The alternatives considered for conducting the survey were more personal interviews, telephone interviews, an Internet survey, or a mail survey. Personal interviews would be costly and difficult to schedule, and extremely time consuming to conduct in large numbers. For this reason this alterna