White Rose Research Online URL for this paper:
http://eprints.whiterose.ac.uk/108609/
Version: Accepted Version
Article:
Lund, M. V., Andreyev, Andrei orcid.org/0000-0003-2828-0262, Borge, M. J. G. et al. (41
more authors) (2016) Beta-delayed proton emission from 20Mg. European Physical
Journal A : Hadrons and Nuclei. pp. 1-14. ISSN 1434-601X
https://doi.org/10.1140/epja/i2016-16304-x
[email protected] https://eprints.whiterose.ac.uk/
Reuse
Items deposited in White Rose Research Online are protected by copyright, with all rights reserved unless indicated otherwise. They may be downloaded and/or printed for private study, or other acts as permitted by national copyright laws. The publisher or other rights holders may allow further reproduction and re-use of the full text version. This is indicated by the licence information on the White Rose Research Online record for the item.
Takedown
If you consider content in White Rose Research Online to be in breach of UK law, please notify us by
(will be inserted by the editor)
Beta-delayed proton emission from
20
Mg
M.V. Lund1a, A. Andreyev2, M.J.G. Borge3,4, J. Cederk¨all5, H. De Witte6, L.M. Fraile7, H.O.U. Fynbo1, P.T. Greenlees8,9, L.J. Harkness-Brennan10, A.M. Howard1, M. Huyse6, B. Jonson11, D.S.Judson10, O.S. Kirsebom1, J. Konki8,9, J. Kurcewicz4, I. Lazarus12, R. Lica4,13, S. Lindberg11, M. Madurga4, N. Marginean13, R. Marginean13, I. Marroquin3, C. Mihai13, M. Munch1, E. Nacher3, A. Negret13, T. Nilsson11, R.D. Page10, S. Pascu13, A. Perea3, V. Pucknell12, P. Rahkila8,9, E. Rapisarda4, K. Riisager1, F. Rotaru13, C. Sotty6,13, M. Stanoiu13, O. Tengblad3, A. Turturica13, P. Van Duppen6, V. Vedia7, R. Wadsworth2, and N. Warr14 (IDS Collaboration).
1 Department of Physics and Astronomy, Aarhus University, DK-8000 Aarhus C, Denmark
2 University of York, Dept Phys, York YO10 5DD, N Yorkshire, United Kingdom
3 Instituto de Estructura de la Materia, CSIC, E-28006 Madrid, Spain
4 ISOLDE, PH Department, CERN, CH-1211 Geneva 23, Switzerland
5 Department of Nuclear Physics, Lund University, SE-221 00 Lund, Sweden
6 KU-Leuven, Instituut voor Kern- en Stralingsfysica, Celestijnenlaan 200D, B-3001 Leuven, Belgium
7 Facultad de Ciencias Fisicas, Universidad Complutense de Madrid, CEI Moncloa, 28040 Madrid, Spain
8 Helsinki Institute of Physics, University of Helsinki, P.O. Box 64, FIN-00014 Helsinki, Finland
9 University of Jyvaskyla, Department of Physics, P.O. Box 35, FIN-40014 University of Jyvaskyla, Finland
10 Department of Physics, Oliver Lodge Laboratory, University of Liverpool, Liverpool L69 7ZE, United Kingdom
11 Department of Physics, Chalmers University of Technology, SE-412 96 G¨oteborg, Sweden
12 STFC Daresbury, Daresbury, Warrington WA4 4AD, United Kingdom
13 ”Horia Hulubei” National Institute of Physics and Nuclear Engineering, RO-077125 Magurele, Romania
14 Institut f¨ur Kernphysik, Universit¨at zu K¨oln, Z¨ulpicher Strasse 77, D-50937 K¨oln, Germany
Received: date / Revised version: date
Abstract. Beta-delayed proton emission from 20Mg has been measured at ISOLDE, CERN, with the ISOLDE Decay Station (IDS) setup including both charged-particle and gamma-ray detection capabilities. A total of 26 delayed proton branches were measured including seven so far unobserved. An updated decay scheme, including three new resonances above the proton separation energy in 20Na and more precise resonance energies, is presented. Beta-decay feeding to two resonances above the Isobaric Analogue State (IAS) in20Na is observed. This may allow studies of the 4032.9(2.4) keV resonance in19Ne through the beta decay of 20Mg, which is important for the astrophysically relevant reaction 15O(α, γ)19Ne. Beta-delayed protons were used to obtain a more precise value for the half-life of20Mg, 90.9(1.2) ms.
PACS. 23.20.Lv γtransitions and level energies – 26.30.Ca Explosive burning in accreting binary systems (novae, x-ray bursts) – 27.30.+t 20≤A≤38 – 29.30.Ep Charged-particle spectroscopy
1 Introduction
20Mg is located on the proton drip line with a half-life of
90(6) ms according to the latest evaluation [1]. It beta de-cays by allowed transitions to excited states in20Na with Iπ = 0+,1+ as the ground state of 20Mg is a 0+ state. Due to the large beta-decay energy of drip-line nuclei in general, they are a source of many different decay channels [2–4], and 20Mg is no exception. It has several energeti-cally allowed decay channels: βγ, βp, βα, βpα and βαp. Only the first two have been observed previously [5–8]. The present understanding of the decay of20Mg is mainly based on Ref. [5] and [7]. The most recent result on20Mg [8] is the accurate and precise determination of the
ex-a e-mail: [email protected]
citation energy of the IAS in 20Na, 6498.4(5) keV, which revalidates the Isobaric Multiplet Mass Equation (IMME) for the A = 20 quintet by shifting its excitation energy down by 25 keV.
The main 20Mg beta branch feeds the 984 keV state of20Na (I
β = 69.7(1.2)% [5]), which is located below the
proton separation energy,Sp= 2190.1(1.1) keV [6]. This
state decays to the ground state of 20Na by emission of a single gamma ray. It is followed by the beta decay of 20Na to 20Ne, which has a substantial decay branch of
not allow discrimination between the low-energy protons and the16O recoils.
The beta-delayed proton emission from20Mg feeds res-onances in 19Ne. The ground state of 19Ne (plus pro-ton mass) is located 2190.1(1.1) keV [6] above the ground state of20Na and the known excited states are located at 238.27(11) keV, 275.09(13) keV, 1507.56(30) keV, 1536.0(4) keV, 1615.6(5) keV, 2794.7(6) keV, and 4032.9(2.4) keV [10]. The four lowest excited states are known to be pop-ulated by the beta decay of 20Mg. However, the small energy gap (37 and 28 keV) between them presents an experimental challenge when measuring the beta-delayed proton spectrum. The measurement of the individual de-cay branches become easier if the protons are measured in coincidence with the gamma-rays de-exciting the states. The first and second excited states can only decay to the ground state by emission of a single gamma-ray. The third and fourth excited states decay predominantly to the sec-ond (Iγ,1= 88% [10]) and first (Iγ,1 = 95% [10]) excited state, respectively. They do, however, have a small branch to the first (Iγ,2 = 12% [10]) and second (Iγ,2= 5% [10]) excited state, respectively.
At an excitation energy of 4032.9(2.4) keV the seventh excited state in 19Ne is located in the Gamow window of the 15O(α, γ)19Ne reaction. This is the first reaction in the first breakout sequence from the HCNO-cycles [11] with the second reaction being19Ne(p,γ)20Na. The break-out sequence is leaking C, N and O seed nuclei into the A > 20 region and it is followed by the αp- and therp -processes. The 4032.9(2.4) keV resonance is dominating the15O(α, γ) reaction rate under type I X-ray burst con-ditions [12]. To quantify the reaction rate it is important to measure the alpha-particle emission branching ratio of the 4032.9(2.4) keV resonance. It is expected to be roughly 10−4 [13, 14], but it has never been measured directly as the Coulomb barrier suppresses the rate of alpha-particle emission. The beta-decay of20Mg has a large enoughQ
EC -value to feed the resonance through beta-delayed proton emission, so it should be possible with enough statistics to observeβpαas well asβpγ emission through this reso-nance.
The 2647(3) keV resonance in20Na is located just above the threshold for proton emission, Sp = 2190.1(1.1) keV
[6]. It is the most important resonance for determining the 19Ne(p, γ)20Na reaction rate in X-ray bursters, as it is located in the Gamow window of the reaction. The spin and parity of this resonance have been the subject of some debate in the past. The present understanding point to-wards Iπ = 3+ [7], however, a 1+ assignment is not yet fully ruled out. On the basis of the beta-decay feeding of this resonance, it is possible to set stringent limits on the spin and parity when considering the selection rules for an allowed beta decay.
This paper presents the results of a beta-decay study of20Mg performed at the ISOLDE Decay Station (IDS). A detailed description of the experiment, analysis and results can be found in Ref. [15]. In this paper, we will start by describing the beam production, the experimental setup and the calibration procedures in Sect. 2. In Sect. 3 we will
present the measured particle spectra and a determination of the half-life. Then we will explain the reconstruction of the decay scheme and the determination of the absolute beta-decay intensities in Sect. 4. At the end of Sect. 4, we will also present and discuss the status of the astrophysi-cally relevant states.
2 Experimental methods
2.1 Beam production
The beam of20Mg was produced at the ISOLDE facility [16] at CERN by bombarding a SiC target with a pulsed 1.4-GeV proton beam from the Proton-Synchrotron Booster (PSB). The magnesium nuclei were selectively ionized with the laser-ion source RILIS [17]. However, a large amount of sodium was also ionized due to surface ionization. The cocktail beam was accelerated to 30 keV and mass sepa-rated with the High Resolution Separator (HRS),M/∆M = 5000, with a slit cutting away part of the beam on the low-mass side (20Na). To further suppress the isobaric contam-ination of sodium, we made use of the PSB time structure of 1.2 s separated proton bunches. Taking advantage of the fact that the time for magnesium ions to diffuse out of the target, be ionized and transported to the detec-tion chamber is of the order of 150 ms, and that the half-lives differ significantly for20Mg (T
1/2= 90(6) ms [1]) and 20Na (T
1/2 = 447.9(2.3) ms [1]), we only allow the beam into the detection chamber for the first 300 ms following proton impact on the production target.
The mass separated beam was implanted in a carbon foil of thickness 24.5(5)µg/cm2in the center of the detec-tion setup, see Fig. 1. The thickness of the carbon foil was determined by measuring the energy lose of alpha particles from a known source as they passed through the carbon foil. From measurements of the decay of20Mg and20Na we estimate that for every20Mg ion implanted, we implanted about 2320Na ions in the carbon foil. By counting all de-cay products from the beta-dede-cay of 20Mg, we determine the total number of implanted20Mg ions to be 8.65(8)·106. The total measurement time was 53.2 hrs.
Initially we experienced problems with beam losses on a collimator at the entrance to the detection chamber. We optimized the beam tuning parameters and obtained an almost complete transfer into the detection chamber. However, from analysis of the 20Na beta-decay we sus-pect that a few percent of the beam is implanted in the collimator (not shown in Fig. 1), which leads to a small systematic error when determining the branching ratios. This is discussed in detail in Sect. 4.3.
2.2 Detection setup
B A
C
D
1 2
4
3 6
[image:4.595.47.288.102.277.2]5
Fig. 1. (Color online) Sketch of detector setup. The beam is
coming from the bottom of the figure and is implanted in the carbon foil in the center of the setup (no. 6). Surrounding the foil are four charged particle telescopes (no. 1-4) and below the foil is a single thick DSSSD (no. 5). Outside the vacuum chamber (not shown here) are the four HPGe clover detectors (A-D). We will refer to this numbering throughout the paper.
beam is stopped at the center of the carbon foil. Surround-ing the silicon detector array we placed four clover HPGe-detectors (A-D). The detector setup is therefore able to detect both charged particles and gamma rays with high efficiency.
The silicon detector array consisted of four∆E-E tele-scopes forming the sides of a cube (no. 1-4) enclosing the carbon foil (no. 6) and one 1000µm thick Double Sided Sil-icon Strip Detector (DSSSD, no. 5) forming the bottom of the cube. The top of the cube was left open in order to al-low room for the carbon foil support. The four telescopes were in the following configurations: 20µm SSD (Single sided Strip Detector, 16 front strips) - 500µm DSSSD (no. 3), 40µm DSSSD - 500µm pad (no. 4), 60µm DSSSD -500µm pad (no. 1), and 300µm DSSSD - 500µm pad (no. 2). Each of the backing detectors covered a solid angle of about 4.7% out of 4π, while the front detectors each cov-ered a solid angle of about 5.2% of 4π. All of the DSSSDs were 16 x 16 strip detectors with 3.0 mm strip width and 0.1 mm interstrip width.
The silicon detector setup was designed to maximize the solid-angle coverage. To produce clean proton spec-tra we used thin front detectors in three of the four tele-scopes. The alpha particles from the decay of 20Na will then be stopped in the front detector, while the protons will punch through the front detector due to their lower stopping power. For the 40µm and 60µm silicon detec-tors all the alpha particles will be stopped, whereas for the 20µm detector the most energetic alpha particles will punch through. In the fourth telescope we placed a 300µm thick front detector in order to obtain a better energy res-olution than the thinner detectors. The backing detectors
were chosen to be 500µm thick in order to stop all protons. On all five sides of the detector array we used one 16 x 16 strip DSSSD in order to be position sensitive. The silicon detectors were placed in a 3D-printed support structure such that the telescopes pairwise faced each other, in or-der to be able to make coincidence gates as efficient as possible.
Data from the HPGe detectors were recorded simul-taneously with a digital- and an analog data acquisition (daq) system. While the digital daq have superior en-ergy resolution (see Sect. 2.4), only the analog system were recording charged particle events, which allows one to study particle-gamma coincidences. All HPGe detector crystals were treated as individual detectors in the analy-sis of the data from the analog daq system.
2.3 Silicon detector calibration
For the geometry and energy calibrations of the silicon de-tector setup, we used a beam of21Mg. The21Mg ions were produced in the same manner as the 20Mg ions. Due to the similar masses both beams will stop at the same depth in the carbon foil to within 1 nm (estimate based on stop-ping powers). The beta decay of 21Mg is well known, see e.g. [18–20], and it exhibits several high intensityβp tran-sitions, which we have used for the calibration. However, for the very thin front detectors of 20µm and 40µm most proton lines punch through the detector. For these detec-tors we have used the well known beta-delayed alpha lines from 20Na.
For the unsegmented pad detectors positioned as back-ing detectors in three of the four telescopes, we used the 21Mg decay as calibration source. However, in the case
of telescope no. 2 the front detector is 300µm thick, and the protons do not reach the pad detector. Hence we have used measurements with a quadruple alpha source (148Gd, 239Pu, 241Am and 244Cm) for the calibration of this
de-tector.
For all energy calibrations of silicon detectors we take into account the energy loss in detector dead layers and in the carbon foil using the stopping power tables found in theStopping and Range of Ions in Matter (SRIM) cat-alogue [21]. The position of the implanted beam is deter-mined from the intensity distribution on the segmented detectors.
2.4 HPGe-detector calibration
The HPGe-detector array is energy calibrated with a152Eu gamma-ray source. To find the photo-peak centroid we fit the line shape with a Gaussian function. The energy calibration results in an energy resolution of FWHM = 13.2 keV for the 1408 keV gamma-ray in the analog daq and FWHM = 3.1 keV in the digital daq.
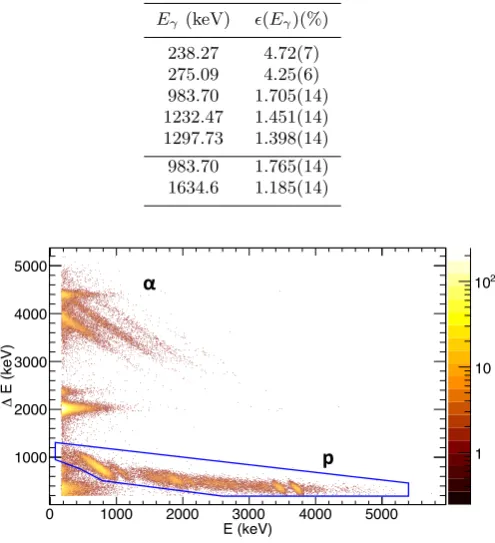
gamma rays used for the calibration ranged from 244.6975 keV and up to 1408.006 keV. Gamma-ray energies and in-tensities have been adopted from Ref. [22]. The number of detected gamma rays was determined using a line shape fit of the photo-peak, and translated into absolute efficien-cies. The absolute efficiencies determined in this way are described well by the function
ǫ(E) =ep0+p1·ln(E) (1)
Fitting the measured efficiencies in the analog daq with this function results in the parameter valuesp0= 0.869(81) and p1 = −0.717(12) with a covariance term given by cov(p0, p1) =−0.000988. The efficiency function and the measured efficiencies in the analog daq are presented in Fig. 2. The effect of summing is small as the total ab-solute efficiency is low, and as a consequence we do not account for this effect. The observed deviations between the efficiency function and the measured efficiencies, as ob-served in Fig. 2, are mainly caused by the fitting procedure of the photo peaks not being perfect. A similar analysis was performed in the digital daq system, which results in p0= 1.38(8) andp1=−0.785(12) with a covariance term given by cov(p0, p1) =−0.00102.
Energy (keV) 200 400 600 800 1000 1200 1400
∈
0.01 0.015 0.02 0.025 0.03 0.035 0.04 0.045 0.05
Fig. 2.(Color online) The measured absolute efficiencies with
the analog daq and a fit to these data points with the function given in Eq. (1).
The final absolute efficiencies as measured with both daq systems are presented in Table 1.
3 Analysis
We present the measured proton spectra in Sect. 3.1 and compare with previous measurements from Ref. [5, 7]. In Sect. 3.2 an updated value for the half-life of20Mg is pre-sented.
3.1 Spectra
[image:5.595.306.554.141.413.2]A ∆E-E spectrum showing data from telescope 3 is pre-sented in Fig. 3. The events inside the solid (blue) contour
Table 1. Total absolute gamma-ray efficiency for the
HPGe-detector array in percent (the top five efficiencies are from the analog daq, the bottom two efficiencies are from the digital daq).
Eγ (keV) ǫ(Eγ)(%)
238.27 4.72(7) 275.09 4.25(6) 983.70 1.705(14) 1232.47 1.451(14) 1297.73 1.398(14)
983.70 1.765(14) 1634.6 1.185(14)
E (keV)
0 1000 2000 3000 4000 5000
E
(ke
V)
Δ
1000 2000 3000 4000 5000
1 10
2
10
α"
[image:5.595.47.273.383.538.2]p"
Fig. 3. (Color online)∆E-E spectrum from the charged
par-ticle telescope consisting of a 20µm thick SSD front detector and a 500µm thick DSSSD back detector (telescope no. 3). The events between 3-5 MeV on the vertical axis and 0-2 MeV on the horizontal axis are punch-through alpha particles that reach the back detector. The events inside the solid (blue) line are protons that punch through the front detector. The solid (blue) contour is used as a graphical gate to produce a clean proton spectrum in the back detector, see Fig. 4.
are protons that punch through the thin front detector and are stopped in the back detector. The main part of the beta-delayed alpha particles from20Na are stopped in the front detector due to energy losses. However, the highest-energy alpha particles have enough highest-energy to reach the back detector. These alpha-particles are the events be-tween 3-5 MeV on the vertical axis and 0-2 MeV on the horizontal axis.
The proton spectrum measured in the back detector of telescope 3 is shown in Fig. 4. It exhibits the same features as observed in previous measurements Ref. [5, 7], and we use the same naming convention for the various proton peaks (pi, where i= 1,2, ...,11). We observe several new
proton peaks. We name these with roman numerals from pI to pV. More details on the new proton peaks will be
presented in Sect. 4.
ori-E (keV)
1500 2000 2500 3000 3500 4000 4500 5000 5500
co u n ts / 1 0 ke V 1 10 2 10 3 10
p11# p10#
p9# p8#
p7# p6# p5# p4#
pI#
pII# pIV# p
III#
[image:6.595.304.555.90.429.2]pV#
Fig. 4. (Color online) Proton spectrum measured in the
500µm thick back detector of telescope no. 3 with an energy resolution of σ = 47 keV. The spectrum is produced by de-manding a multiplicity of 1 in the detector itself, and by only looking at events inside the solid (blue) contour in Fig. 3.
E (keV)
500 1000 1500 2000 2500 3000
C o u n ts / 2 0 ke V 10 2 10 3 10 4 10 5 10 Spectrum 1 Spectrum 2 Spectrum 3
16O$
16O$
p1$
p4$
α5$ α6$
Fig. 5. (Color online) Three different proton spectra with
the proton center-of-mass energy as measured in the 40µm thick DSSSD in telescope no. 4 with an energy resolution of σ= 20 keV.Spectrum 1 (dashed blue): The data from the tele-scope subjected to a graphical gate that cuts away events which punch through the front detector.Spectrum 2 (dotted red):On top of the punch through gate for spectrum 1 we apply a time cut (t <100 ms).Spectrum 3 (solid green):On top of the punch through gate and the time gate we apply the condition that the opposing front detector (60µm DSSSD) measures no particles.
gin of the peaks. As the produced beam of20Mg is strongly contaminated by20Na, it is important to perform such an identification. Spectrum no. 1 (dashed blue) contain the events observed in the front detector that do not punch through. Spectrum no. 2 (dotted red) is spectrum no. 1 subjected to the additional condition oft <100 ms where tis the time since the last implantation of20Mg ions in the carbon foil. As the half-lives of the two components dif-fer significantly (20Mg hasT
1/2 = 90(6) ms [1] and 20Na has T1/2 = 447.9(2.3) ms [1]), such a time gate should
2000 2500 3000 3500 4000 4500 5000 5500 6000
co u n ts / 4 0 ke V 0 10 20 30 40 50 (A)
2000 2500 3000 3500 4000 4500 5000 5500 6000
co u n ts / 4 0 ke V -5 0 5 10 15 20 (B)
p5# pV# p6#p7#
p8#
pIV# pIII# p9#
p10#
p5# pV#
p6#
p7# p
8#
pIV#
pIII# p9# p10#
(A)#
(B)#
E (keV)
2000 2500 3000 3500 4000 4500 5000 5500 6000
co u n ts / 2 0 ke V 1 10 2 10 3 10 (C)
p5#
pV#
p6#
p7#
p8#
pIV#p III# p9#
p10#
p11#
pI#
pII#
[image:6.595.47.292.91.265.2](C)#
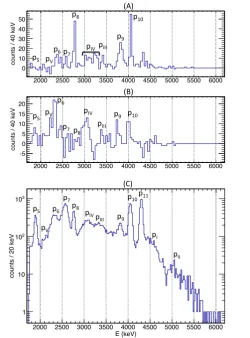
Fig. 6.(Color online) (A) Proton spectrum in the back
detec-tor of telescope 4 gated on the 238 keV gamma-ray and cor-rected for background (see text for details). Negative counts are caused by the background subtraction. (B) Proton spec-trum in the back detector of telescope 4 gated on the 275 keV gamma-ray and corrected for background (see text for details). Negative counts are caused by the background subtraction. (C) Total proton spectrum in the back detector of telescope 4 with an energy resolution ofσ= 27 keV.
reduce the20Na component relative to the 20Mg compo-nent. Spectrum no. 3 (solid green) has the additional con-dition that the opposing front detector (telescope no. 1) observes no particles. Considering the kinematics of the decay of 20Na and 20Mg it is clear that only the 16O re-coils from20Na will reach the front detectors. Hence, the effect of applying the last gate will be to reduce the20Na related peaks in the spectrum while keeping the20Mg re-lated peaks intact.
The effect of applying the time gate is most clearly observed by focusing on the double peak structure be-tween 600 and 1000 keV. Before applying the time gate the high-energy peak is the most intense, while the time gate reverses the situation. This reflects the fact that the high-energy peak (900-1000 keV) belongs to the decay of 20Na, while the low-energy peak (600-800 keV) belongs to
[image:6.595.46.291.344.512.2]E (keV)
200 400 600 800 1000 1200 1400 1600 1800
C
o
u
n
ts
/
4
ke
V
1 10
2 10
3 10
I"II" III"
[image:7.595.47.274.102.262.2]IV"
Fig. 7. (Color online) Gamma-ray spectrum from all
HPGe-detectors in coincidence with the proton spectrum shown in Fig. 4. Four gamma-ray peaks are visible: 238 keV (I), 275 keV (II), 511 keV (III) and 1298 keV (IV).
The effect of requesting no particle events in the op-posing front detector can also be clearly observed in the double peak structure. After having applied the gate, the peak at 600-800 keV belonging to the decay of 20Mg is almost untouched, while the 20Na peak is strongly sup-pressed. This last gate is therefore a strong tool when identifying the origin of the peaks in the spectrum. It is from the effect of this gate that we conclusively assign the nature of the peaks as highlighted on the figure. We do not observe signs of the previously observed proton branches p2 and p3, due to the large contamination of 20Na.
The gamma rays emitted in coincidence with the beta-delayed protons have been measured with the HPGe ar-ray. The 238 keV and the 275 keV gamma rays are the most intense gamma rays emitted in coincidence with the delayed protons. Fig. 6 shows three different proton spec-tra as observed in the back detector of telescope 4: (A) in coincidence with the 238 keV gamma ray, (B) in coin-cidence with the 275 keV gamma ray, (C) proton singles spectrum. Both gamma-rays has a background contribu-tion from the Compton continuum of the 511 keV annihi-lation gamma-ray, as is evident from Fig. 7. To correct for this background contribution, we subtract a proton spec-trum gated on the background-free part of the Compton continuum from the 511 keV gamma ray, in order to obtain the two spectra shown in panel (A) and (B).
Fig. 7 shows the total gamma-ray spectrum measured in coincidence with the proton spectrum in Fig. 4. Three peaks are clearly identified at the energies 238 keV, 275 keV and 511 keV. The 238 keV and 275 keV gamma-rays are identified as the de-excitation of the first and second ex-cited states in the proton daughter19Ne, respectively. The 511 keV gamma-ray is caused by annihilation of the emit-ted β+-particle. At higher energies we also observe the 1298 keV gamma ray that connects the fourth and first excited states in19Ne. As expected, we do not observe the 984 keV gamma-ray connecting the first excited state and the ground state of20Na (the state is below the threshold).
3.2 Half-life determination
The half-life of20Mg was determined from the time distri-bution of the protons measured with the back detector of telescope no. 3, see Fig. 4. The time distribution is shown in Fig. 8 and it is fitted with a function describing the standard radioactive decay lawA(t) =λ·N0·e−λ·t. Using
the MINOS error estimation technique from the MINUIT2
minimization package [23] we perform a standard Pois-son log-likelihood fit of the data in order to include bins with zero counts and to obtain a more reliable fit when low count numbers are present (≈10 or fewer counts per bin). The half-life value determined from the fit isT1/2= 90.9(1.2) ms with χ2/ndf= 376/443 = 0.85, which is a good fit based on Ref. [24]. This value is to be compared with T1/2= 90(6) ms from the latest evaluation, [1]. The two values are in agreement, however, the value measured here is a factor of 5 more precise. Therefore, we use the new value of T1/2 when determining the log(f t)-values.
Time (ms)
0 200 400 600 800 1000 1200
Counts / 2 ms
1 10
2
[image:7.595.310.533.356.511.2]10
Fig. 8. (Color online) Half-life fit for the20Mg decay (solid
line). The time distribution is from the proton spectrum pre-sented in Fig. 4. The fitting is performed on the interval 300−1200 ms with 300 ms being the time when the beam gate closed and 1200 ms being the time when the next proton pulse possibly arrives at the ISOLDE production target.
4 Results and discussion
We present an extended interpretation of the decay scheme in order to accommodate the five new proton peaks. We also determine the log(f t)-values of the beta decay of 20Mg. We obtain more precise resonance energies in20Na
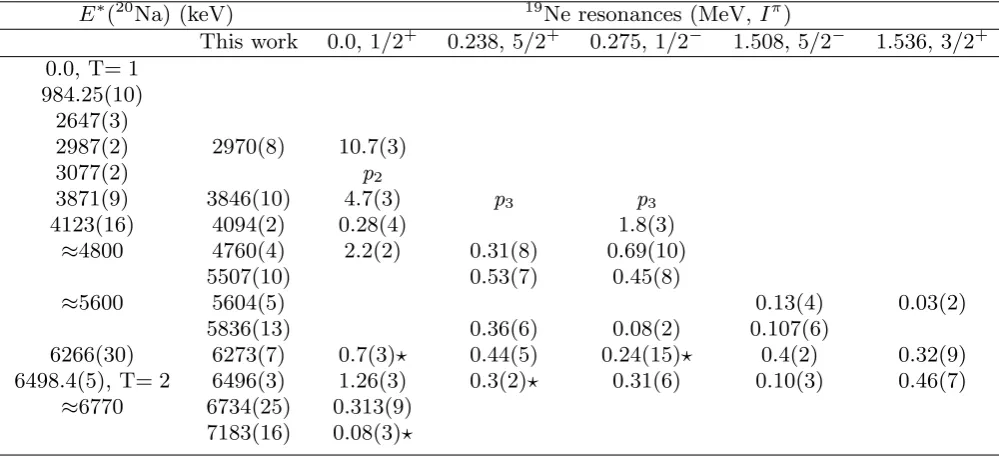
Table 2. The20Na energies E∗(20Na) are taken from Ref. [5, 7–9, 25]. Three previously unobserved resonances in 20Na have been introduced at 5507(10) keV, 5836(13) keV and 7183(16) keV. The position of p2 and p3are based on previous experiments, as we do not observe any clear evidence for these proton branches.
E
∗(
20Na) (keV)
19Ne resonances (MeV,
I
π)
This work
0.0, 1
/
2
+0.238, 5
/
2
+0.275, 1
/
2
−1.508, 5
/
2
−1.536, 3
/
2
+0.0, T= 1
984.25(10)
2647(3)
2987(2)
2970(8)
p
13077(2)
p
23871(9)
3846(10)
p
4p
3p
34123(16)
4094(2)
p
5p
4≈
4800
4760(4)
p
7p
6p
65507(10)
p
IVp
IV≈
5600
5604(5)
p
5p
55836(13)
p
IIIp
IIIp
V6266(30)
6273(7)
p
10p
9p
9p
7p
76498.4(5), T= 2
6496(3)
p
11p
10p
10p
8p
8≈
6770
6734(25)
p
I7183(16)
p
II4.1 Reconstruction of decay scheme
To reconstruct the decay scheme of 20Mg we have to un-derstand a few essential properties of the data presented in Sect. 3.1. First, we need to know the center-of-mass energy of the proton branches. Second, we need to un-derstand which decay branches contribute to the different proton peaks, as the energy resolution of the silicon detec-tors are larger than or comparable to the energy distance between the excited states in 19Ne.
The center-of-mass energy of the different decay branches have been reconstructed by an event-by-event routine, which uses the deposited energy in the detectors as a starting point. The energy reconstruction takes ad-vantage of the detailed knowledge of the geometry of the detector setup from the calibrations, see Sect. 2.3. Us-ing the SRIM stoppUs-ing power tables [21], it is possible to reconstruct the laboratory energy of each event. The con-version to center-of-mass energy is then straightforward, and we do this by assuming that all events are protons.
The center-of-mass energy of the proton peaks have been determined in all of the detectors, and a weighted average of the values is constructed. However, in many cases the proton peaks contain several decay branches. In order to determine the energy of the individual proton branches, we look at proton events in coincidence with the 238 keV and the 275 keV gamma-rays (see Fig. 6 (A) and (B)). When constructing these proton spectra we subtract a background spectrum (with the same energy width as the two gamma-ray gates), as there will be a contribution from the Compton continuum of the 511 keV gamma-ray. The number of counts in the produced proton spectra are in general low. This limits the precision of the determina-tion of the proton center-of-mass energy.
The next step is to quantify the content of the observed proton peaks, such that we know which decay branches are contained in the individual peaks and how the strength is to be distributed among the various branches. In order to do this we have constructed gamma-ray spectra in co-incidence with the individual proton peaks. From these gamma-ray spectra we make a classification of the proton peaks based on the ratio of the efficiency corrected number of gamma rays and the integrated number of protons. We conclude that p1and p11only contain ground state proton transitions. For pV, p6, p8, pIII, pIV and p9 we only ob-serve transitions to excited states. The remaining peaks, except for pI and pII, contain a mixture of transitions to
the ground state and excited states. For pI and pII we do
not obtain any conclusive result - more data are needed. Finally, we can combine the center-of-mass energies with the classification of the proton peaks to reach a de-cay scheme by assuming that no new states are to be in-troduced in 19Ne. In order to know which of the excited states in 19Ne are the final state of the proton emission, we use the systematics of the gamma-ray de-excitation of the excited states presented in Sect. 1. In the following we will go through the main ambiguities of the interpretation. The measured proton spectrum in Fig. 4 shows clear evidence for destructive interference between pI and pII,
which indicates that they populate the same final state in 19Ne. Due to their energy they have to be emitted from
resonances above the IAS. Looking for proton coincident gamma rays, we observe inconclusive signs of feeding to excited states in19Ne. However, we choose the simple in-terpretation that pI and pII only contain ground state
0.0, 1/2+ p+19
Ne
2.190 0.238, 5/2+
0.275 1/2−
1.508 5/2−
1.536, 3/2+ 1.616 3/2−
2.795 9/2+ 4.033 3/2+
20
Na
0.0 2+
0.984 1+
2.647, (1+ ,3+
) 2.970, 1+
3.077 (0+) 3.846, 1+
4.094 1+
4.760, 1+
5.507 1+ 5.604, 1 +
5.836, 1+
6.273 1+
6.496, 0+,IAS
6.734 1+
7.183 1+ 10.627
20
Mg 0+
2mec 2
β+
Fig. 9. (Color online) Decay scheme for the20Mg beta decay.
Only showing resonances populated in the beta decay. All en-ergies are with respect to the ground state of 20Na and the energies of the 20Na resonances are the energies determined in the present study. The different lines (orange dotted, blue dashed, green dashed, red dashed and solid black) correspond to proton decay branches to different final states in19Ne (4th excited state, 3rd excited state, 2nd excited state, 1st excited state, ground state).
20Na and a more precise energy for the 6770(100) keV
reso-nance as 6734(25) keV. The observed beta-delayed proton spectrum shows no evidence for the 6920(100) keV and the 7440(100) keV resonances, which were introduced in Ref. [5].
In the energy region between p8 and p9 we observe a broad structure visible in Fig. 4. Comparing with the pro-ton spectrum in Fig. 6, which has superior energy resolu-tion (27 keV versus 47 keV), we observe hints of two broad proton peaks (pIIIand pIV). However, looking at the
pro-ton spectra in coincidence with either the 238 keV or the 275 keV gamma-rays, we observe signs of several narrow resonances in the region (see Fig. 6). Unfortunately the correct explanation is unclear due to the small number of counts in the coincidence spectra. Therefore, we will make the simplest interpretation, which is the introduc-tion of two new broad resonances in20Na at 5507(10) keV and 5836(13) keV. The two proton peaks pIIIand pIV are
transitions to the first and second excited state in 19Ne from these resonances. The new proton peak pV fits as a
transition to the third excited state from the newly intro-duced 5836(13) keV resonance.
The final reconstruction of the decay scheme can be found in Fig. 9 and Table 2. The energy levels in19Ne are based on the most recent value of the proton separation energy of Sp(20Na) = 2190.1(1.1) keV from Ref. [6]. The
most recent measurement of the excitation energy of the IAS in 20Na [8] has moved the energy down by 25 keV to 6498.4(5) keV. We measure the position of the IAS to be at 6496(3) keV, which is in agreement with the updated value found in Ref. [8].
4.2 Interference patterns
[image:9.595.48.285.81.387.2]Allowed Gamow-Teller transitions from the 0+ ground state of 20Mg will feed 1+ states in 20Na while the al-lowed Fermi transition will feed the IAS which is a 0+ state. As a consequence, the delayed proton spectrum will show signs of interference between protons emitted from the 1+ states but not with the protons emitted from the IAS. These interference patterns must be consistent with the decay scheme presented in the previous section, where we propose that the following proton peaks are emitted by the IAS: p8, p10 and p11. These protons do not show signs of interference effects, which is clear when looking at Fig. 4 and 6, as the line shape of the peaks is symmetric. This supports the proposed decay scheme.
The remaining proton peaks are emitted from 1+states and are therefore expected to show signs of interference. From Fig. 4 it is clear that p4and p7interfere destructively at the energies in between the two peaks. As both contain intense decay branches to the ground state in19Ne this is to be expected. The line shape of p5 appears symmetric with no signs of interference, which can be explained by the low intensity ground state transition, see Tables 2, 3 and 4. As p6contains decay branches from the 4760(4) keV resonance and the main component of p7 is the ground state transition from this state, their line shapes can be understood partly in terms of the 4760(4) keV state being wide.
Looking at Fig. 6 we also observe clear signs of in-terference between pIV and pIII as well as between pIII
and p9- all of which populate the first and second excited states of 19Ne. Finally, we also observe a clear interfer-ence minimum between pI and pII, which is expected as
they both decay to the ground state of 19Ne. All of these observations support the decay scheme presented in the previous section.
4.3 Absolute beta-decay intensities
In order to determine the absolute intensities, we deter-mine the total number of collected20Mg ions by counting the number of 984 keV gamma-rays and the total number of protons observed. The 984 keV gamma-ray connects the first excited state with the ground state in 20Na and it is the only decay branch which populates bound states in 20Na. The branching ratio of the βγ decay through this
Part of the ions are implanted in a collimator upstream of the detection chamber. As a consequence we observe the gamma rays but not the charged particles emitted by these ions. Therefore, we must determine a correction fac-tor in order to obtain reliable absolute intensities. This is done by looking at the beta decay of 20Na, which has a 79.44(27)% branching ratio for populating the 1634 keV bound state in 20Ne [9] with the remaining decays be-ing beta-delayed alpha-particle emissions. By countbe-ing the alpha particles and the gamma rays and correcting for dead time and efficiencies, we obtain a branching ratio of 82.4(1.3)% to the 1634 keV bound state.
As a cross-check of the stability of the beam conditions, i.e. of the fact that we did implant a constant fraction of the beam in the collimator during the entire experiment, we looked at a subset of the data and determined the branching ratio to be Iβ(1634 keV) = 82.5(1.3)%. This
value is consistent with the value determined from the complete data sample, which means that the beam con-ditions did not change significantly over the course of the experiment.
Using the literature value and the measured value of Iβ(1634 keV) we construct a scaling factor to correct for
the implantation in the collimator. The scaling factor is given by Cγ = 7982.44%.4% = 0.964, i.e. a 3.6% correction. We
also have to apply a scaling factor to the proton branch-ing ratios, which we determine under the condition that the total branching ratio must equal 100%. This scaling factor is thus given byCp= 100%−Iβ(984 keV)Iβp ·Cγ = 1.109. The scaling of the branching ratios may not be completely perfect, and as a conservative estimate we put a 3.6% rel-ative systematic uncertainty on Iβ(984 keV) and a 11%
relative systematic uncertainty on the proton intensities. We will not combine this systematic uncertainty with the statistical uncertainties quoted in the rest of the paper.
To determine the number of 984 keV gamma rays mea-sured during the entire experiment, we use the sum of all four clover detectors as recorded by the digital daq. The digital daq system did not suffer from dead time making the extracted number of gamma rays more reliable. From a fit with the gamma-ray line shape function used in the ef-ficiency calculation, we deduce that 1.149(6)·105 gamma rays in the 984 keV photo-peak were observed. Correct-ing for the efficiency in Table 1 we get that a total of 6.51(6)·106 20Mg nuclei decayed through this channel.
To determine the total number of beta-delayed protons observed during the experiment, we use the 60µm front detector of telescope 1 and the 500µm back detector of telescope 4 (we observe consistent relative proton inten-sities when comparing the different detectors with each other). In the back detector we use the total number of events above p5(counting from the minimum between p5 and p6) and we correct for dead time (8.1%) and solid angle coverage (4.69(10)%). In the front detector we inte-grate the counts in the proton peaks p1, p4 and p5 and subtract an estimated background. Finally, we correct for dead time (9.3%) and solid angle coverage (5.19(12)%) in the front detector. The total number of proton events observed with this method is 2.14(5)·106.
The total number of 20Mg ions implanted into the setup thus becomes 8.65(8)· 106. Applying the scaling factor Cγ we obtain Iβ(984 keV) = 72.6(1.0)% with the
remaining intensity going into the βp decay mode. This branching ratio has previously been measured to be 69.7(1.2)% by Ref. [5], which agrees with the value ob-tained in the present work.
The absolute proton intensities for the proton peaks can now be determined from the number of events in the proton peak by correcting for the detector solid angle cov-erage, the dead time (8.1% for the pad detectors and 9.3% for the DSSSDs) and for the total number of 20Mg ions collected. However, for the front detectors of telescope 1 and 4 we have applied time gates (t <100 ms) to the data, which cut away a fraction of the20Mg events. To correct for this we investigated the20Mg time distribution shown in Fig. 8 and determined the fraction of events occurring during the first 100 ms to beR= 0.122(2). The obtained absolute intensities can be seen in Table 3.
When comparing the absolute intensities as measured with the different detectors, we generally have agreement to within two standard deviations. However, several ex-ceptions exist when comparing Iabs,iDSSSD, 3 with the other detectors. In most cases we observe lower branching ra-tios in this detector, which we can explain with a too large background subtraction due to a poor energy resolution of the detector (σ= 47 keV). Therefore we will not use the value of the absolute intensity measured in this detector for any of the proton peaks.
Having determined the absolute intensity of the indi-vidual proton peaks, the next step is to quantify how the intensity in the individual peaks is distributed among the final states in19Ne. Gating on the proton peaks, we look at the coincident gamma-ray spectrum and determine the ef-ficiency corrected number of 238 keV and 275 keV gamma rays. From the ratio of the number of gamma rays to the number of protons, we get the absolute intensity of the in-dividual decay branches in the proton peaks and the result can be seen in Table 4.
In Table 5 we present the measured absolute beta-decay intensity to the various levels in20Na on the basis of the decay scheme in Fig. 9 and the absolute intensities in Tables 3 and 4. The values for Iβ presented in the Table
are the weighted average of the values measured in the different detectors except the back detector of telescope 3. They are compared with the result of Ref. [5], and the two experiments in general give consistent results. How-ever, as a consequence of the introduction of the two new resonances at 5507(10) keV and 5836(13) keV, we observe a significant discrepancy in the beta-decay feeding of the 5604(5) keV resonance. For the IAS we measure a signifi-cantly lower beta-decay feeding than previously reported. Also, for several resonances we measure an absolute value ofIβ where the work presented in Ref. [5] only put lower
limits. Finally, it should be noted that we obtain a sig-nificant improvement in the knowledge of the beta-decay strength distribution above the IAS, as we put an abso-lute value on Iβ for the 6734(25) keV resonance and we
ob-Table 3.The absolute intensities of the individual proton peaks for the different detectors. Naming convention for the detectors is the detector type followed by the telescope no. according to Fig. 1. Remember the 11% relative systematic uncertainty on the proton intensities, which is not included in the quoted values.
Peak Iabs.,iDSSSD, 3(%) I DSSSD, 1
abs.,i (%) I DSSSD, 4
abs.,i (%) I pad, 4
abs.,i (%) I pad,1 abs.,i (%)
p1 10.7(4) 10.6(4)
p4 5.92(14) 6.8(2) 6.2(2)
p5 0.65(2) 0.58(6) 0.42(2)
pV 0.083(5) 0.107(6)
p6 0.40(2) 0.41(3)
p7 2.56(7) 2.91(7)
p8 0.22(2) 0.86(3)
pIV 0.92(3) 1.20(3)
pIII 0.98(3) 0.88(3)
p9 0.58(2) 0.54(2) 0.87(3)
p10 1.10(3) 1.13(3) 1.21(4)
p11 1.24(3) 1.21(3) 1.31(4)
pI 0.172(8) 0.336(13) 0.293(12)
[image:11.595.128.463.131.306.2]pII 0.082(5) 0.100(6) 0.060(5)
Table 4. Absolute beta-delayed proton emission branching ratios determined as the weighted average of all detectors except
the back detector of telescope 3. In a few cases we used a standard average value instead of the weighted average, and we estimated a value for the uncertainty due to inconsistency when comparing the intensities measured in the different detectors. These are marked with a⋆. Remember the 11% relative systematic uncertainty on the proton intensities, which is not included in the quoted values.
E
∗(
20Na) (keV)
19Ne resonances (MeV,
I
π)
This work
0.0, 1
/
2
+0.238, 5
/
2
+0.275, 1
/
2
−1.508, 5
/
2
−1.536, 3
/
2
+0.0, T= 1
984.25(10)
2647(3)
2987(2)
2970(8)
10.7(3)
3077(2)
p
23871(9)
3846(10)
4.7(3)
p
3p
34123(16)
4094(2)
0.28(4)
1.8(3)
≈
4800
4760(4)
2.2(2)
0.31(8)
0.69(10)
5507(10)
0.53(7)
0.45(8)
≈
5600
5604(5)
0.13(4)
0.03(2)
5836(13)
0.36(6)
0.08(2)
0.107(6)
6266(30)
6273(7)
0.7(3)
⋆
0.44(5)
0.24(15)
⋆
0.4(2)
0.32(9)
6498.4(5), T= 2
6496(3)
1.26(3)
0.3(2)
⋆
0.31(6)
0.10(3)
0.46(7)
≈
6770
6734(25)
0.313(9)
7183(16)
0.08(3)
⋆
serve signs of the previously proposed 6920(100) keV and 7440(100) keV resonances [5].
The total branching ratio for beta-delayed proton emis-sion is measured to be 27.2(7)% (p2 and p3not included) where we need to remember the 11% relative systematic uncertainty, which gives a total absolute uncertainty of 3.1%. This value is to be compared with the 26.9(3.2)% from Ref. [5]. The two values are consistent.
The log(f t)-values quoted in Table 5 are calculated with the parametrization of the phase space factor given in Ref. [26]. We use the measured value of the half-life presented in Sect. 3.2, T1/2 = 90.9(1.2) ms, and the
re-cently reported measurement of the Q-value in Ref. [8], QEC= 10627.1(2.3) keV, as input parameters. For the res-onance energies we use the values measured in the present experiment presented in Table 5. The determined log(f t )-values are in general consistent with the )-values given in Ref. [5]. In the case of the 5604(5) keV resonance we dis-agree significantly with [5]. However, this inconsistency can be explained by the introduction of the two new res-onances in20Na at 5507(10) keV and 5836(13) keV.
[image:11.595.46.546.378.607.2]rel-Table 5. Absolute beta-decay branching ratios and log(f t)-values for the individual resonances in 20Na determined as the weighted average of all detectors except the back detector of telescope 3. The present work is compared with Ref. [5]. Note that the absolute intensities of p2 and p3 are not included here. The resonance energies in20Na is the value measured in the present experiment. However, the resonances marked with a⋆are not observed here and the energy quoted is from Ref. [5]. The uncertainty on the log(f t)-values only comes fromIβ as it dominates. Remember the 3.6% relative systematic uncertainty for the 984.25(10) keV state and the 11% relative systematic uncertainty for the remaining states. These are not included in the quoted uncertainty values.
E∗(20Na) (keV) Iβ (%) log(f t)
This work This work Ref. [5] This work Ref. [5]
984.10(25) 72.6(1.0) 69.7(1.2) 3.777(14) 3.83(2) 2970(8) 10.7(3) 11.5(1.4) 4.07(3) 4.08(6)
3846(10) 4.7(3) 4.8(6) 4.26(6) 4.17(6)
4094(2) 2.1(3) 2.7(3) 4.52(14) 4.33(6)
4760(4) 3.2(2) ≥1.9 4.08(9) ≤4.23
5507(10) 0.98(11) 4.26(11)
5604(5) 0.16(4) ≥1.5 5.0(3) ≤3.97
5836(13) 0.55(6) 4.34(11)
6273(7) 2.1(4) 1.2(1) 3.5(2) 3.72(6)
6496(3), T= 2 2.4(2) 3.3(4) 3.32(8) 3.13(6) 6734(25) 0.313(9) ≥0.03 4.05(3) ≤5.01
6920(100)⋆ ≥0.01 ≤5.39
7183(16) 0.08(3) 4.3(4)
7440(100)⋆
≥0.01 ≤4.99
ative systematic uncertainty on Iβ(IAS)). This is to be
compared with the sum rule expectation given byPBF+− P
B−
F = Z −N = 4. The measured value is low
com-pared to the sum rule expectation, which points to the fact of unobserved strength to the IAS in the form of decay branches with an absolute intensity of about 1%. Possible unobserved decay modes could be alpha-particle emission and gamma-ray emission. We have not observed signs of any alpha particles from the decay of20Mg, how-ever, these would be very difficult to identify considering the amount of alpha particles observed from the decay of 20Na. Based on calculations made in ansd shell model [8],
it is expected that the main gamma decay of the IAS pop-ulates the 984 keV bound state. This branch is expected to be an order of magnitude more intense than any other gamma-ray decay branch from the IAS. By studying the observed gamma rays in the digital daq, we estimate that Iβγ(IAS → 984 keV) <0.4%. It means that the missing beta-decay strength to the IAS is only partly gamma-ray decays.
The mirror asymmetry parameterδ= (f t)+/(f t)−−1 can be computed for the mirror transitions20O→20F(3488 keV) and20Mg→20Na(2987 keV). Using log(f t)− = 3.65(6) from Ref. [27], we obtain a value ofδ= 1.63(7), which is consistent with the value obtained in Ref. [5].
4.4 Feeding of the 2647(3) keV resonance in 20Na
The resonance at 2647(3) keV in 20Na is located in the Gamow window of the 19Ne(p, γ)20Na reaction as dis-cussed in Sect. 1. Its spin and parity can be either 1+ or 3+, with the value of 3+ being favored on the basis
of the latest result, Iβp < 0.02% [7]. A 3+ assignment
is expected to lead to a significantly higher reaction rate than a 1+ assignment according to Ref. [7, 28]. The res-onance decays either by proton emission to the ground state of 19Ne with E
cm= 456 keV (b.r.≈90% [29]) or by gamma-ray de-excitation. The 2647(3) keV resonance will, according to Ref. [29], decay by emission of a 1847(6) keV gamma-ray to the 4+state at 798.56(6) keV when assum-ing a 3+ assignment. However, assuming a 1+assignment of the resonance, it will decay by emission of a 1613(6) keV gamma-ray to the 1− state at 1031.9(7) keV [29].
A search for the beta-delayed proton branch from this resonance is difficult with the available data, due to the large background at low energies from the decay of 20Na - this is clear when looking in Fig. 5 where the16O recoils makes it impossible to determine an improved value on the branching ratio limit. Instead we investigate whether we have observed any signs of feeding in the gamma-ray spectrum. Based on the number of collected 20Mg ions, the present upper limit of Iβp(2647 keV) < 0.02% and
the expected branching ratio of roughly 10% [29], we es-timate that fewer than 160 gamma-ray decays, in either Iπ-scenario, occurred during the experiment. Considering
[image:12.595.160.430.175.365.2]4.5 Search for beta-delayed proton decays to the 4032.9(2.4) keV resonance in 19Ne
The 4032.9(2.4) keV resonance in 19Ne is located in the Gamow window of the15O(α, γ)19Ne reaction, and it can be fed by beta-delayed proton emission from 20Mg. As discussed in Sect. 1, it is important to measure directly the branching ratio for alpha-particle emission from this resonance, which is expected to be roughly 10−4 [13, 14]. However, the 4032.9(2.4) keV resonance will mainly de-cay by emission of a 4.03 MeV gamma ray to the ground state. As gamma-ray emission is much more likely than alpha-particle emission, it makes sense first to establish feeding of the 4032.9(2.4) keV resonance by detecting the 4.03 MeV gamma ray. Then we can search for the alpha-particle emission if it is feasible.
The total gamma-ray spectrum as measured with the digital daq is shown in Fig. 10, and it shows no sign of the 4.03 MeV gamma ray. However, we can estimate an upper limit on the feeding of the resonance by model-ing the line shape of the photo-peak from a 4.03 MeV gamma ray. Using the same line shape function as used in the efficiency calibration, we estimate the Gaussian width σby fitting the 3333 keV gamma ray from the de-cay of 20Na, and we estimate a +3 keV systematic offset on the centroid from this fit. Then we fit the spectrum close to 4 MeV with a linear function to describe the back-ground contribution. Using the obtained parameters, we can then model the 4.03 MeV gamma-ray photo-peak as-suming various number of events in the peak. The number of events is translated to an intensity through the total absolute gamma-ray efficiencyǫ(4.03 MeV) = 0.587(13)% (the value is based on Eq. 1) and the total number of collected20Mg ions (8.65(8)·106). The final upper limit is estimated to be Iβp < 0.6%. Assuming that the
branch-ing ratio for alpha-particle emission is 10−4, this upper limit corresponds to roughly 5 alpha particles being emit-ted from the 4032.9(2.4) keV resonance during the exper-iment. However, considering the amount of beta-decay strength identified as going to the resonances above the IAS in20Na (I
β= 0.39(3)%), we expect a somewhat lower
feeding of the 4032.9(2.4) keV resonance. As a consequence it is not feasible to search for the emitted alpha particle with the present data.
A search focused on identifying beta-delayed proton branches feeding the 4032.9(2.4) keV resonance is strongly hindered by their expected center-of-mass energies for the IAS and the two levels above it: 273 keV (IAS), 511 keV (6734 keV) and 960 keV (7183 keV). The low energy pro-ton spectrum was presented in Fig. 5, and it has a large background component from16O.
5 Summary and conclusions
Beta-delayed proton emission has been measured at the ISOLDE facility with a close geometry silicon detector ar-ray including angular resolution and high efficiency, and surrounded by an array of four HPGe clover detectors.
E (keV)
3990 4000 4010 4020 4030 4040 4050
Counts / 1 keV
1080 1100 1120 1140 1160 1180 1200 1220 1240 1260
1280 Iβ p < 0.5%
< 0.6%
p
β I
< 0.7%
p
β I
< 0.8%
p
[image:13.595.303.533.106.262.2]β I
Fig. 10. (Color online) Total gamma-ray spectrum around
4 MeV as observed in the digital daq. Based on the line shapes drawn in the figure (solid lines with different colors) with vary-ing intensities (Iβp), we estimate an upper limit of the beta-decay feeding of the 4032.9(2.4) keV resonance.
Several results have been extracted from the observed pro-ton and gamma-ray spectra:
– The half-life of20Mg has been measured to beT 1/2= 90.9(1.2) ms, which improves on the previous value of 90(6) ms [1].
– Seven new beta-delayed proton branches have been ob-served out of 26 beta-delayed proton branches in total. The delayed proton spectrum covers energies between 0.8 and 5.0 MeV.
– Three new resonances have been introduced above the proton separation energy in20Na: 5507(10) keV, 5836(13) keV and 7183(16) keV.
– The measured resonance energy of the IAS, 6496(3) keV, agrees well with the recent measurement in Ref. [8] of 6498.4(5) keV. Hence we confirm the recent revalida-tion of the IMME for theA= 20 quintet, which follows from this result.
– More precise resonance energies have been obtained for the 4760(4) keV, 5604(5) keV and 6734(25) keV res-onances.
– The Fermi strength to the IAS has been measured to beBF = 2.9+0−0..65(not including the 11% systematic un-certainty) which is lower than the sum rule prediction (BF = 4).
– Absolute beta-decay intensities have been measured for the 4760(4) keV, 5604(5) keV and 6734(25) keV res-onances.
– Observed feeding to two resonances above the IAS, which makes it possible for beta-delayed proton emis-sion to feed the 4032.9(2.4) keV resonance in 19Ne. The resonance is important for determining the 15O(α, γ)19Ne reaction rate. However, at the present
level of sensitivity we see no sign of feeding to the 4032.9(2.4) keV state (Iβp<0.6%).
– No evidence is observed for the previously proposed 6920(100) keV and 7440(100) keV resonances.
Based on these findings an updated decay scheme for20Mg has been presented in Fig. 9 and in Table 2.
This work has been supported by the European Com-mision within the Seventh Framework Programme ”Eu-ropean Nuclear Science and Applications Research”, con-tract no. 262010 (ENSAR), by the Spanish research agency under number FPA2012-32443 and FPA2015-64969-P and by the Romanian IFA Grant CERN/ISOLDE. The au-thors also acknowledge the support of the Danish Natural Science Research Council, the United Kingdom Science and Technology Facilities Council and the German BMBF under grants 05P12PKFNE and 05P15PKCIA.
References
1. G. Audi et al., Chin. Phys. C36, 1157 (2012).
2. B. Blank and M. J. G. Borge, Prog. Part. Nucl. Phys.60, 403 (2008).
3. M. Pf¨utzner, L.V. Grigorenko, M. Karny, and K. Riisager, Rev. Mod. Phys. 84, 567 (2012).
4. M. J. G. Borge, Phys. Scr.T152, 014013 (2013).
5. A. Piechaczek, M.F. Mothar, R. Anne, V. Borrel, B.A. Brown, J.M. Corre, D. Guillemaud-Mueller, R. Hue, H. Keller, S. Kubono, V. Kunze, M. Lewitowicz, P. Magnus, A.C. Mueller, T. Nakamura, M. Pf¨utzner, E. Roeckl, K. Rykaczewski, M.G. Saint-Laurent, W.-D. Schmidt-Ott, and O. Sorlin, Nuclear Physics A584, 509 (1995).
6. C. Wrede, J.A. Clark, C.M. Deibel, T. Faestermann, R. Hertenberger, A. Parikh, H.-F. Wirth, S. Bishop, A.A. Chen, K. Eppinger, A. Garcia, R. Kr¨ucken, O. Lepyoshkina, G. Rugel and K. Setoodehnia, Phys. Rev. C81, 055503 (2010). 7. J.P. Wallace, P.J. Woods, G. Lotay, A. Alharbi, A. Banu, H.M. David, T. Davinson, M. McCleskey, B.T. Roeder, E. Simmons, A. Spiridon, L. Trache, and R.E. Tribble, Phys. Lett. B712, 59 (2012).
8. B.E. Glassman, D. P´erez-Loureiro, C. Wrede, J. Allen, D.W. Bardayan, M.B. Bennett, B.A. Brown, K.A. Chipps, M. Febbraro, C. Fry, M.R. Hall, O. Hall, S.N. Liddick, P. O’Malley, W. Ong, S.D. Pain, S.B. Schwartz, P. Shidling, H. Sims, P. Thompson and H. Zhang, Phys. Rev. C92, 042501 (2015).
9. D.R. Tilley, C.M. Cheves, J.H. Kelley, S. Raman and H.R. Weller, Nucl. Phys. A636, 249 (1998).
10. D.R. Tilley, H.R. Weller, C.M. Cheves and R.M. Chasteler, Nucl. Phys. A595, 1 (1995).
11. C. Illiadis,Nuclear Physics of Stars, WILEY-VCH, 2007. 12. B. Davids, R.H. Cyburt, J. Jos´e and S. Mythili , Astrophys.
J.735, 40 (2011).
13. C. Wrede, PoS (NIC XIII), 039 (2014).
14. W.P. Tan, J.L. Fisker, J. G¨orres, M. Couder and M. Wi-escher, Phys. Rev. Lett.98, 242503 (2007).
15. M.V. Lund, PhD thesis, Aarhus University, Denmark, 2016 (http://cds.cern.ch/record/2153139).
16. E. Kugler, Hyperfine Interact.129, 23 (2000).
17. V.N. Fedoseyev, G. Huber, U. K¨oster, J. Lettry, V.I. Mishin, H. Ravn, V. Sebastian, Hyperfine Interact.129, 409 (2000).
18. Richard G. Sextro, R. A. Gough, and Joseph Cerny, Phys. Rev. C8, 258 (1973).
19. M.V. Lund, M.J.G. Borge, J.A. Briz, J. Cederk¨all, H.O.U. Fynbo, J.H. Jensen, B. Jonson, K.L. Laursen, T. Nilsson, A. Perea, V. Pesudo, K. Riisager, and O. Tengblad, Phys. Lett.
B750, 356 (2015).
20. M.V. Lund, M.J.G. Borge, J.A. Briz, J. Cederk¨all, H.O.U. Fynbo, J.H. Jensen, B. Jonson, K.L. Laursen, T. Nilsson, A. Perea, V. Pesudo, K. Riisager, and O. Tengblad, Eur. Phys.
J. A51, 113 (2015).
21. J. F. Ziegler, J. P. Biersack, and M. D. Ziegler, SRIM
-The Stopping and Range of Ions in Matter, 5th ed. (SRIM
Co., USA, 2008).
22. The Lund/LBNL Nuclear Data Search, WWW Table of Radioactive Isotopes, Version 2.0, February 1999.
23. F. James and M. Winkler, Minuit User’s Guide, CERN, Geneva, 2004.
24. U. C. Bergmann and K. Riisager, Nucl. Phys. A701, 213c (2002).
25. J.P. Wallace and P.J. Woods, Phys. Rev. C 86, 068801 (2012).
26. D. H. Wilkinson and B. E. F. Macefield, Nucl. Phys. A 232, 58 (1974).
27. D.E. Alburger, G. Wang and E.K. Warburton, Phys. Rev.
C35, 1479 (1987).
28. H.T. Fortune, R. Sherr and B.A. Brown, Phys. Rev. C61, 057303 (2000).


![Table 2. The 20Na energies E∗(20Na) are taken from Ref. [5,7–9,25]. Three previously unobserved resonances in 20Na havebeen introduced at 5507(10) keV, 5836(13) keV and 7183(16) keV](https://thumb-us.123doks.com/thumbv2/123dok_us/7864243.180769/8.595.47.535.129.360/table-energies-taken-previously-unobserved-resonances-havebeen-introduced.webp)