This is a repository copy of Blood transcriptomes and de novo identification of candidate loci for mating success in lekking great snipe (Gallinago media).
White Rose Research Online URL for this paper: http://eprints.whiterose.ac.uk/119649/
Version: Accepted Version
Article:
Höglund, J., Wang, B., Saether, S.A. et al. (7 more authors) (2017) Blood transcriptomes and de novo identification of candidate loci for mating success in lekking great snipe (Gallinago media). Molecular Ecology, 26 (13). pp. 3458-3471. ISSN 0962-1083 https://doi.org/10.1111/mec.14118
[email protected] https://eprints.whiterose.ac.uk/
Reuse
Items deposited in White Rose Research Online are protected by copyright, with all rights reserved unless indicated otherwise. They may be downloaded and/or printed for private study, or other acts as permitted by national copyright laws. The publisher or other rights holders may allow further reproduction and re-use of the full text version. This is indicated by the licence information on the White Rose Research Online record for the item.
Takedown
If you consider content in White Rose Research Online to be in breach of UK law, please notify us by
1
Blood transcriptomes and de novo identification of candidate loci for mating
1success in lekking great snipe (Gallinago media)
23
Jacob Höglund1, Biao Wang1, Stein Are Sæther3, Mozes Pil Kyu Blom123, Peder Fiske3, Peter 4
Halvarsson1, Gavin J. Horsburgh4, Terry Burke4, John Atle Kålås3, Robert Ekblom1,4 5
6
1) Department of Ecology and Genetics, Evolutionary Biology Centre, Uppsala 7
University, Norbyvägen 18D, SE-75236 Uppsala, Sweden 8
2) Division of Evolution, Ecology and Genetics, Research School of Biology, The 9
Australian National University, Canberra, ACT 0200, Australia 10
3) Norwegian Institute for Nature Research (NINA), PO Box 5685 Sluppen, 7485 11
Trondheim, Norway 12
4) Department of Animal and Plant Sciences, University of Sheffield, Sheffield S10 13
2TN, UK 14
Address for correspondence: 15
J. Höglund, Dept of Ecology and Genetics, Uppsala University, Norbyv 18D, SE-75236, 16
Uppsala Sweden 17
+46-18-4712671, +46-70-4250126 19
20 21
2016-11-25 22
2
Abstract
24
We assembled the great snipe blood transcriptome using data from fourteen lekking males, in 25
order to de novo identify candidate genes related to sexual selection, and determined the 26
expression profiles in relation to mating success. The three most highly transcribed genes 27
were encoding different haemoglobin subunits. All tended to be overexpressed in males with 28
high mating success. We also called Single Nucleotide Polymorphisms (SNPs) from the 29
transcriptome data and found considerable genetic variation for many genes expressed during 30
lekking. Among these we identified 14 polymorphic candidate SNPs that had a significant 31
genotypic association with mating success (number of females mated with) and/or mating 32
status (mated or not). Four of the candidate SNPs were found in HBAA (encoding the 33
haemoglobin -chain). Heterozygotes for one of these and one SNP in the gene PABPC1 34
appeared to enjoy higher mating success compared to males homozygous for either of the 35
alleles. In a larger dataset of individuals we genotyped 38 of the identified SNPs but found 36
low support for consistent selection since only one of the zygosities of previously identified 37
candidate SNPs and none of their genotypes were associated with mating status. However, 38
candidate SNPs generally showed lower levels of spatial genetic structure compared to non-39
candidate markers. We also scored the prevalence of avian malaria in a sub-sample of birds. 40
Males infected with avian malaria parasites had lower mating success in the year of sampling 41
than non-infected males. Parasite infection and its interaction with specific genes may thus 42
affect performance on the lek. 43
3
Introduction
45
How genetic variation for female preferences of male traits is maintained has been a long-46
standing issue in evolutionary biology (Hamilton and Zuk 1982; Andersson 1994) and is 47
related to the more general problem of how genetic variation is upheld in natural populations 48
(reviewed by Hedrick and Kim 1975; Radwan 2008). Leks are mating systems with a high 49
potential for intense sexual selection which have played a pivotal role in sexual selection 50
studies (e.g. Höglund and Alatalo 1995; Shorey et al. 2000; Ryder et al. 2010; Alonso et al. 51
2010; DuVal 2013). In most lek species males defend small aggregated non-resource based 52
territories that females visit for the sole purpose of mating, after which the females leave and 53
raise the offspring on their own without the aid of the male partner(Höglund and Alatalo 54
1995). Male mating success is typically highly skewed and thus only a fraction of the males 55
reproduce during any given mating season (Höglund and Alatalo 1995). The lek mating 56
behaviour of males is commonly physically and energetically costly, signified by intense 57
fighting and display behaviour (Vehrencamp et al. 1989; Höglund et al. 1992). Intrasexual 58
selection is generated by male-male competition for access to territories and fertilisable 59
females, while intersexual selection is generated by female choice for certain kinds of males 60
(Darwin 1871; Andersson 1994). Both of these forms of selection are prevalent and intense in 61
lek-mating species, since male territory defence and combat is readily observed and females 62
are relatively free to choose among the males(Höglund and Alatalo 1995). Furthermore, any 63
benefit of female mate choice is likely indirect and mediated by genetic effects, since lekking 64
males, by definition, provide no resources but the sperm necessary for successful fertilisation 65
of the eggs (Höglund and Alatalo 1995). Thus, with the exception of avoiding sexually 66
transmitted disease, female preferences cannot be based on immediate material benefits nor 67
parental care considerations. Given that just a few males get most of the matings, this sets the 68
scene for the so-called lek paradox. In this paper we attempt at identifying candidate genes for 69
sexual selection in lekking great snipe (Gallinago media) using transcriptome sequencing to 70
study genetic varaiation at such loci. 71
72
The lek paradox is founded on the expectation that sexual selection favours certain kinds of 73
males (strong directional selection on male phenotypes) and that part of this selection is due to 74
female choice. Given that strong directional selection should lead to fixation of the genetic 75
variation coding for the favoured traits, how is it that females are still selective? Thus the 76
4
deplete the genetic variation and therefore, in turn, relax or eliminate the original basis of the 78
female preference (Borgia 1979; Taylor and Williams 1982; Kirkpatrick and Ryan 1991). 79
Since the formulation of the paradox, there have been numerous suggestions on how it might 80
be solved (Rowe and Houle 1996; Tomkins et al. 2004; Miller and Moore 2007, Fromhage et 81
al. 2009; Greenfield et al. 2012). Spatio-temporal variation in selection has for example, been 82
suggested as one of the mechanisms which may uphold genetic variation for sexually selected 83
traits (reviewed by Radwan 2008). However, to date, empirical studies addressing these issues 84
remain scarce (Kotiaho et al. 2001; 2008, Cornwallis and Uller 2012), partly because it is 85
often unclear which traits, if any, are favoured by females in lekking species. It is therefore of 86
pivotal importance to identify candidate genes subjected to sexual selection in lekking species 87
in the wild. 88
89
Transcriptome sequencing (also known as RNA-seq) of phenotyped individuals is one method 90
which would allow for identification of candidate loci for sexual selection. First, this will 91
highlight genes which are expressed at high levels in males when they are competing and 92
females are selective (i.e. the lekking period). Second, it will be possible to identify genes 93
differentially expressed among males with varying mating success. Third, it will also reveal 94
sequence data from which functional genotype information on the studied individuals can be 95
extracted. This in turn will allow de novo identification of candidate genes that have sequence 96
variation co-segregating with mating success (Pardo-Diaz et al. 2015). If genetic 97
polymorphism is found for such candidate genes related to mating success, this calls for 98
further in-depth studies examining how this variation is maintained in the population (i.e. 99
solving the lek-paradox). Genotyping of a different set of individuals could, for example, be 100
used to examine temporal and spatial variation in selection regimes and/or possible 101
covariation with levels of parasitism. 102
103
In lekking great snipe, we have previously shown that males with more centrally located 104
territories which are more active in display are more often involved in mating (Höglund and 105
Lundberg 1987). Females are often polyandrous and may mate repeatedly with the same male 106
(Fiske and Kålås 1995; Sæther et al. 2001). Studies of individually marked females suggest 107
that the relationship between the centrality on the lek of a male’s territory and mating success 108
is more complex than a direct female preference for central males (Höglund and Robertson 109
5
males able to sustain the energetically demanding lekking behaviour (Kålås et al. 1995; 111
Sæther et al. 2000). This interpretation has been supported by direct measurements of the 112
energetic costs of male display using doubly labelled water to estimate energy consumption 113
which show that male lekking behaviour is indeed energetically costly (Höglund et al. 1992). 114
Furthermore, studies of male immune response (Ekblom et al. 2005) and Major 115
Histocompatibility Complex (MHC) genotyping (Ekblom et al. 2004; 2009) suggest that there 116
might be sexual selection for immunocompetence (Folstad and Karter 1992), parasite 117
resistance (Hamilton and Zuk 1982) and particular MHC genotypes that may be linked to 118
health status (Ekblom el al. 2004, 2009). Great snipes also perform extraordinary annual 119
migrations from their African winter grounds to the breeding areas. Males have been shown to 120
fly more or less in one go at high speed and altitude (Lindström et al. 2016). Being able to 121
perform energetically demanding behaviour may thus be important in this species during 122
other parts of the year and not only in the mating period. 123
124
In order to determine expression profiles of genes transcribed during episodes of mate choice, 125
we sequenced the transcriptomes (RNA-Seq) of peripheral blood cells from male great snipe 126
caught during lekking. The main aim was to identify candidate genes for sexual selection, and 127
in particular to find sequence variation related to the probability of mating. We thus compared 128
gene expression between males with different mating success. We also called SNPs from the 129
transcriptome data, and tested for associations between mating success (number of females 130
mated with) or mating status (mated or not) and SNP genotype in this same sample of birds. 131
Finally, we wanted to investigate the selective mechanisms maintaining genetic variation for 132
such genes in the population. To address this, we tested if a subset of candidate and non-133
candidate SNPs were correlated with mating status in a larger data set consisting of males 134
studied during several years, and investigated spatial and temporal genetic variation across 135
different loci. Avian malaria is known to have detrimental effects in other birds, and that it is 136
likely that snipe also have it. In this larger data set, we also studied associations between 137
parasite prevalence and SNP genotypes by scoring the prevalence of avian malaria. 138
139
Methods
140
Sampling and sequencing 141
Fieldwork for the RNA-seq study was conducted during the spring of 2010 in Gåvålia (62º 142
6
great snipe leks in the study area were followed during the main mating period in May and 144
June. At the onset of the breeding season, displaying birds attending the leks were captured 145
using mist nets and individually marked using coloured plastic rings (see Løfaldli et al. 1992). 146
Birds were sexed and blood samples were taken from the brachial vein and stored in 147
RNAprotect Animal Blood Tubes (Qiagen). Behavioural observations were made each night 148
during the mating season by two to four trained observers per lek, and the mating success of 149
individual males (minimum number of females mated, or soliciting mating, with the male 150
during the entire field season) was estimated using our previously described approach (Fiske 151
and Kålås 1995; Sæther et al. 2000). Only males observed in detail for at least 5 days during 152
the mating season were assigned mating success. 153
154
RNA was extracted from blood samples of 14 individual males with known mating success 155
using RNeasy Protect Animal Blood Kit (Qiagen) and cDNA was synthesised using the 156
MINT kit (Evrogen). cDNA was purified through QIAquick PCR purification columns 157
(Qiagen) and diluted to a concentration of 100 ng/µ L (measured on a Nanodrop, Thermo 158
Scientific). Tagged sequencing libraries of each individual were prepared and sequenced on 159
one full plate of GS FLX Titanium (Roche 454) at the Uppsala SNP&SEQ Technology 160
Platform (www.sequencing.se). The 454 plate was divided into two sections, and 7 161
individuals with tags were pooled in each section, respectively. The raw sequencing reads 162
have been placed in the NCBI Sequence Read Archive (SRA) under accession number 163
SRA060814. 164
165
A de-novo assembly of the great snipe transcriptome, utilising data from all individuals 166
simultaneously, was conducted with the default parameters (minimum read length = 20 bp, 167
minimum overlap length = 40 bp, minimum overlap identity = 90%) of the 168
cDNA/transcriptome algorithm implemented in gsAssembler (Newbler, version 2.6, 454 Life 169
Sciences). Prior to assembly, the multiplex identifiers used to discern between individual 170
libraries, as well as sequencing adaptors, were removed and reads were quality-filtered using 171
default settings in Newbler. To trim away the cDNA synthesis primers, a separate file 172
containing the primer sequences was entered into the trimming database. We used the 173
‘cDNA’ mode of gsAssembler, which generated two types of results: one was contigs, i.e. the 174
assembled sequences split by the inferred alternative splicing sites, equivalent to the exons; 175
7
the transcript isoforms. The program used isogroups to classify the contigs and isotigs that 177
were from the same inferred genes. All computations were performed using the computational 178
resources provided by SNIC through Uppsala Multidisciplinary Center for Advanced 179
Computational Science (Uppmax). 180
181
Assembled contigs, isotigs and the singletons larger than 100 bp were functionally annotated. 182
Inferences on their functional properties were first made by conducting BLAST searches 183
(BLAST 2.2.24+; Altschul et al. 1997) of the isotigs and size-filtered singletons. The 184
functional annotation of the contigs was then obtained by their correspondent isotigs through 185
the isogroup identifiers. The BLASTX program with an e-value cut-off of 10e-10 was used to 186
ensure the quality of the analysis. The BLAST search was performed against both the chicken 187
(Gallus gallus) genes (WASHUC2) International Chicken Genome Sequencing Consortium 188
and the zebra finch (Taeniopygia guttata) genes (taeGut3.2.4)(Warren et al. 2010). The 189
BLAST databases were downloaded from the Ensembl server through BioMart (Hubbard et 190
al. 2002, Smedley et al. 2009). A list of annotated genes and their corresponding expression 191
levels can be found in Supplementary Information Table S1. 192
193
Gene expression analyses 194
To investigate gene expression levels, each individual sequencing library was mapped back to 195
the isotigs generated from the assembly. Since some singletons might be from the same genes 196
as the isotigs, but were not assembled because of low sequencing coverage, all the singletons 197
with annotation information were also included in the mapping reference file. The mapping 198
was conducted by gsMapper (Newbler, version 2.6, 454 Life Sciences) with ‘cDNA’ mode 199
and its default parameter settings (minimum read length = 20 bp, minimum overlap length = 200
40 bp, minimum overlap identity = 90%). Reads that mapped to alternative splice variants of 201
the same gene were only counted once and reads that mapped equally well to two or more 202
genes were removed. 203
204
Statistical analyses and handling of large datasets were performed using R 2.15 and later 205
versions (R-core team 2014). Information on the individual males included in the 206
transcriptome analyses can be found in Table S2. Read counts per each gene and individual 207
were extracted from the mapping results. Genes that were only expressed in single 208
8
count libraries. Differential gene expression analyses were conducted using the 210
R/Bioconductor (Gentleman 2004) and edgeR (Robinson and Oshlack 2010) packages. 211
Normalization of the read counts is critical when comparing gene expression between 212
treatments or groups, since it adjusts for overall RNA population differences between the 213
samples (Robinson et al. 2010). For the edgeR analysis, normalization across all samples was 214
performed using the Trimmed Mean of M values (TMM) protocol. Dispersion estimation was 215
calculated based on all the genes jointly. False discovery rate (FDR) correction (Benjamini & 216
Hochberg 1995) was applied to control for multiple testing. We tested for an association 217
between mating success (number of females mated) and normalised gene expression levels 218
using Spearman rank correlations. 219
220
Identification of genotypes associated with mating success 221
To identify SNPs in the transcript sequences, reads from all individuals were mapped to the 222
contigs using gsMapper with the ‘cDNA’ mode and its default settings. High-confidence 223
SNPs were extracted applying the stringency criteria of: coverage ≥ 10, minor allele 224
frequency (MAF) ≥ 5%, and coverage of minor allele ≥ 3, to guarantee the quality of the SNP
225
calling. The sequencing data for each individual were then mapped back onto the assembled 226
contigs to estimate the SNP genotypes for each individual using gsMapper. For the SNP 227
genotypes of each individual, only those from the known SNP panel were kept, and further 228
criteria of coverage ≥ 5, minor allele frequency (MAF) ≥ 5%, and coverage of minor allele≥
229
2 were applied. Since the homologous SNP sites were not reported in the SNP variants 230
analysis, we examined the mapping quality and coverage of the known SNP sites for each 231
individual and accepted the ones with a mapping quality ≥ 10 and a coverage*MAF ≥ 5 as 232
homologous SNPs. 233
The effect on mating success of the genotype for each SNP were tested with Generalized 234
Linear Models, fitted with a Poisson error distribution and a log link function (PGLM). In 235
order to investigate the congruence between candidate genes from the gene expression 236
analysis and the genotype associations, the effect sizes from this model (deviance explained, 237
D2Adjusted, adjusted for the number of fitted regression parameters and the number of
238
observations, Weisberg 1980, Guisan and Zimmermann 2000) for each locus were plotted 239
against the coefficient from the correlation between mating success and individual gene 240
9
dataset were set to 0.01 in order to limit the number of false positives. We also investigated 242
genetic differentiation between mated and unmated males (mating status) using the 243
‘population differentiation’ option in GenePop (http://genepop.curtin.edu.au/) (Raymond and 244
Rousset 1995), testing for both genic differentiation (differences in allele frequencies) and 245
genotypic differentiation (differences in allele combinations) for each locus separately using 246
the G-tests. Candidate SNPs were defined as loci with a significant association in at least one 247
of these comparisons (Table 1) all other SNPs were treated as non-candidates. The genotype 248
data is available at Dryad (http://datadryad.org/review?doi=doi:10.5061/dryad.p42r8). 249
250
Testing the effects of the candidate SNPs in a larger data set 251
In order to validate the candidate genes for mating success identified from the RNA-Seq data 252
and to investigate patterns of spatial and temporal genetic structure, we submitted 48 SNP 253
markers (including both candidates and non-candidates, as inferred from the analyses on 254
genotype and mating success and/or mating status) for multiplex genotyping using the 255
Illumina Golden Gate assay available at the SNP & SEQ Technology Platform at Uppsala 256
University (www.genotyping.se). 38 of these yielded reliable genotype scores and were 257
polymorphic in the genotyped individuals. Markers were chosen from polymorphic positions 258
in the transcriptome data based on Illumina design scores. Primers for multiplex genotyping 259
were designed for SNPs flanked by regions of, at least, 100 bp on both sides. Information on 260
SNP markers including flanking sequences can be found in Supplementary Information Table 261
S3. To avoid pseudo replication and year effects when testing for effects of genotype on 262
mating success we only entered individual males once in any analysis, and transformed yearly 263
mating success to lifetime mating status (“1” = >0 matings and “0” = no observed matings). 264
We obtained genotypes for seven of the candidate loci listed in Table 1 and for 31 non-265
candidate loci, and analysed if the genotype or zygosity of SNPs were associated with mating 266
status (mated or not) using likelihood tests (G-tests) of the contingency tables, and using 267
GenePop tests for genetic differentiation (as described above). This data set consisted of 130 268
males caught and studied at the Gåvålia site during the mating seasons of 1994-2002 (see 269
Fiske and Kålås 1995; Sæther et al. 2000, Sæther et al. 2005). The genotype data for this and 270
the below analyses is available at Dryad 271
(http://datadryad.org/review?doi=doi:10.5061/dryad.p42r8). 272
273
10
If genetic variation for sexually selected traits are upheld by spatially or temporally varying 275
selection pressures we should be able to observe this as increased genetic population structure 276
or temporal variation for selected loci compared to neutral loci. If on the other hand balancing 277
sexual selection is acting across time and space we would expect decreased structure in the 278
selected SNPs. We thus examined spatio-temporal population genetic structure of both 279
candidate and non-candidate markers (as defined from the analysis of the RNA-Seq 280
genotypes; Table 1), by genotyping 304 birds caught at 10 sites in Norway, Sweden (7 sites) 281
and Poland/Estonia (3 sites) during 1994–2002, (see Ekblom et al. 2007, Sæther et al. 2007 282
for details) for genetic variation at the same 38 loci as above. Except for the males caught at 283
the main site (Gåvålia) in Norway, we had no data on mating status of these birds. 284
285
In order to identify marker specific signatures of selection (Storz 2005, Beaumont 2005) we 286
ran outlier analyses using the software LOSITAN (Antao et al. 2008), and tested for outlier 287
loci with respect to spatial population structure (deviant FST among regions, East (Poland,
288
Estonia East and Estonia West) and West (the Scandinavian sites), and temporal structure by 289
analysing two time periods (early: 1994–98 and late: 1999–2002). A few males whose 290
lifespan encompassed both time periods were ascribed to the first period. 291
292
To further explore spatial and temporal structure we used part of the code of the R package 293
ADEGENET (Jombart 2008) to create PCA plots to illustrate the multidimensional 294
relationships between each individual genotype in two dimensional plots (PC1 vs. PC2). 295
These analyses were done for spatial structure by examining regional (East vs. West) and 296
temporal differences (Early vs. Late) for both candidate and non-candidate loci, respectively. 297
We also examined the corresponding differentiation by calculating FST (with 95% confidence
298
limits determined by 1000 bootstrap replicates over individuals) among these “populations” in 299
the R package Hierfstat (Goudet and Jombart 2015). We furthermore ran corresponding 300
STRUCTURE analyses with 100,000 burn-in followed by 1,000,000 chains for K = 1–10, 301
with 10 repetitions for each K using the admixture model with loc prior option. We ran 302
separate analyses using candidate and non-candidate SNPs respectively in STRUCTURE 303
2.3.4. (Pritchard et al. 2000) and used the R package POPHELPER v1.2.0 (Francis 2016) to 304
extract the relevant data from all STRUCTURE output files and plotted the posterior estimate 305
11
each K was summarised using the software CLUMPP (Jakobsson and Rosenberg 2007) and 307
visualised using POPHELPER. 308
309 310
Parasite prevalence 311
In the same larger data set, we examined associations between parasites and SNP genotypes 312
by scoring the prevalence of avian malaria using a nested-PCR protocol. More specifically we 313
scored the prevalence of Plasmodium/Haemoproteus and Leucocytozoon infections for all 314
birds caught in 1994–2002. The external primer pair HaemNFI/ HaemR2L (Bensch et al. 315
2000) was used to amplify a part of the haemosporidian mtDNA cyt b gene. The PCR 316
included 0.125 mM of each dNTP, 1.5 mM MgCl2, 10x NH4 buffer, 0.6 µM of each primer, 317
0.1 units of Biotaq DNA polymerase (Bioline, Luckenwalde, Germany) and 1 µl gDNA in a 318
10-µl reaction. Detecting avian malaria of the genera Plasmodium and Haemoproteus was 319
done with the primer pair HaemF/HaemR2 (Hellgren et al. 2004) and Leucocytozoon with 320
primer pair Haem FL/HaemR2L (Bensch et al. 2000). The external PCR product was used as 321
a template for the internal PCRs. The internal PCRs had the same composition as the external 322
PCR, but for Leucocytozoon 0.125 units of Biotaq was used. PCR conditions were as 323
described in Bensch et al. (2000). The final PCR product was visualized on an ethidium 324
bromide-stained agarose gel (1.5%) to determine the initial presence/absence of parasite 325
DNA. 326
327
We used the birds from the Gåvålia site in contingency table tests (G-tests) for associations 328
between malaria infection and mating status, using mating data from the year a given male 329
was screened for parasites. We used birds from all sites for investigating relationships 330
between genotype and malaria. Finally, we analysed the interaction effect between malaria 331
and genotype/zygosity of candidate SNPs on mating status (in the screening year) using 332
logistic regression. 333
334
Results
335
Expression data 336
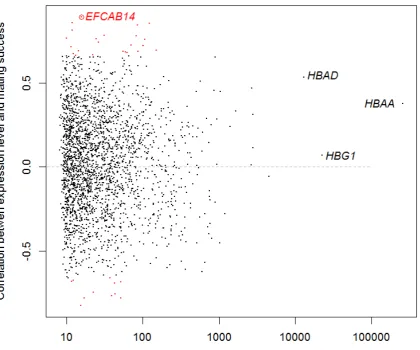
The three most highly-expressed transcripts in peripheral blood cells from male great snipe 337
12
genomes (HBAA, HBG1 and HBAD)(Fig. 1). Individual expression levels in all of these 339
tended to be positively correlated to mating success (but non-significantly so; Fig. 2). 340
341
We found 34 genes with a significant interaction between male mating success and gene 342
expression levels (23 with positive correlations and 11 with negative correlations). However 343
only one of these remained significant after correcting for false discovery rates (Fig.1). This 344
gene codes for “EF-hand calcium-binding domain-containing protein 14” (EFCAB14) and 345
was expressed at a relatively low level in most samples, but had no expression at all in some 346
of the un-mated males (Fig. 2). 347
348
SNP analyses of expressed genes 349
We identified a total of 2,874 gene-linked SNPs, covering 618 contigs, in our transcriptome 350
data. For downstream analyses we used 288 SNPs, in which we could make reliable genotype 351
calls for at least 10 individuals (mean Minor Allele Frequency=0.29). Genotypes of 352
individuals and analysis of relationship with mating success is presented for all SNPs in Table 353
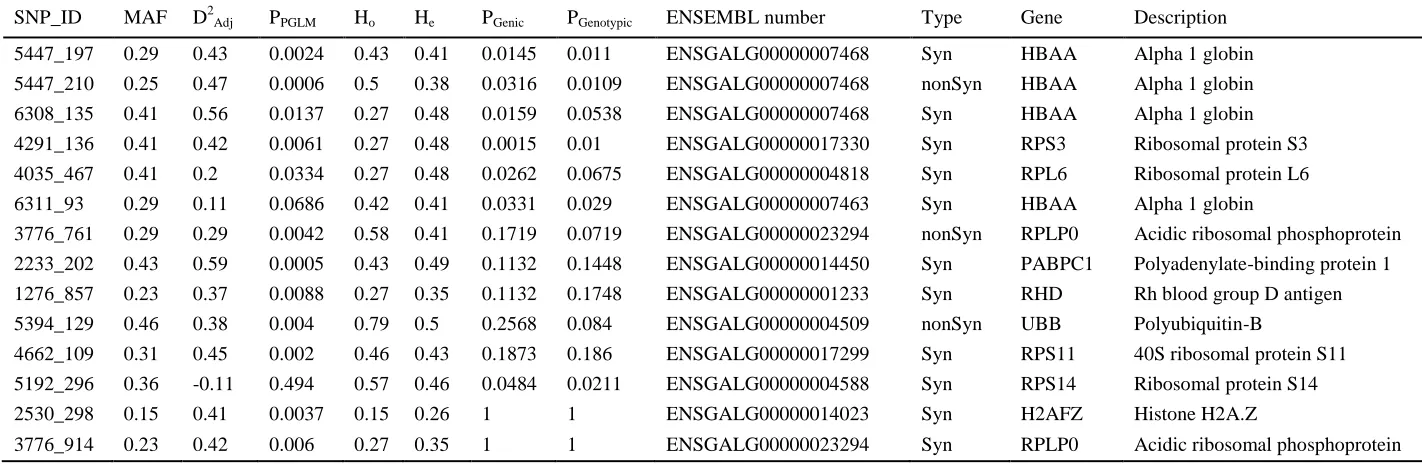
S4. Among these markers we found 14 SNPs with a significant association of mating success 354
or mating status with genotype (genic and genotypic). These 14 candidate SNPs were defined 355
by showing a significant association in at least one of the comparisons provided in Table 1. Of 356
these, three were non-synonymous substitutions, the rest were synonymous SNPs (Table 1). 357
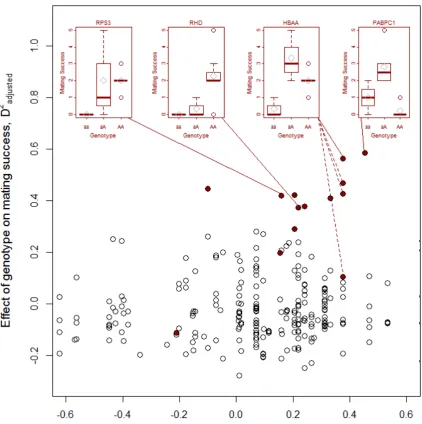
Four of the SNPs were found in HBAA (one non-synonymous and three synonymous). The 358
two remaining non-synonymous SNPs were associated with acidic ribosomal phosphoprotein 359
(RPLB0) and polyubiquitin-B (UBB) (Table 1, Fig. 3). Some of the top candidate genes, like 360
HBAA and polyadenylate-binding protein PABPC1, showed signs of heterozygote advantage 361
(Fig. 3, inserts).Markers situated in genes with a positive correlation between male mating 362
success and gene expression level, showed an increased relationship between mating success 363
and SNP genotype (r = 0.29, df = 52, p = 0.033, Fig. 3). 364
365
Analyses of candidate and non-candidate SNPs in a larger dataset 366
To check the generality of the above results, we tested for genotypic differences and 367
heterozygote advantage for a subset of SNPs, genotyped in 130 males sampled during 1994-368
2002 in the core study area. This subset included seven of the previously identified candidate 369
SNPs from Table 1. We did not find any evidence that individuals heterozygous for any of the 370
13
homozygous individuals nor any consistent effects of genotype on mating status (Table 2; 372
Supplementary Information, Table S5) – with one exception: there was a significant effect of 373
zygosity for a SNP in Ribosomal protein S14, but with higher proportion of mated 374
homozygous males rather than heterozygous males. When testing for genic and genotypic 375
differentiation (in the same way as done to identify candidates using GenePop), we found that 376
the two most highly differentiated markers were in candidate genes (RHD and RPS3). But 377
these were not statistically significant (Table 1, Table S5). 378
379
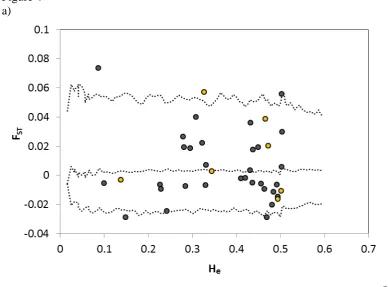
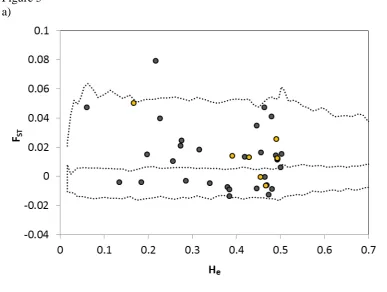
Outlier tests for differential spatial selection (FST among regions vs. heterozygosity), revealed
380
two loci, unknown protein 1487_1016 and Rh blood group D antigen (RHD), which showed 381
signs of being differentially selected among regions (Fig. 4a). Among these, the RHD gene 382
was among the previously identified candidate loci. DAPC and STRUCTURE analyses 383
suggested the presence of weak population structure (FST = 0.034; 95% confidence intervals:
384
0.024 - 0.047; P < 0.0001) among regions when using the 31 non-candidate loci (Fig. 4b, 385
Supplementary information, Fig. S6). But we found no differentiation (FST = 0.002; 95%
386
confidence intervals: -0.006 - 0.007; NS) when limiting the analysis to only the 7 candidate 387
loci (Fig. 4c). To obtain a similar number of individuals from each geographic region, and 388
avoid ascertainment bias due to overrepresentation of Gåvålia birds, we did these analyses 389
using all 51 individuals from the Eastern region (Poland/Estonia) and randomly selected 51 390
birds from Norway/Sweden. Using all the genotyped birds did not alter our conclusions. 391
392
We then divided the data into two time periods (first observation up to and including 1998 393
and after) and tested for temporal outliers. We found the same SNP as above with no 394
annotation information available (1487_1016) showing evidence of being differentially 395
selected over time (Fig. 5). As we observed only one P-value <0.05, this may be coincidental 396
given the number of tests and the chosen significance level. PCA and STRUCTURE analyses 397
suggested absence of genetic differentiation for both non-candidate (FST =-0.001; 95%
398
confidence intervals: -0.006 - -0.002; NS) and candidate SNPs (FST =-0.004; 95% confidence
399
intervals: -0.006 - 0.007; NS) among the two time periods (Fig. 5 and Supplementary 400
information, Fig. S7). 401
402
14
Males infected with Plasmodium/Haemoproteus had lower mating status (in the year of 404
screening) than uninfected males: only nine of 32 infected birds (28%) mated while 77 out of 405
162 uninfected birds (48%) did so, indicating that parasite infection may affect performance 406
on the lek (G-test, 2 = 4.2, P= 0.04). 407
Genotype appeared to have low or no effect on infection status of 408
Plasmodium/Haemoproteus. (Table 3a). Leucocytozoon prevalence was generally too low 409
(<5%) to allow meaningful analyses. The strongest associations are given in Table 3b and the 410
full prevalence data is presented in Table S8. 411
412
Interaction between genotype and malaria infection 413
Since malaria had a negative effect on obtaining matings, it could be that males with certain 414
genotypes have an advantage if infected and that this can obscure relationships between 415
genotype and mating success. We therefore analysed the joint effect of malaria and 416
genotype/zygosity of candidate SNPs on mating status. This reduced the sample size of 417
available males somewhat, and malaria infection did not any longer show a significant effect 418
on its own. Two of the seven candidate genes showed a significant interaction effect of 419
malaria and genotype and/or zygosity on mating status, both of these were located in HBAA 420
(Table 4, Figure S9). One was a synonymous (6311_93) and one was non-synonymous 421
substitution (5447_210). The SNP 5192_296 located in the RPS14-gene showed a direct 422
effect of zygosity on mating success with homozygotes experiencing higher mating status 423
compared to heterozygotes regardless of infection status (Figure S9). 424
425
Discussion
426
By comparing the gene-expression profiles and nucleotide variation in relation to mating 427
success and mating status we attempted at a de novo identification of candidate genes that are 428
related to sexual selection in male great snipe. We were able to assemble the great snipe 429
transcriptome using data from fourteen sequenced males simultaneously. The assembly 430
included almost six thousand previously annotated bird genes and another seventeen hundred 431
15
characterisation studies with a similar sequencing effort (Künstner et al. 2010). 433
434
Expression analyses and downstream SNP variation analyses of expressed genes have 435
previously been utilised in ecological RNA-Seq studies to detect potential loci under 436
selection. For example, several genes were detected to be associated with morphological 437
differentiation of lake trout (Goetz et al. 2010) and some SNP loci were identified to be 438
associated with growth rate in rainbow trout (Salem et al. 2012). In this study, we used a 439
similar approach to perform a comprehensive identification of candidate genes correlated with 440
mating performance in the great snipe. We found one differentially expressed gene and 14 441
candidate SNP loci with genetic differentiation in respect to male mating success. 442
443
The most highly expressed gene across all individuals was, not surprisingly since we studied 444
transcription levels in peripheral blood cells, coding for alpha 1 globin (HBAA), a protein 445
involved in oxygen transport (Ashburner et al. 2000). This and other haemoglobin genes also 446
tended to show a positive correlation between expression levels and male mating success (but 447
not significantly after multiple test correction). We did find significant positive relationships 448
between mating success and the expression of the EFCAB14 gene, but the functional link 449
remains obscure here. 450
451
We also found a correlation between the differential expression level of genes and the effect 452
of SNP genotype on mating success, suggesting that markers situated in genes with higher 453
expression in mated males showed a stronger relationship between genotype and mating 454
success. This indicates that there is a functional link between genotype and expression level, 455
also known as allele specific expression. A possible explanation is that mated males were able 456
to “turn on” and upregulate certain genes and thus improved their physical condition allowing 457
them access to females and matings, while males that become unmated may be forced to 458
upregulate alternative genes. Alternatively, mating directly triggers the expression of certain 459
genes, but this is a less likely explanation since the male blood was sampled in the beginning 460
of the mating season. 461
462
Among the SNPs found to correlate with mating success/status in our limited data set based 463
on the SNP-calling of the RNA-transcripts, three out of 14 were non-synonymous, suggesting 464
16
mating could possibly be explained by hitchhiking with linked, functional variants. However, 466
other studies of fitness correlations or outlier tests have also found a signal of selection for 467
synonymous substitutions, and thus prompting alternative functional explanations such as 468
selection on alternative splicing and miRNA stability (Milano et al. 2014). 469
470
When analysing SNP genotypes among the expressed genes we found one non-synonymous 471
SNP in HBAA. HBAA polymorphisms will be discussed in detail below. The two remaining 472
non-synonymous SNPs were associated with the genes encoding acidic ribosomal 473
phosphoprotein (RPLB0) and polyubiquitin-B (UBB). GO-terms for RPLP0 includes "host-474
virus interaction” and it has been associated with the innate immune response in human 475
corectal cancer patients (Benvenuto et al. 2015). UBB is coding for one of the most conserved
476
proteins known among eukaryotes and is involved in protein degradation and possibly
477
regulation of gene expression. Mutations in this gene has been associated with a number of
478
human disorders (see Conoway et al. 2002).
479 480
Comparative and functional studies of haemoglobin, the oxygen-transporting molecule of 481
nearly all vertebrates, have been performed for more than half a century (Perutz 1972; 1983; 482
Barra et al. 1981). Haemoglobin carries oxygen from the respiratory organs to the rest of the 483
tissues where it releases the oxygen to burn nutrients to provide energy to power the functions 484
of the organism during metabolism. Genetic polymorphisms for the genes encoding 485
haemoglobin have been detected among a large number of species and many of these 486
polymorphisms have been shown to correlate with, and explain, local adaptations to hypoxia 487
(Jessen et al. 1991; Storz et al. 2007; Weber 2007), physical work ability (Gardner et al. 488
1977), anaemia (Ingram et al. 1957) and malaria resistance (Allison 1954). Thus, a large body 489
of evidence suggests that haemoglobin molecules are subjected to selection and that different 490
variants may be favoured in different situations. 491
492
Both HBAA and a synonymous SNP for polyadenylate-binding protein PABPC1, showed 493
signs of heterozygote advantage in our RNA-Seq data. Genetic polymorphism in the human 494
homologues of HBAA, HBA1 and HBA2 causes -thalassemia. The worldwide distribution of 495
this and other disorders corresponds to areas of human malaria exposure, and heterozygotes 496
have been shown to be protected against severe malaria (Flint et al. 1986, 2001, Kwiatkowski 497
17 499
Our above analyses suggest a number SNPs associated with mating success in the limited 500
dataset of 14 males for which transcriptome data were accessible. However, this result could 501
not be replicated in the larger dataset, although we had to rely only on the cruder mating score 502
(as mated or not) in the latter analyses. This could suggest that the signals found in the 503
transcriptome data may have been a result of falsely inferred candidate genes in this first 504
dataset (which is sensitive to random noise due to a small sample size, and a high degree of 505
multiple testing due to the large number of markers used). Finding the genetic basis for a 506
complex, fitness related trait such as “mating success” may need a better control of 507
environmental confounding effects or experimental manipulation – which is not possible in 508
our studied system. Studies of sexual selection have been trying to find the traits associated 509
with mating success for decades (Andersson 1994, Jones and Ratterman 2009) and consensus 510
is that such traits most likely are polygenic (Andersson 1994) and also that sexual selection 511
involves many different traits and signalling modes (Schaefer and Ruxton 2015). What makes 512
a successful great snipe is likely condition dependent (Höglund et al. 1992, Ekblom et al. 513
2004, 2009), and if driven by disease resistance the underlying genetics is most certainly very 514
complex. 515
516
As in previous studies (Ekblom et al. 2007) we found a weak but significant genetic structure 517
between the eastern and the western population of great snipes when analysing non-candidate 518
SNP markers. In contrast there was no geographic structure in the pre-identified candidate 519
markers. This pattern is consistent with directional or balancing sexual selection acting on 520
these genes, but does not support the hypothesis that spatially varying selection patterns are 521
preserving variation at the sexually selected loci. It should however be noted that many 522
processes other than sexual selection could potentially generate within genome variance in 523
spatial structure (Wolf and Ellegren 2016). As we analysed very few candidate loci compared 524
to non-candidates this could also be an effect of lower statistical power. The only one of the 525
candidate genes for which we found increased spatial structure compared to neutral 526
expectations was the Rh blood group D antigen (RHD). This gene is associated with the Rh 527
blood group system in humans and non-coding polymorphisms have been shown to be
528
inflammatory markers (Flegel and Wagner 2000).
529 530
18
resistance genes. In this study we showed that malaria infected males were less likely to 532
belong to the ‘mated’ class of birds indicating mated birds were less often carrying avian
533
malaria. The two SNPs with a significant interaction between genotype and malaria 534
prevalence with mating status are both found in the gene encoding for HBAA, one being a 535
synonymous substitution and the other non-synonymous. For the synonymous substitution 536
there were also signs of a significant interaction between zygosity and malaria with mating 537
status. However, the relationships are weak and we cannot completely rule out that they may 538
be coincidental. For the SNP in the gene RPS14 we found a direct effect of heterozygosity but 539
here birds with matings appeared to more often be homozygous. RPS14 is reported to be 540
involved in human erythrocyte differentiation (Schneider et al. 2016). 541
542
More than thirty years ago it was suggested that parasites play a key role in generating sexual 543
selection (Hamilton and Zuk 1982). It was suggested that sexual reproduction and 544
recombination is a defence against antagonistically co-evolving parasites. Under this 545
hypothesis, selecting males that carry parasite-resistant genes plays a key function in mate 546
choice and species are predicted to evolve complex behaviours that allow the choosy sex to 547
reveal such genes. Lekking behaviours could be indicators of such resistance, since it is 548
difficult to perform courtship and territory defence while ill. How genetic variation is 549
maintained for such traits has been a longstanding question in evolutionary biology (Hamilton 550
and Zuk 1982, Andersson 1994). Various explanations have been put forward, including 551
fluctuating selection in time and space, antagonistic selection between the sexes (sexual 552
conflict), antagonistic pleiotropic effects and balancing selection favouring heterozygote 553
genotypes (reviewed by Hedrick and Kim 1975, Radwan 2008). In this study we find no 554
conclusive evidence for any of these mechanisms but we do show that there is genetic 555
variation in genes expressed during lekking (which is when mate choice takes place). We 556
document genetic variation for the most highly transcribed gene in peripheral blood cells, 557
HBAA and several other disease- and condition related genes in a wild lekking bird species. 558
Furthermore, males infected with avian malaria parasites had lower mating success than non-559
infected males. Our results thus suggest that physically exhausting lek displays could be used 560
by females as indicators of ‘good genes’ while selecting their mates and that genetic variation 561
for such traits is present in the population. This does not exclude the possibility that the same 562
genetic variants that allow good health status during lekking may also be advantageous during 563
19 565
566
Acknowledgements 567
We thank three anonymous reviewers for very constructive criticism on former versions of 568
this paper. Sten L. Svartaas, Magnus Johansson, Urs Kormann, Robert Mannelqvist, Claire 569
Morandin, Lenka Vysinova and many other field assistants provided excellent assistance 570
during field work. Library preparation, sequencing and SNP genotyping were completed at 571
the Uppsala University SNP&SEQ Technology Platform. The high-performance computing 572
facility at Uppsala University (SNIC-UPPMAX) was utilised for bioinformatic analyses. 573
Ethical permits for capture and blood sampling of birds were obtained from the Stavanger 574
Museum and the Norwegian Animal Research Authority. Sample preparation in Sheffield was 575
supported by the UK Natural Environment Research Council. Funding for this study was 576
granted by the Carl Trygger Foundation (to RE) and the Swedish Research Council (VR) to 577
JH. 578
579 580
References 581
Allison AC (1954) Protection afforded by sickle-cell trait against subtertian malarial 582
infection. British Medical Journal 6, 290–294. 583
Alonso JC, Magana M, Martin CA, et al. (2010) Sexual traits as quality indicators in lekking 584
male great bustards. Ethology 116, 1084-1098. 585
Altschul SF, Madden TL, Schäffer AA et al. (1997) Gapped BLAST and PSI-BLAST: a new 586
generation of protein database search programs. Nucleic Acids Research 25, 3389-3402. 587
Andersson M (1994) Sexual selection. Princeton Univ Press, Princeton. 588
Antao T, Lopes A, Lopes RJ et al. (2008) LOSITAN: A workbench to detect molecular 589
adaptation based on a Fst-outlier method. BMC Bioinformatics 9, 323.
590
Ashburner M, Ball CA, Blake JA, et al. (2000) Gene ontology: tool for the unification of 591
biology. The gene onthology consortium. Nature Genetics 25, 25-29. 592
Barra D, Bossa F, Brunori M (1981) Structure for binding sites for heterotropic effectors in 593
fish haemoglobins. Nature 293, 587-588. 594
Benjamini Y, Hochberg Y (1995) Controlling the False Discovery Rate: A Practical and 595
Powerful Approach to Multiple Testing. Journal of the Royal Statistical Society. B 57, 596
20
Bensch S, Stjernman M, Hasselquist D et al. (2000) Host specificity in avian blood parasites: 598
a study of Plasmodium and Haemoproteus mitochondrial DNA amplified from birds. 599
Proceedings of the Royal Society B 267, 1583–1589. 600
Benvenuto M, Sileri P, Rossi P (2015) Natural humoral immune response to ribosomal P0 601
protein in corectal cancerpatients. Journal of Translational Medicine 13, 101. 602
Beaumont MA (2005). Adaptation and speciation: what can F-st tell us? Trends in Ecology 603
and Evolution 20, 435–440. 604
Borgia G (1979) Sexual selection and the evolution of mating systems In: Sexual 605
selection and reproductive competition (eds Blum M, Blum A) pp 19-80 606
Academic Press, New York 607
Conaway RC, Brower CS, Conaway JW (2002) Emerging roles of ubiquitin in transcription
608
regulation. Science 296, 1254–1258.
609
Cornwallis CK, Uller T (2012) Towards an evolutionary ecology of sexual traits. Trends in 610
Ecology and Evolution 25, 145-152 611
Darwin CR (1871) The descent of man, and selection in relation to sex. John Murray, London. 612
DuVal EH (2013) Female mate fidelity in a lek mating system and its implications for the 613
evolution of cooperative lekking behavior. American Naturalist 181, 213-222 614
Ekblom R, Sæther SA, Grahn M, et al. (2004) Major histocompatibility complex variation 615
and mate choice in a lekking bird, the great snipe (Gallinago media). Molecular Ecology 616
13, 3821-3828. 617
Ekblom R, Sæther SA, Hasselquist D, et al. (2005) Female choice and male humoral immune 618
response in the lekking great snipe (Gallinago media). Behavioral Ecology 16, 346-351. 619
Ekblom R, Sæther SA, Jacobsson P, et al. (2007) Spatial pattern of Mhc Class II variation in 620
the great snipe (Gallinago media). Molecular Ecology 16: 1439-1451. 621
Ekblom R, Sæther SA, Fiske P, et al. (2009) Balancing selection, sexual selection and 622
geographic structure in MHC genes of Great Snipe. Genetica 138, 453–461. 623
Evanno G, Regnaut S, Goudet J (2005) Detecting the number of clusters of individuals using 624
the software STRUCTURE: a simulation study. Molecular Ecology 14, 2611–20. 625
Fiske P, Kålås JA (1995) Mate sampling and copulation behaviour of great snipe females 626
Animal Behaviour 49, 209 – 219 627
Flegel WA, Wagner FF (2000) Molecular genetics of RH. Vox Sanguinis 78, 109–15.
628
Flint J, Hill AV, Bowden DK, et al. (1986). High frequencies of -thalassemia are the result 629
21
Flint J, Tufarelli C, Peden J, et al. (2001) Comparative genome analysisdelimits a 631
chromosomal domain and identifies key regulatory elements in the globin 632
cluster. Human Molecular Genetics 10, 371-382. 633
Folstad I, Karter AJ (1992) Parasites, bright males, and the immunocompetence 634
handicap. American Naturalist 139, 603–622. 635
Francis RM (2016) POPHELPER: an R package and web app to analyse and visualize 636
population structure. Molecular Ecology Resources, doi:10.1111/1755-0998.12509 637
Fromhage L, Kokko H, Reid JM (2009) Evolution of mate choice for genome-wide 638
heterozygosity. Evolution 63: 684-694. 639
Gardner GG, Edgerton VR, Senewiratne B, et al. (1977) Physical work capacity and stress in 640
subjects with iron deficiency anemia. American Journal of Clinical Nutrition 30, 910-641
917. 642
Gentleman R, Carey V, Bates D, et al. (2004) Bioconductor: open software development for 643
computational biology and bioinformatics. Genome Biology 5, R80 644
Greenfield MD, Danka RG, Gleason JM, et al. (2012) Genotype × environment interaction, 645
environmental heterogeneity and the lek paradox. Journal of Evolutionary Biology 25, 646
601-613. 647
Goetz F, Rosauer D, Sitar S, et al. (2010) A genetic basis for the phenotypic differentiation 648
between siscowet and lean lake trout (Salvelinus namaycush). Molecular Ecology 19, 649
176-196. 650
Goudet J, Jombart T (2015) Package hierfstat. http://github.com/jgx65/hierfstat. 651
Guisan A, Zimmermann NE (2000) Predictive habitat distribution models in ecology. 652
Ecological Modelling 135, 147-186. 653
Hamilton WD, Zuk M (1982) Heritable true fitness and bright birds: a role for parasites. 654
Science 218, 384-387. 655
Hedrick PW, Kim TJ (1975) Genetics of complex polymorphisms: parasites and the 656
maintenance of the major histocompatibility complex variation. In: Evolutionary 657
Genetics: From molecules to morphology (eds. Singh RS, Krimbas CB). pp 713. 658
Cambridge Univ Press, Cambridge. 659
Hellgren O, Waldenström J, Bensch S (2004) A new PCR assay for simultaneous studies of 660
Leucocytozoon, Plasmodium, and Haemoproteus from avian blood. Parasitology 90, 661
22
Höglund J, Lundberg A (1987) Sexual selection in a monomorphic lek-breeding bird: 663
correlates of male mating success in the great snipe Gallinago media. Behavioural 664
Ecology and Sociobiology 21, 211-216. 665
Höglund J, Robertson JGM (1990) Female preferences, male decision rules and the evolution 666
of leks in the Great snipe. Animal Behaviour 40, 15-22. 667
Höglund J, Kålås JA, Fiske P (1992) The costs of secondary sexual characters in the lekking 668
great snipe (Gallinago media). Behavioural Ecology and Sociobiology 30, 309-315 669
Höglund J, Alatalo RV (1995) Leks. Princeton Univ Press, Princeton. 670
Hubbard T, Barker D, Birney E, et al. (2002) The Ensembl genome database project. Nucleic 671
Acids Research 30, 38-41. 672
Ingram VR (1957) Gene mutations in human haemoglobin: the chemical difference between 673
normal and sickle cell haemoglobin. Nature 458: 326-328. 674
Jakobsson M, Rosenberg N (2007) CLUMPP: a cluster matching and permutation program 675
for dealing with label switching and multimodality in analysis of population structure. 676
Bioinformatics 23, 1801–1806. 677
Jessen TH, Weber RE, Fermi G, et al. (1991) Adaptation of bird hemoglobins to high-678
altitudes – demonstration of molecular mechanism by protein engineering. Proceedings 679
of the National Academy of Sciences USA 88, 6519–6522. 680
Jombart T (2008) ADEGENET: a R package for the multivariate analysis of genetic markers. 681
Bioinformatics 24,1403–1405. 682
Jones AG, Ratterman NL (2009) Mate choice and sexual selection: what have learned since 683
Darwin? Proceedings of the National Academy of Sciences 106, 10001-10009. 684
Kålås JA, Fiske P, Sæther SA (1995) The effect of mating probability on risk taking: an 685
experimental study in lekking great snipe. American Naturalist 146, 59-71. 686
Künstner A, Wolf JBW, Backström N et al. (2010) Comparative genomics based on massive 687
paralell transcriptome sequencingreveals patterns of substitution and selection across 10 688
bird species. Molecular Ecology 19, 266-276. 689
Kirkpatrick M, Ryan M (1991) The evolution of mating preferences and the paradox of the 690
lek Nature 350, 33–39. 691
Kotiaho J. Simmons LW. Tomkins JL (2001) Towards a resolution of the lek paradox Nature 692
410, 684-686. 693
Kotiaho J, LeBas NR, Puurtinen M, et al. (2008) On the resolution of the lek paradox. Trends 694
23
Kwiatkowski DP (2005) How malaria has affected the human genome and what human 696
genetics can teach us about malaria. American Journal of Human Genetics 77, 171-192. 697
Lindström Å, Alerstam T, Bahlenberg P, et al. (2016) The migration of the great snipe 698
Gallinago media: intriguing variations on a grand theme. Journal of Avian Biology 47, 699
321-334. 700
Løfaldli L, Kålås JA, Fiske P (1992) Habitat selection and diet of Great Snipe Gallinago 701
media during breeding. Ibis 134, 35-43. 702
Milano I, Babbucci M, Cariani A, et al. (2014) Outlier SNP markers reveal fine-scale genetic 703
structuring across European hake populations (Merluccius merluccius). Molecular 704
Ecology 23, 118-135. 705
Miller CV, Moore AJ (2007) A potential resolution to the lek paradox through indirect genetic 706
effects Proceedings of the Royal Society B 274, 1279-1286. 707
Pardo-Diaz C, Salazar C, Jiggins CD (2015) Towards the identification of the loci of adaptive 708
evolution. Methods in Ecology and Evolution 6, 445-464. 709
Perutz MF (1972) Nature of Haem-Haem interaction Nature 237, 495-499. 710
Perutz MF (1983) Species adaptation in a protein molecule. Molecular Biology and Evolution 711
1, 1–28. 712
Pritchard JK, Stephens M, Donnelly P (2000) Inference of population structure using 713
multilocus genotype data. Genetics 155, 945–959. 714
R Development Core Team (2008) R: a language and environment for statistical computing. 715
R Foundation for Statistical Computing, Vienna. 716
Radwan J (2008) Maintenance of genetic variation in sexual ornaments: a review of the 717
mechanisms. Genetica 134, 113-127. 718
Raymond M, Rousset F (1995) GENEPOP (version 1.2): population genetics software for 719
exact tests and eumenicism. Journal of Heredity 86, 248–249. 720
Robinson M, Oshlack A (2010) A scaling normalization method for differential expression 721
analysis of RNA-seq data. Genome Biology 11, R25. 722
Robinson MD, McCarthy DJ, Smyth GK (2010) edgeR: a Bioconductor package for 723
differential expression analysis of digital gene expression data. Bioinformatics 26, 724
139-140. e13 725
Rowe L, Houle D (1996) The lek paradox and the capture of genetic variance by condition 726
24
Ryder TB, Tory WP, Blake JG, et al. (2010) Mate choice for genetic quality: a test of the 728
heterozygosity and compatibility hypotheses in a lek-breeding bird. Behavioral Ecology 729
21, 203-210. 730
Salem M, Vallejo RL, Leeds TD et al. (2012) RNA-Seq identifies SNP markers for growth 731
traits in rainbow trout. PLoS ONE 7, e36264 732
Sæther SA, Fiske P, Kålås JA, et al. (2000) Females of the lekking great snipe do not prefer 733
males with whiter tails. Animal Behaviour 59, 273–280. 734
Sæther SA, Fiske P, Kålås JA (2001) Male mate choice, sexual conflict and strategic 735
allocation of copulations in a lekking bird. Proceedings of the Royal Society B 268, 736
2097-2102. 737
Sæther SA, Baglo R, Fiske P, et al. (2005) Direct and indirect mate choice on leks. American 738
Naturalist 166, 145-157. 739
Sæther SA. Fiske P. Kålås JA. et al. (2007) Inferring local adaptation from Qst-Fst 740
comparisons: neutral genetic and quantitative trait variation in European populations 741
of great snipe. Journal of Evolutionary Biology 20, 1563-1576. 742
Schaefer HM, Ruxton GD (2015) Signal diversity, sexual selection and speciation. Annual 743
Review of Ecology, Evolution and Systematics 46, 573-592. 744
Schneider RK, Schenone M, Ventura Ferreira M, et al. (2016) Rps 14 haploinsufficiency 745
causes a block in erythroid differentiation mediated by S100A8 and S100A9. Nature 746
Medicine 22, 288-297. 747
Shorey L. Piertney S. Stone J. et al. (2000) Fine-scale genetic structuring on Manacus 748
manacus leks. Nature 408, 352-353. 749
Smedley DS, Haider B, Ballester R et al. (2009) BioMart - biological queries made easy. 750
BMC Genomics 10, e22. 751
Storz JF (2005) Using genome scans of DNA polymorphism to infer adaptive population 752
divergence. Molecular Ecology 14, 671–688. 753
Storz JF, Sabatino SJ, Hoffmann FG et al. (2007) The molecular basis of high-altitude 754
adaptation in deer mice. PLoS Genetics 3, 448–459. 755
Taylor PD, Williams GC (1982) The lek paradox is not resolved. Theoretical 756
Population Biology 22, 392-409 757
Tomkins J, Radwan J, Kotiaho J, et al. (2004) Genic capture and resolving the lek paradox 758
25
Vehrencamp SL, Bradbury JW, Gibson RM (1989) The energetic costs of display in male 760
sage grouse. Animal Behaviour 38, 885-896. 761
Warren WC, Clayton DF, Ellegren H, et al. (2010) The genome of a songbird. Nature 464, 762
757-762. 763
Weber RE (2007) High-altitude adaptations in vertebrate hemoglobins. Respiratory 764
Physiology and Neurobiology 158, 132–142. 765
Weisberg S (1980) Applied Linear Regression. New York, Wiley 766
Wolf JBW, Ellegren H (2016) Making sense of genomic islands of differentiation in light of 767
speciation. Nature Review Genetics, doi:10.1038/nrg.2016.133 768
769
Author contribution 770
The study was designed by R.E and J.H. J.H, R.E and B.W wrote the manuscript with the 771
assistance of all other authors. S.A.S, J.A.K and P.F led the field work and maintained the behavioural 772
data base. M.K.P.B, B.W and G.H produced and analysed the genetic data under the supervision of 773
R.E, J.H and T.B. S.A.S and P.H produced and analysed the parasite data. S.A.S, M.K.P.B, 774
and B.W. conducted the statistical analyses with the assistance of J.H. and R.E. 775
776 777
Supporting information 778
Table S1. A list of annotated genes and their corresponding expression levels. 779
780
Table S2. Information on the individual males in the transcriptome part of the study. 781
782
Table S3. Information on SNP markers including flanking sequences. 783
784
Table S4. Genotypes of individual males (coded as 0. 1,5 and 1) and results of GLMs 785
(Poisson regression) for the effect of genotype on mating success (number of mated females). 786
P-values from GenePop analysis of alleles (P_Genic) and genotypes (P_Genotypic) are also 787
included. Analyses based on the 288 SNPs in 14 males called from the expression data. 788
789
Table S5. Results from tests of the association between male mating status (mated/unmated) 790
and SNP genotype and zygosity, as inferred from all SNP markers from the larger data set (G-791
26 793
Figure S6. Results of STRUCTURE runs for genetic differentiation among regions. Analyses 794
were run on 31 non-candidates and 7 candidate SNP-loci, respectively, with the extended data 795
set from all sites. 796
797
Figure S7. Results of STRUCTURE runs for genetic differentiation among two time periods 798
(Early vs. Late). Analyses were run on 31 non-candidates and 7 candidate SNP-loci, 799
respectively, with the extended data set from the Gåvålia site. 800
801
Table S8. Data on avian malaria prevalence and genotype data for 38 SNP in individual birds. 802
803
Figure S9. Probability of mating in relation to malaria infection and genotype of seven 804
candidate genes. Estimates and confidence intervals modelled using logistic regression. 805
Mating status measured in the year of screening for malaria (i.e. the year the blood was 806
sampled). “Rugs” show individual males. 807
27
Table 1. Top candidate SNPs for association between male mating success/status and genotype, as inferred from great snipe 1
transcriptome sequencing data from 14 males in 2010. SNPs with a significant association in at least one of the tests performed are 2
listed. MAF = Minor Allele Frequency, D2Adj = Adjusted Deviance Explained from the GLM analyses (Poisson regression, quantified
3
mating success), PPGLM = significance value from the GLM analyses, Ho = observed heterozygosity, He = expected heterozygosity,
4
PGenic = significance value for G test of genic differentiation between mated and un-mated males, PGenotypic = significance value for G
5
test of genotypic differentiation between mated and un-mated males. For full data on all SNPs see Supplementary Table S4. 6
7 8
9 10
SNP_ID MAF D2Adj PPGLM Ho He PGenic PGenotypic ENSEMBL number Type Gene Description
5447_197 0.29 0.43 0.0024 0.43 0.41 0.0145 0.011 ENSGALG00000007468 Syn HBAA Alpha 1 globin
5447_210 0.25 0.47 0.0006 0.5 0.38 0.0316 0.0109 ENSGALG00000007468 nonSyn HBAA Alpha 1 globin
6308_135 0.41 0.56 0.0137 0.27 0.48 0.0159 0.0538 ENSGALG00000007468 Syn HBAA Alpha 1 globin
4291_136 0.41 0.42 0.0061 0.27 0.48 0.0015 0.01 ENSGALG00000017330 Syn RPS3 Ribosomal protein S3
4035_467 0.41 0.2 0.0334 0.27 0.48 0.0262 0.0675 ENSGALG00000004818 Syn RPL6 Ribosomal protein L6
6311_93 0.29 0.11 0.0686 0.42 0.41 0.0331 0.029 ENSGALG00000007463 Syn HBAA Alpha 1 globin
3776_761 0.29 0.29 0.0042 0.58 0.41 0.1719 0.0719 ENSGALG00000023294 nonSyn RPLP0 Acidic ribosomal phosphoprotein
2233_202 0.43 0.59 0.0005 0.43 0.49 0.1132 0.1448 ENSGALG00000014450 Syn PABPC1 Polyadenylate-binding protein 1
1276_857 0.23 0.37 0.0088 0.27 0.35 0.1132 0.1748 ENSGALG00000001233 Syn RHD Rh blood group D antigen
5394_129 0.46 0.38 0.004 0.79 0.5 0.2568 0.084 ENSGALG00000004509 nonSyn UBB Polyubiquitin-B
4662_109 0.31 0.45 0.002 0.46 0.43 0.1873 0.186 ENSGALG00000017299 Syn RPS11 40S ribosomal protein S11
5192_296 0.36 -0.11 0.494 0.57 0.46 0.0484 0.0211 ENSGALG00000004588 Syn RPS14 Ribosomal protein S14
2530_298 0.15 0.41 0.0037 0.15 0.26 1 1 ENSGALG00000014023 Syn H2AFZ Histone H2A.Z
28
Table 2. Association between male mating status (mated/unmated) and SNP genotype (df = 2) and zygosity (df = 1), as inferred from 1
SNP typing data from the larger data set for seven of the candidate loci listed in Table 1 (G-tests and p-values on differentiation from 2
GenePop). Results from all markers are presented in Table S5. 3
4 5
SNP_ID n Genotype
2 P
Zygosity 2 P
GenePop p-value
Type Gene Description
Genic Genotypic
5447_210 125 3.57 0.16 0.01 0.94 0.89 0.89 nonSyn HBAA Alpha 1 globin
6308_135 129 2.26 0.32 1.57 0.21 0.79 0.78 Syn HBAA Alpha 1 globin
4291_136 128 0.54 0.76 0.02 0.88 0.12 0.12 Syn RPS3 Ribosomal protein S3
4035_467 128 0.62 0.73 0.58 0.45 0.76 0.74 Syn RPL6 Ribosomal protein L6
6311_93 130 4.14 0.12 0.18 0.67 0.89 0.89 Syn HBAA Alpha 1 globin
1276_857 130 0.09 0.95 0.01 0.96 0.077 0.079 Syn RHD Rh blood group D antigen
29
Table 3. SNP genotypes showing the highest association with avian malaria infection status (SNP id followed by Gene abbreviation). For each genotype the number of uninfected individuals is given followed by the number of infected individuals after the slash. a) SNPs associated with Plasmodium/Haemoproteus infection and b) with Leucocytozoon infection.
SNP ID Gene Genotype P
a) AA AB BB
3159_891 Anon SNP 23/8 86/20 72/35 5.33 0.07 3236_232 EIF4H 68/19 63/32 45/12 4.37 0.13 b)
30
Table 4. Effects of candidate SNP genotype, malaria infection status and their interaction on mating status. Sequential analysis of deviance of logistic regression models. Mating status modelled as a function of infected or not with malaria (Plasmodium/Haemoproteus), genotype or zygosity of the SNP, and interaction between malaria and genotype or zygosity. For each SNP, a model is tested against the one above it showing the reductions in the residual deviance as each term of the formula is added in turn. Significant models highlighted in yellow.
Genotype Zygosity
Candidate
SNP Model Df Deviance
Residual Df
Residual
Deviance Pr(>Chi) Model Df Deviance
Residual Df
Residual
Deviance Pr(>Chi)
1276_857 NULL 89.000 118.288 NULL 89 118.288
RHD Malaria 1 0.834 88.000 117.454 0.361 Malaria 1 0.834 88 117.454 0.361
Genotype 2 2.250 86.000 115.205 0.325 Zygosity 1 1.514 87 115.940 0.218
Malaria:Genotype 1 1.280 85.000 113.925 0.258 Malaria:Zygosity 1 1.327 86 114.613 0.249
4035_467 NULL 88.000 117.368 NULL 88 117.368
RPL6 Malaria 1 0.782 87.000 116.586 0.376 Malaria 1 0.782 87 116.586 0.376
Genotype 2 1.338 85.000 115.248 0.512 Zygosity 1 1.146 86 115.440 0.284
Malaria:Genotype 1 0.957 84.000 114.291 0.328 Malaria:Zygosity 1 1.017 85 114.424 0.313
4291_136 NULL 88.000 116.262 NULL 88 116.262
RPS3 Malaria 1 0.931 87.000 115.331 0.335 Malaria 1 0.931 87 115.331 0.335
Genotype 2 2.334 85.000 112.998 0.311 Zygosity 1 1.784 86 113.547 0.182
Malaria:Genotype 2 1.594 83.000 111.404 0.451 Malaria:Zygosity 1 0.246 85 113.301 0.620
5192_296 NULL 86.000 114.454 NULL 86 114.454
RPS14 Malaria 1 0.823 85.000 113.631 0.364 Malaria 1 0.823 85 113.631 0.364
Genotype 2 4.465 83.000 109.166 0.107 Zygosity 1 4.377 84 109.255 0.036
Malaria:Genotype 2 2.034 81.000 107.132 0.362 Malaria:Zygosity 1 0.387 83 108.868 0.534
5447_210 NULL 86.000 114.454 NULL 86 114.454