This is a repository copy of
Predicting microstructure and strength of maraging steels:
Elemental optimisation
.
White Rose Research Online URL for this paper:
http://eprints.whiterose.ac.uk/103341/
Version: Accepted Version
Article:
Galindo-Nava, E.I., Rainforth, W.M. orcid.org/0000-0003-3898-0318 and
Rivera-Díaz-del-Castillo, P.E.J. (2016) Predicting microstructure and strength of maraging
steels: Elemental optimisation. Acta Materialia, 117. pp. 270-285. ISSN 1359-6454
https://doi.org/10.1016/j.actamat.2016.07.020
[email protected]
https://eprints.whiterose.ac.uk/
Reuse
This article is distributed under the terms of the Creative Commons Attribution-NonCommercial-NoDerivs
(CC BY-NC-ND) licence. This licence only allows you to download this work and share it with others as long
as you credit the authors, but you can’t change the article in any way or use it commercially. More
information and the full terms of the licence here: https://creativecommons.org/licenses/
Takedown
If you consider content in White Rose Research Online to be in breach of UK law, please notify us by
U
N
C
O
R
R
E
C
T
E
D
P
R
O
O
F
A R T I C L E I N F O
Article history:
Received 2 February 2016 Received in revised form 3 June 2016 Accepted 7 July 2016
Available online xxx
Keywords:
Martensite Modelling
Precipitation hardening Austenite
Intermetallics
A B S T R A C T
A physics–based modelling framework to describe microstructure and mechanical properties in maraging steels is pre-sented. It is based on prescribing the hierarchical structure of the martensitic matrix, including dislocation density, and lath and high–angle grain boundary spacing. The evolution of lath–shaped reverted austenite is described using grain–boundary diffusion laws within a lath unit. The dislocation density provides the preferential nucleation sites for precipitation, whereas descriptions for particle nucleation, growth and coarsening evolution are identified for Ni3Ti, NiAl and its variants, and BCC–Cu clusters. These results are combined to describe the hardness at different ageing tempera-tures in several Fe Ni–, Fe Mn–and Fe Ni Mn–based steels. A critical assessment on individual contribu-tions of typical alloying elements is performed. Ni and Mn control the kinetics of austenite formation, where the latter shows stronger influence on the growth kinetics. Ti additions induce higher hardness by precipitating stronger Ni3Ti, whereas Cu clusters induce low strength. A relationship between the reverted austenite and the total elongation in over-aging conditions is also found. This result allows to identify optimal process and alloy design scenarios to improve the ductility whilst preserving high hardness in commercial maraging steels.
© 2016 Published by Elsevier Ltd. Contents lists available at ScienceDirect
Acta Materialia
journal homepage: www.elsevier.com
Full length article
Predicting microstructure and strength of maraging steels: Elemental optimisation
E.I. Galindo-Nava
a,∗, W.M. Rainforth
b, P.E.J. Rivera-D
í
az-del-Castillo
aa
Department of Materials Science and Metallurgy, University of Cambridge, 27 Charles Babbage Rd, Cambridge, CB3 0FS, UK
b
Department of Materials Science and Engineering, University of Sheffield, Mappin St, Sheffield, S1 3JD, UK
1. Introduction
Maraging steels combine exceptional properties, including high strength and toughness, high strength to weight ratio, good weld-ability, simplicity of heat treatments and dimensional stability. These properties stem from the complex microstructures forming during hot processing: (i) A hierarchically–arranged lath martensite matrix (α′) decorated by (ii) nano–sized intermetallic precipitates and (iii) austen-ite laths (γ) that re–precipitate fromα′. The first two items dictate mostly the hardness, whilst the partial reversion from martensite to austenite strongly influences their ductility and toughness [1,2]. Ad-ditionally, complicated interactions between alloying elements and the evolving microstructure occur during ageing. For instance, grain–boundary embrittlement occurring in underaged conditions is due to Mn and Ni segregation to the prior–austenite boundaries, be-coming ductile again during overaging [1,2]. This effect is induced by austenite reversion, promoting Ni and Mn partitioning into theγ, and by overaging grain–boundary precipitates [1].
Systematic experimental studies have been performed to explore optimal compositions for improving the mechanical properties of maraging steels [3–7], whilst optimisation algorithms have been pos-tulated to link alloying additions with strength variations [8–10]. Al-though the optimisation methods show good correlation with experi-ments, no detailed microstructural information is predicted; this lim
∗ ∗
Corresponding author.
Email address: [email protected] (E.I. Galindo-Nava)
its their application to other compositional scenarios. Additionally, thermokinetics methods have been applied to understand how the chemical composition affects intermetallic [11] and reverted austen-ite [12,13] evolution; however, these approaches have not provided a direct link with mechanical properties, including strength and elonga-tion.
These results show that, in spite of the considerable work done to improve the properties of maraging steels, a unified physics–based modelling framework is missing. Such could provide direct links be-tween the microstructure and mechanical properties for different com-positions and heat treatments. A key reason for this is the lack of a description for the martensitic matrix, as its hierarchical structure strongly controls microstructure evolution [6,12,14]: a high disloca-tion density in the laths accelerates precipitadisloca-tion nucleadisloca-tion, whereas the segregation ofγ–stabilising elements into the lath boundaries de-termines the morphology and kinetics of the reverted austenite [14–16].
The objective of this work is to present a modelling suite for de-scribing microstructure evolution and mechanical properties in marag-ing steels, includmarag-ing effects of chemical composition and initial mi-crostructure. The models are based on a previous description of the hierarchical structure of lath martensite in Fe C steels [17,18], where the density of dislocations, laths, and high–angle grain bound-aries were prescribed in terms of the prior–austenite grain size and ageing conditions; the extension of the martensite models to marag-ing steels is presented in Section 3. These features will allow us to provide the microstructural landscape for modelling reverted austen-ite and precipitation evolution in Sections 4 and 5, respectively.
U
N
C
O
R
R
E
C
T
E
D
P
R
O
O
F
These results are combined in Section 6 to link the resulting mi-crostructure with the hardness of maraging steels. Model validation with experimental data in 19 steels is presented in Sections 7 and 8. A critical assessment on individual contributions of the typical alloy-ing elements to the yield strength and ductility is presented in Section 8.1. A direct link between the volume fraction of reverted austenite and the total elongation in several grades is established in Section 8.2. This allows exploring optimal compositions and processing scenarios for improving the ductility whilst preserving high strength. Conclud-ing remarks are outlined in Section 9.
2. Materials and methods
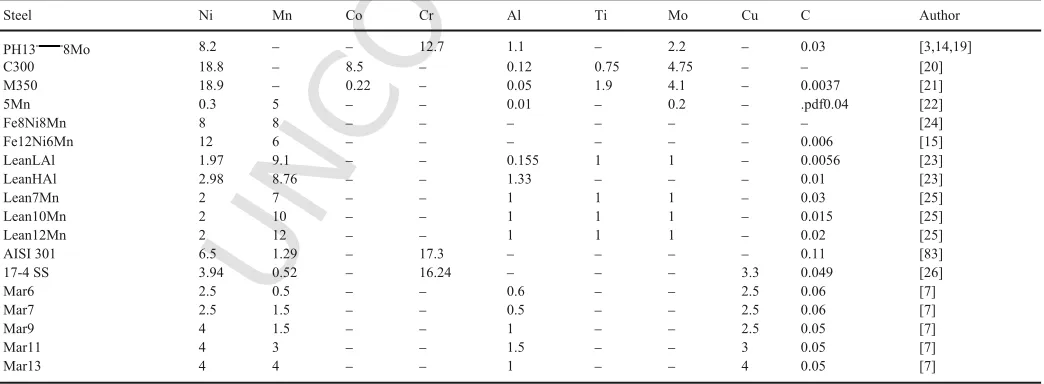
A number of Fe Ni–, Fe Mn–, and Fe Ni Mn–based maraging steels were studied following various ageing conditions. Table 1 shows the chemical composition and denomination of the ma-terials tested in this work; experimental results on the microstructure and hardness have been obtained from the literature. The composi-tional range of these materials will allow to study several microstruc-tural features induced by different alloying elements. The effects of other substitutional elements with less than 1 wt% are ignored due to their low contribution to microstructure evolution. It is worth not-ing that although the carbon content in most of the steels tested is low, a significant amount of carbides could still be present; this would promote a competition between carbide and intermetallic strengthen-ing. Nevertheless, Schintzer et al. [14,19] and Leitner et al. [3] did not report carbide formation in PH13 8Mo for the ageing condi-tions employed in this work. Similarly, Zhu et al. [20] did not mea-sure any carbon content in C300. Additionally, no carbide formation was reported in M350 [21], 5Mn [22], Fe12Ni6Mn [15], LeanLAl and LeanLAl [23], and the Mar6–13 grades [7]. No carbon content in Fe8Ni8Mn was reported [24]. Coarse TiC particles were observed in Lean7Mn, Lean10Mn and Lean12Mn in as–quenched conditions, having volume fraction of 0.22% and a mean size of 500 nm; nev-ertheless, Qian [25] concluded that they have no influence on hard-ening due to their size. Similarly, carbide formation in 17-4 SS has been reported [26]; Viswanathan et al. [27] have explored their ef-fects in strengthening, concluding that it is low. Carbide formation in AISI 301 has been reported, however only reverted austenite kinet-ics is explored in this work. These results show that, for the condi-tions tested in this work, carbide contribution to strengthening can be
ignored. Additionally, except for C300, only Co–free steels are con-sidered in this study, as this work is focused on cost–efficient alloy development. Similarly, it will be assumed that the martensite laths are fully formed in as–quenched conditions and no retained austenite is present, unless otherwise stated; this is to consider a homogenous structure during ageing.
3. Martensite structure
The microstructure of lath martensite in Fe C steels has been described in previous work [17,18]. The martensite matrix consists of fine lath units (∼100–300 nm thick) hierarchically arranged in sub-structures within the prior–austenite grains (PAG), namely packets and blocks of individual laths. These arrangements accommodate the crystallographic distortions during the transformation from austenite into martensite and ensuring that the net strain in the prior austen-ite grain is pure dilatation [28]. The packet (dpacket) and block (dblock) sizes are proportional to the prior–austenite grain size (Dg), where the proportionality constants are determined by the variant number of the austenite/martensite transformation habit planes within an austenite grain and the crystallographic orientation of the laths within a packet, respectively [17]:
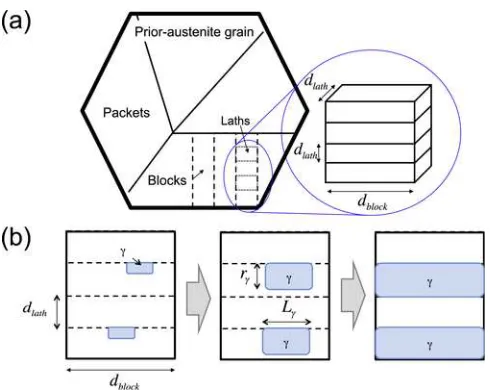
whereNp= 4 andNb= 6 are the number of packets in a PAG and number of blocks in a packet, respectively [29,30]. This has also been validated in a Fe 9Ni (wt%) martensite [28]. Fig. 1(a) shows a schematic representation of the hierarchical structure of lath marten-site; laths are the fundamental unit of thicknessdlathand lengthdblock.
[image:3.595.38.560.535.727.2]Lath boundary spacing is arranged in such form that it ensures complete relaxation of the crystallographic distortions during the phase transformation with the overall strain being pure dilatation [17,28]. This mechanism is controlled by dislocations forming in the laths in order to conceal the local distortions produced by impurity atoms [31]. This implies that the dislocation and lattice strain energy in a lath should be equal. If the lath boundaries are formed by dislo
Table 1
Chemical composition (in wt%) of the steels tested in this work.
Steel Ni Mn Co Cr Al Ti Mo Cu C Author
PH13 8Mo 8.2 – – 12.7 1.1 – 2.2 – 0.03 [3,14,19]
C300 18.8 – 8.5 – 0.12 0.75 4.75 – – [20]
M350 18.9 – 0.22 – 0.05 1.9 4.1 – 0.0037 [21]
5Mn 0.3 5 – – 0.01 – 0.2 – .pdf0.04 [22]
Fe8Ni8Mn 8 8 – – – – – – – [24]
Fe12Ni6Mn 12 6 – – – – – – 0.006 [15]
LeanLAl 1.97 9.1 – – 0.155 1 1 – 0.0056 [23]
LeanHAl 2.98 8.76 – – 1.33 – – – 0.01 [23]
Lean7Mn 2 7 – – 1 1 1 – 0.03 [25]
Lean10Mn 2 10 – – 1 1 1 – 0.015 [25]
Lean12Mn 2 12 – – 1 1 1 – 0.02 [25]
AISI 301 6.5 1.29 – 17.3 – – – – 0.11 [83]
17-4 SS 3.94 0.52 – 16.24 – – – 3.3 0.049 [26]
Mar6 2.5 0.5 – – 0.6 – – 2.5 0.06 [7]
Mar7 2.5 1.5 – – 0.5 – – 2.5 0.06 [7]
Mar9 4 1.5 – – 1 – – 2.5 0.05 [7]
Mar11 4 3 – – 1.5 – – 3 0.05 [7]
Mar13 4 4 – – 1 – – 4 0.05 [7]
U
N
C
O
R
R
E
C
T
E
D
P
R
O
[image:4.595.41.286.59.254.2]O
F
Fig. 1.(a) Schematic representation of the hierarchical structure of lath martensite with laths of cuboidal morphology. (b) Mechanism of austenite reversion in lath martensite.
cation loops and they are assumed of cuboidal shape (Fig. 1(a)), the energy per unit volume required to nucleate an interfacial disloca-tion of length 4dlath(lath boundary perimeter) is given by Ref. [32]
, where ρis the lath dislocation density,
b= 0.286 nm is the magnitude of the Burgers vector,μ= 80 GPa is the shear modulus and the 1/4 factor accounts for the shared disloca-tion density on adjacent lath boundaries. On the other hand, the lat-tice strain energy produced during the phase transformation is
esti-mated by the Stibitz equation [17,33]:
, whereE= 211 GPa is the Young's modulus,ν= 0.3 is the Poisson
ratio,ε= 0.245 is the Bain strain [17,34], and the ratio
ac-counts for the localised distortions accommodated in the lath bound-ary area (Alath=wlathdlath, wherewlathis the thickness of a lath bound-ary), from an equivalent undistorted area in the prior–austenite phase ( ) [17]. For the case of Fe C steels,wlathwas found equal to the length of a Cottrell atmosphere inducing carbon segrega-tion at the lath boundaries [35]; for the case of maraging steels, we consider thatwlathequals the thickness of a dislocation distortion field and it has been experimentally estimated in Fe 9Mn (at%) to be wlath≈4 nm [36]. Combining these results,ρequals:
dlathdepends on the composition of the steel and it is related to the re-distribution of alloying elements into the lath boundaries. For the case of Fe C martensite, dlath was obtained by estimating the amount of carbon segregating to the lath boundaries in the form of Cottrell atmospheres [17]. Similarly, substitutional atom segregation to the lath boundaries and dislocations occurs in Fe Ni Mn marten-site during ageing [2,36–38], and these features could affect the val-ues ofdlathwith alloying content. However, small variations indlath have been observed in a variety of maraging steels with different
Ni and Mn content, even for tempered conditions [14,20,25,26,39]; this behaviour can be due to the relatively low lattice distortion and high solubility of substitutional atoms in Fe with respect to C atoms; hence, based on these experimental results, it is considered that dlath= 250 nm remains constant for all steels tested. For this case,
ρ ≈3.6×10¹⁴m−2, being this prediction consistent with experimental estimations in a stainless maraging steel [40]. The description of the grain boundary density of lath martensite in this section will allow us to describe the growth ofγin terms of theα′structure.
4. Reverted austenite kinetics
Reverted austenite nucleates at the lath and PAG boundaries [41], and growth is diffusion–controlled at a given ageing temperature [12,14]. Moszner et al. [42] have suggested that austenite formation in Fe Mn martensite follows the partitioning of Mn into the austen-ite nuclei, and the growth mechanisms are interface–controlled. This process is consistent with experimental evidence showing thatγ– sta-bilising elements partition into the lath boundaries [37]. Moreover, the growth of reverted austenite is controlled by the matrix as individual nuclei will grow around theα′laths [14].
Based on the previous results, the following mechanism for austen-ite evolution during ageing is proposed: γ nuclei form at the lath boundaries, where they grow into the lath interiors upon eventually transforming theα' laths intoγ. The thickness (rγ) and length (Lγ) of the austenite are restricted to occupy theα′lath size (dlath) and length (dblock), respectively. Fig. 1(b) shows a schematic representation of this process in a number of laths within a block (Fig. 1(a)). This mech-anism is valid if the equilibrium volume fraction is high enough to fully transform theα′laths into austenite; however, if the equilibrium volume fraction ofγ(fγ,eq) at a given ageing temperature is lower, then rγandLγare lower thandlathanddblockby a factor of ,
respec-tively [25]; this is to account for the growth restriction effect on each direction of the austenite laths. Since the phase transformation is in-terface–controlled, the thickness and length evolution ofγcan be pre-scribed by standard grain boundary kinetics equations [43]:
whereΓγis the interfacial energy between austenite and ferrite,Mis
the grain boundary mobility, and the 2dblock/dlathterm in accounts
for shape effects in particle growth [44]; the last term in both equations accounts for the growth restriction within the lath boundaries, where Lγincludes effects ofγformation at the PAGBs viadblock. The mobil-ity is dictated by grain boundary diffusion [43]:
where is the effective diffusion coefficient driving the transformation and is the lattice parameter of and it is con-sidered equal to 0.286 nm. The solution to equation (3) provides the (2)
(3)
U
N
C
O
R
R
E
C
T
E
D
P
R
O
O
F
evolution of an austenite unit within a single lath; the initial nucleus size is assumed to be . The volume fraction ofγis given by the ratio between the volume of transforming austenite ( ) and the volume
of an lath:
This equation provides a direct link between the size of the re-verted austenite and its volume fraction without the need of additional
parameters. It is interesting that when in equation
(3), the steady state values of rγ and Lγ equal and
, respectively; this shows that
reaching its equilibrium volume fraction during steady state. For the steels tested in this work,γ is controlled by additions of Ni, Mn and Cr which are combined with Fe to increase the volume fraction of austenite at a given ageing temperature. For the case of Al, Cu and Ti additions, it has been reported that their content in the re-verted austenite is significantly lower, as they mainly partition to in-termetallics forming before (underaging) thanγ(overaging). For in-stance, Schnitzer et al. [11] have reported in PH13 8Mo that the chemical composition in austenite is mainly composed by Fe, Ni and Cr, whereas Al content in theγis less than 1 at%. Similarly, in the Mar6–13 series (Fe Ni Mn Al Cu steels), Kapoor et al. [7] reported that most of the Al and Cu atoms partition to the inter-metallics, although no reverted austenite composition was reported for the conditions tested. As for molybdenum, it remains mostly in solid solution in during underaging, and later forming Mo–rich inter-metallics during overageing [45,46]. These results allow us simplify-ing the description for by approximating it to an effective inter-diffusion between andγof Fe, Ni, Mn and Cr [47]:
where xFe,i, xNi,i, xMn,i and xCr,i are the equilibrium concentrations of Fe, Ni, Mn and Cr in each phase ( ), respectively, and DFe,DNi,DMnand DCrare the diffusion coefficients of Fe, Ni, Mn and Cr in Fe, respectively.xFe,i, xNi,i,xMn,iand xCr,ivalues can be obtained using the CALPHAD software Thermocalc for a given composition and temperature, whereas the diffusion coefficient
val-ues are shown in Table 3, with . Diffusion
[image:5.595.308.561.87.225.2]parameters in ferrite are considered in this work due to the lack of information on interdiffusion in martensite. For the case of the in-terfacial energy, Rajasekhara and Ferreira [12] have found in AISI 301LN (Fe-6.5Ni–1.29Mn wt%)Γγ= 1.3 J/m2. Similar values (∼1 J/ m2) have also been reported for phase–field simulations on austenite to ferrite transformation [48,49]. However, Lange et al. [50] employed lower values (0.5–0.6 J/m2) to describe austenite→ferrite transfor-mation kinetics in Fe C steels. In all cases,Γγstrongly depends on chemical composition. For instance, Qian [25] has found experimen
Table 2
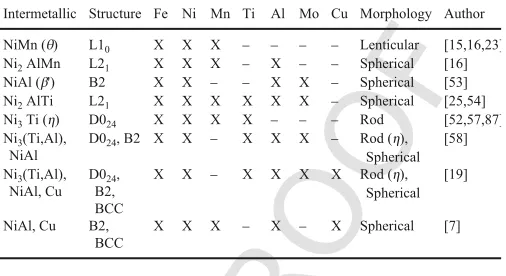
Intermetallics usually observed in multicomponent maraging steels.
Intermetallic Structure Fe Ni Mn Ti Al Mo Cu Morphology Author
NiMn (θ) L10 X X X – – – – Lenticular [15,16,23]
Ni2AlMn L21 X X X – X – – Spherical [16]
NiAl (β') B2 X X – – X X – Spherical [53] Ni2AlTi L21 X X X X X X – Spherical [25,54]
Ni3Ti (η) D024 X X X X – – – Rod [52,57,87]
Ni3(Ti,Al),
NiAl
D024, B2 X X – X X X – Rod (η),
Spherical [58]
Ni3(Ti,Al),
NiAl, Cu D024,
B2, BCC
X X – X X X X Rod (η), Spherical
[19]
NiAl, Cu B2, BCC
X X X – X – X Spherical [7]
tally that the kinetics ofγincrease with increasing Mn content; sim-ilarly, austenite reversion occurs faster in steels with high Ni addi-tions (18 wt%) [51], than for steels with lower Ni content (8.2 wt%) [14]. An empirical formula for the interfacial energy was obtained by adjusting it to the experimental data of the steels tested in this
work: J/m2; using this formulaΓγ
in AISI 301LN is estimated to be 0.62 J/m2. The description of austen-ite kinetics in terms of chemical composition and ageing conditions will allow relating these features to the total elongation in Section 8.
5. Precipitation kinetics
5.1. Compositional effects on intermetallic formation
Understanding the role of each alloying element in the structure of the formed intermetallics is key to elucidate their relative contribu-tion to mechanical properties. Table 2 shows typical intermetallics ob-served, as well as their morphologies, within different compositional ranges of multicomponent Co–free maraging steels for ageing temper-atures in the range 450–600°C1; the constituents of each multicom-ponent system are marked by an X. Cobalt was included in the initial developments of maraging steels as it reduces the solubility of Mo in-creasing the fraction of Ni3(Ti,Mo) [6] and promoting the precipita-tion of Fe2Mo (laves phase) [52]. However, the effect of cobalt on the mechanical properties can be compensated by increasing the content of Ti [5,6].
Nickel is one of the most important elements in maraging steels, as it is not only aγ–stabiliser element, but also the main constituent of several intermetallics forming in these steels. Similarly, Mn is a
γ–stabiliser element and can influence the content and structure of the forming intermetallics. For the ternary Fe Ni Mn system, or-dered face–centred tetragonal NiMn (θ) particles of lenticular shape form; Heo et al. [16] have reported that they transform into austen-ite after long ageing periods. He & Lee [24] observed that Al addi-tions in Fe Ni Mn promote the transition fromθto finely dis-persed Ni2MnAl; this effect also increases the strength of the steel [23]. Schober et al. [53] observed in Fe Ni Al Mo the for-mation of -NiAl.2Small additions of Ti partition into NiAl forming Ni2AlTi in Fe Ni Mn Al Ti when nickel content is low (≤4 wt%) [4,25,54], whilst very low amounts of Mn atoms partition into the precipitates. No Mo partitioning to NiAl and its variants in
1Although BCC-Cu is not an intermetallic phase, the same evolution descriptions
will be adopted for all precipitates. Hence, to simplify the notations they will also be referred to as intermetallics.
2Although this alloy contained 0.39 wt% of Mn, it was not enough to formθ intermetallics.
U
N
C
O
R
R
E
C
T
E
D
P
R
O
[image:6.595.38.554.85.135.2]O
F
Table 3
Diffusion parameters of the alloying elements for the steels tested in this work.
Element Fe Ni Mn Cr Al Ti Cu
D0(m 2
/s) 5×10⁻⁵ 1.4×10⁻⁴ 1.5×10⁻⁴ 8.5×10⁻⁴ 1.8×10⁻³ 2×10⁻³ 5.7×10⁻⁵
Q(kJ/mol) 240 245.6 233 250.6 233 242.6 244
Ref. [34] [88] [89] [90] [91] [92] [93]
Al–containing steels has been observed [23,25]. This shows that Ni and Al have strong interrelations as they tend to form B2 inter-metallics; Ti and Mn additions modify this structure by transitioning into L21precipitates, and when both elements are added, Ti has pref-erence to form Ni2AlTi.
Ti additions to the Fe Ni Ti Mo system promote the for-mation of rod–shaped Ni3Ti (η) in high–Ni containing steels, show-ing an apparent higher strength than the Al–containing steels at lower ageing temperatures [23,25]. Mo additions to this system in Co–free alloys promote the formation of the laves phase Fe2Mo; however, Tewari et al. [45] showed that Fe2Mo intermetallics form at temper-atures below 500°C and after 100 h of ageing due to the low diffu-sivity of Mo in Fe. Hence, they concluded that only theηparticles contribute to the peak hardness in Fe 18Ni Ti Mo (wt%). Al-though it has been suggested that Mo contributes to the formation of Ni3(Ti,Mo) in Co–free alloys [55], experimental evidence shows that only small amounts of Mo partition intoη[52]; moreover, simi-lar peak hardnesses have been measured in Fe 18Ni–2.6Ti Mo (wt%) containing different Mo contents [56], indicating no increase in theηvolume fraction. Additions of Mn up to 3.5 wt% do not modify the structure of Ni3Ti [57].
When increasing the number of alloying elements, Leitner et al. [58] found in the Fe Ni Al Ti Mo Cr system that both Ni3(Ti,Al) and NiAl particles form simultaneously; however, Ni3(Ti,Al) nucleation was only possible due to the higher Ni content in the alloy (9 wt%). Moreover, when Cu is added to the Fe Cr Ni Al Ti Cu system, Schnitzer et al. [19] have found that Ni3(Ti,Al) forms at the interface between the matrix and Cu clusters. BCC-Cu precipitates evolve to a twinned 9R structure until they ul-timately transform to an equilibrium FCC structure after long age-ing times [59]. Similarly, Kapoor et al. [7] have shown that the yield strength can increase up to 1.6 GPa in Fe Ni Mn Al Cu by systematically increasing Cu and Al content to precipitate Cu clusters and Ni2AlMn.
In summary, there are four intermetallic systems for study in the typical compositional range of maraging steels: 1) NiMn forms in the Fe Ni Mn system. 2) NiAl and variants form when adding Al in
Fe Ni Al, Fe Ni Mn Al and Fe Ni Mn Al
Ti. 3) Ni3Ti forms by Ti additions in Fe Ni Ti and in Fe Ni Ti Al if Ni content is high enough. 4) Cu additions promote the formation of BCC clusters that will form independently from other in-termetallics. These results allow us to describe precipitation behaviour on each particle system and determine their individual contribution to the hardness for each alloy tested.
5.2. Modelling precipitation kinetics
A mean radius approach is adopted for describing the evolution of each intermetallic species. This includes employing classical nucle-ation theory to estimate the nuclenucle-ation rate and Zener's law to describe growth kinetics [60,61]. Additionally, since grain boundary embrittle-ment occurs during underaging, the analysis is focused on precipita-tion behaviour in the vicinity of the peak hardness and during overag-ing, hence classical coarsening laws are also included.
Multiple species of precipitates are considered, including single (Cu) and multicomponent systems with 2 (NiAl, NiMn, Ni3Ti) and 3 (Ni2AlTi, Ni2AlMn) constituents. In order to use the same formal-ism for all intermetallics and simplify the analysis, modelling of sin-gle–component precipitation is assumed, where the constituent with the slowest diffusivity in Fe controls the evolution kinetics [62],i.e. the diffusion coefficient (Dp) during nucleation, growth and coarsen-ing equals the diffusion coefficient of the constituentj holding the
lowest ratio [63], wherexj,pis the equilibrium concentration in
the intermetallicpandDjis the diffusion coefficient ofjelement in Fe. For instance in NiAl,xNi,p=xAl,p= 0.5, and in Ni3Ti,xNi,p= 0.75 andxTi,p= 0.25. Table 3 shows the diffusion parameters of the rele-vant constituents showing that, for the range of temperatures tested (400–575°C), the diffusion coefficient of Ni controls the kinetics of NiMn, Ni3Ti, NiAl, Ni2AlMn and Ni2AlTi. This simplification has been applied to multicomponent particles in Ni–and Fe–based alloys [62–64].
The nucleation rate of new particles is given by Ref. [60]:
where N0 are the potential nucleation sites for precipitation,
, and are
con-stants dictated by the particle's molar volumeVm, critical radius for nucleation , interfacial energyγpand instantaneous concentration of the constituentjin the matrix towards forming the precipitates . In maraging steels, dislocations are ideal sites for precipitation nu-cleation due their high density [65].3Hence, the number of nucleation sites (m−3) for precipitation is given by Ref. [44]: .
The critical radius dictates the minimum size to reach the critical energy for nucleation and it is given by Ref. [61]:
whereKeqis a constant related to the solubility product of in the matrix with respect to the intermetallic phase (p) [61].
3ρalso includes possible precipitation around lath boundaries (Section 3). (7)
U
N
C
O
R
R
E
C
T
E
D
P
R
O
O
F
Particle growth is given by Zener's law [61]:
wherexj,intis the concentration of elementjat the matrix/particle in-terface and it is given by the Gibbs–Thomson relation [66]:
represents the effective concentration ofjin diffusing towards formingp; however, the equilibrium volume fraction ofpis limited by the constituent with the lowest concentration (x0) diffusing to the
par-ticle. For instance, the volume fraction of NiAl in Fe 8Ni 2Al (at%) is limited by Al (although Ni is controlling elemental interdif-fusion), as there are less Al atoms available to form the intermetal-lic phase [11]; this implies that , withx0= 2 at%
be-ing the initial value for . For Ni3Ti,x0can be obtained using the CALPHAD software Thermocalc, by estimating the effective concen-tration of Ti diffusing to the particle:x0=xTi,pfp,eq= 0.25fp,eq, where fp,eqis the predicted equilibrium volume fraction of Ni3Ti at a given composition and ageing temperature. However, for NiMn, NiAl, Ni2 AlMn, Ni2AlTi, and Cu, these phases are not predicted in the
equi-librium phase diagrams of the respective systems, as some of these phases are metastable [16,59]. Nevertheless,x0can be computed by using the lever rule [67]. For instance, in NiMn, x0= min(xNi,xMn), where the min function limits the increase in the particle fraction by the constituent with minimum content; similarly for Ni2TiAl, it gives ; the second min function is to account for gradual transition from B2 to L21[68].
The particle number density (Np) and radius (rp) are obtained by combining equations (7), (9) and (10), whereKeqis the only fitting pa-rameter. The volume fraction is then given by:
where the term accounts for the effective increment in the volume
fraction when the constituentjdiffuses topin a multicomponent in-termetallic [60].
As particles form, the content of each constituent (j) in the matrix decreases until reaching an equilibrium concentration according to:
wherexjis the atom fraction of elementjin the steel.
Large particles coarse at the expense of the smaller ones and equa-tion (8) dictates that particles with size below are unstable, under-going dissolution. Thus, since increases during growth, the tran-sition from particle growth to coarsening occurs when the equilib-rium volume fraction is reached and . The mean radius during coarsening is given by:
wherer0is the initial radius in the coarsening step andkpis given by Ref. [44]:
Once the phase fraction reaches equilibrium, the particle number density decreases due to coarsening (overaging), according to the
re-lation [69]: . It is worth noting that additional
expres-sions have been proposed to account for a“smooth”transition4 be-tween growth and coarsening [60,70]. These are usually fitted in the form of exponential decay or power laws of the ratio between and rp. However, they require introducing a number of fitting parameters, thus they are not included in the models to simplify the descriptions.
For the non–spherical intermetallics tested (NiMn and Ni3Ti), the average aspect ratio (ar) between their length (lp) and diameter (2rp) has been measured to be almost constant:arfor Ni3Ti has been found to be≈4.5 [20], whereas for NiMnaris approximately 3 [71]. Hence, the relationlp= 2arrpis adopted. Additionally, the particle volume in equation (11) is modified to include this effect infpandNp, becoming
and (during coarsening).
The required parameters for each intermetallic arefp,eq,γpandKeq; the latter is fitted equal toKeq= 0.0001 in all cases. As for the interfa-cial energy in NiMn, it is assumed to beγNiMn= 0.2 J m−2. For NiAl,γp
has been estimated to be 0.02 J m−2in Fe–Ni–Al–Mo [72]; however, the kinetics of NiAl and variants increase with Mn content [25]; hence, based on the effect of Mn in NiMn and austenite reversion, the fac-tor exp(7xMn) is added to the interfacial energy:γNiAl= 0.02exp(7xMn) J m−2; For Ni2AlMn and Ni2AlTi, the interfacial energy is assumed to beγNi2AlMn=γNi2AlTi= 0.1exp(7xMn) J m−2. The interfacial energy of Ni3Ti is estimated to be [20]:γNi3Ti= 0.2 J m−2. For Cu clusters mul-tipleγCu values have been proposed [73,65];γCu= 0.02 m−2is con-sidered in this work. The molar volumes of NiMn, NiAl and vari-ants, Ni3 Ti and Cu are 7.3×10⁻⁶m3/mol [74], 10−6m3/mol [75], 9×10⁻⁶m3/mol [20] and 7×10⁻⁶m3/mol [75], respectively.
These results provide descriptions with a direct link between the microstructure evolving during ageing and chemical composition. This will allow us to integrate microstructure–based models for yield stress in different steels.
6. Strengthening mechanisms in maraging steels
The yield strength of maraging steels accounts for three contri-butions [17]: 1) the strength of lath martensiteσMart, 2) precipitation hardening of a number of intermetallicsσpand 3) solid solution hard-eningσss. It is assumed that the reverted austenite has no effect in the
4Since the growth and coarsening equations in 9 and 13 evolve according to∼t1/2 and∼t1/3, respectively, a sharp variation inrpcan be observed at the transition
when .
(9)
(10)
(11)
(12)
(13)
U
N
C
O
R
R
E
C
T
E
D
P
R
O
O
F
strength of the steels [18]. This is expressed in terms of the Vickers hardness as:
The strength of the martensitic matrix is controlled by the increase in grain boundary area and dislocation density. The block size is con-sidered as the“effective”grain size and grain boundary strengthen-ing is expressed in terms of a Hall–Petch equation fordblock[17,76], whereas the Taylor equation accounts for the strengthening contribu-tion of the increase in the dislocacontribu-tion density.σMartequals [17]:
whereM= 2.5 is the Taylor orientation factor.
Schnitzer et al. [77] have tested in PH 13-8 Mo a number of models describing dislocations–particle interactions, including particle shear-ing (Friedel formula), Orowan bypassshear-ing and a pile–up model pro-posed by Ansell and Lenel [78]. The latter is based on the assumption that yielding occurs when a critical number of dislocations pile–up reaching the threshold stress to plastically deform the particles. Only the Orowan and pile–up models were able to reproduce the experi-mental trends for underaging, peak hardness and overaging. However, experimental observations in other materials with intermetallics of similar crystal structures do not report traces of dislocation pile–up at the particle's interface nor anti–phase boundary formation [79]. Since Friedel formula and the Orowan equation hold similar values for un-deraged conditions [77], it will be assumed thatσpis dictated by the Orowan equation to simplify the analysis:
This equation is valid for spherical particles where 2rprepresents the extent of particle bypass; however, Ni3Ti and NiMn have rod–like shape with constant aspect ratio (a) between its length lpand thick-ness (2rp); this morphology can increase the applied stress for dis-locations to bypass particles, as they will have to cover an addi-tional area; this is dictated by the relative orientation between the slip direction and particle alignment. Nevertheless, an equivalent
circu-lar particle of same area can be defined with radius
. Thus, the ratio ρp/rp dictates an effective increase of the bypass length without identifying specific alignments between the particle and a dislocation, and the applied stress for dislocations to bypass rod–shaped particles can be assumed to increase according to this
ra-tio: .
Ardell [80] has shown that when multiple species of precipitates are present, the total particle strengthening is given by the superposi-tion of their individual contribusuperposi-tions:
whereσjis the strength increase by an intermetallicjwith volume fraction and radiusfjandrj, respectively (equation (17)). This equation is also consistent with the lower strengthening effect produced when distinct precipitates form at the interface of other intermetallics [7], as their individual contribution is lower than if they form separately.
Solid solution strengthening is obtained with Fleischer's equation estimating the increment in the critical resolved–shear stress due to the presence of substitutional solute atoms [81,82]:
, where is the atom fraction of
substitu-tional element i in the matrix and βi is the strengthening constant related to the lattice and modulus mistift of elementiwith respect to iron.βivalues have been obtained in previous work [17,81], and are shown in Table 4. Ti and Mo induce the highest solid solution strengthening effect, whereas Al, Cu and Mn have the lowest contri-butions. The solid solution hardening effects of the particle–forming elements (Ni, Al, Mn, Ti, Cu) decreases as the volume fraction of the particles increases; this transition is obtained by a mass balance
equa-tion, where the solute content in is: , where
fjis the volume fraction of particlejandxi,iits the equilibrium concen-tration of elementiinj.
For a prior–austenite grain size of 20μm, σMart= 450 MPa, whereas for the alloys tested, σss values range between 300 and 500 MPa. This gives the initial hardness to be in the range 250–330 Hv, being these predictions in agreement with experimental estima-tions for the hardness in as–quenched conditions [3,20,25,26].
7. Results
The model results on the hardness at room temperature, reverted austenite and intermetallic evolution are tested against experimen-tal measurements in several maraging steels (Table 1). This is done by solving equations (((3), (5), (9), (11), (13) and (15) for a given composition and ageing temperature. An initial particle radius of r0= 0.285 nm is assumed in all cases. The input parameters of the models are the nominal composition, ageing temperature, and prior–austenite grain size. MATLAB scripts with the solution of all models are included as supplementary material. Results on reverted austenite evolution are tested first to show how Ni and Mn affect mi-crostructure evolution.
Fig. 2 shows the model predictions and experimental measure-ments of the reverted austenite evolution with time at different age-ing temperatures in PH13 8Mo, including (a) volume fraction, (b) thickness and (c) length.Dg= 25μm was measured, whereas measure-ments reportfγ,eq= 0.2 and 0.3 at 525°C [3] and 575°C [14], respec-tively,xNi,γ= 0.17,xNi,α= 0.045,xCr,γ= 0.12,.xCr,α= 0.145The model shows good agreement with experiments in all cases. fγ and rγ in 5Mn aged at 650°C are also shown in (a) and (b), respectively; for
5Elemental partitioning in αis subtracted from Thermocalc and it is assumed equal than in .
(15)
(16)
(17)
U
N
C
O
R
R
E
C
T
E
D
P
R
O
[image:9.595.35.290.85.117.2]O
F
Table 4
Solid solution strengthening constants.
Element Ni Mn Cr Al Ti Mo Cu
βi(MPa/at) 708 540 622 196 2628 2362 320
[image:9.595.102.495.393.703.2]this case, Dg was assumed to be 20μm as this value was not re-ported, and fγ,eq= 0.33, xMn,γ= 0.098, xMn,α= 0.001, xNi,γ= 0.00626 andxNi,α= 0.001 were estimated using Thermocalc; the model predicts a higher volume fraction in 5Mn, however theγsize is close to the experimental values; the discrepancies can be due to higher volume fraction predicted in Thermocalc, as equilibrium has been reached for this condition. Fig. 2(d) shows additional results in the trans-formation at high temperatures of cold–rolled AISI 301 and reverted austenite kinetics of M350. The lath thickness of AISI 301 was re-ported to be 170 nm [83], anddblock= 170 nm was considered due to the heavily deformed structure;fγ,eq= 1 for all temperatures tested. For M350 an initial 5% of retained austenite is assumed, whereas fγ,eq= 0.64,xNi,γ= 0.24 andxNi,α= 0.042 were estimated using Ther-mocalc;Dg= 20μm was assumed, as this value was not reported. The model also shows very good agreement in both steels. These results indicate that equations (3) and (5) successfully describe trans-formation kinetics for Fe Ni–and Fe Mn–based steels.
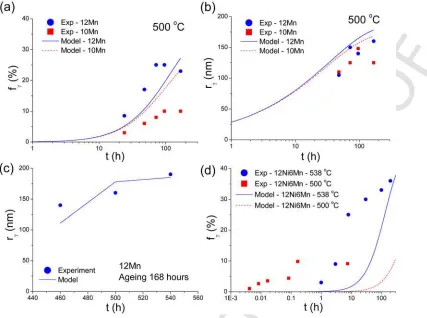
Fig. 3 shows the combined effects of Ni and Mn on the kinetics of reverted austenite in Lean10Mn and Lean12Mn, including (a) volume fraction, thickness at (b) 500°C and (c) at various temperatures. The prior–austenite grain size is 30μm [25]. The parameters for (a) and (b) in Lean10Mn are (Thermocalc)fγ,eq= 0.33,xNi,γ= 0.05,
xMn,γ= 0.25, xNi,α= 0.001 and xMn,α= 0.03, whereas for Lean12Mn fγ,eq= 0.41; elemental partitioning is approximately constant for all conditions. In (c),fγ= 0.35 and 0.5 at 460°C and 540°C, respectively. The model underpredicts the growth rate in Lean10Mn; the discrep-ancies can be due to a stronger effect of Mn additions in theΓγ. Nev-ertheless, these results show that additions of Mn in the steels not only increase the volume fraction of reverted austenite, but they can also accelerate γ growth at a given temperature. Additionally, Fig. 3(d) showsfγresults in 12Ni6Mn, where higher austenite fraction is measured at lower times; these discrepancies can be due to the pres-ence of retained austenite in the steel, however this was not confirmed experimentally; additionally for 12Ni6Mn aged during the first 10 h, the X-ray measurements ofγreported in Ref. [15] can also be due to the formation NiMn (fct) precipitates (Fig. 3(d)), hence increas-ing the apparent values offγduring underaging. The parameters for 12Ni6Mn arefγ= 0.37 and 0.45 at 500°C and 538°C, respectively, whereasxNi,γ= 0.25,xMn,γ= 0.15,xNi,α= 0.02 andxMn,alpha= 0.001 at 500°C andxNi,γ= 0.22,xMn,γ= 0.12,xNi,α= 0.02 andxMn,α= 0.001 at 538°CDg= 20μm was assumed in both cases as these values were not reported.
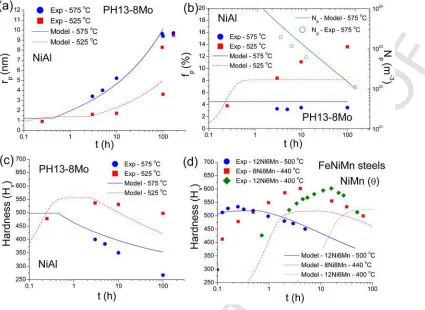
To explore the role of Al and Mn additions on intermetallic be-haviour, Fig. 4 shows the model predictions in PH13 8Mo contain-ing NiAl intermetallics and their comparison with experimental data for (a), (b) precipitation and (c) hardness evolution; the Al content of this steel at 525°C and 575°C is 2 and 1.5 wt%, respectively [3,19]. Dg= 25μm was considered [19]. The initial hardness is given by the martensite strength (σMart) and solid solution hardening (σss). The model shows very good results in almost all cases, confirming good correlation between the hardness and the predicted kinetics of NiAl.
U
N
C
O
R
R
E
C
T
E
D
P
R
O
[image:10.595.100.527.64.382.2]O
F
Fig. 3.Reverted austenite evolution in Lean7Mn, Lean10Mn and Lean12Mn at different temperatures, including (a) volume fraction and (b) thickness; (c)rγevolution in Lean12Mn
at various temperatures. (d) Effect of Mn infγevolution in two maraging steels.
Although lower volume fraction is predicted at 525°C, the growth and coarsening rates are consistent with the experiments. The peak hard-ness at 525°C (Fig. 4(c)) in this alloy is achieved a few hours after the equilibrium fraction is reached due to particle growth still occurring (Fig. 4(b)); the particles coarse and decrease the number density of in-termetallics (Fig. 4(b)) in the overaging conditions. Fig. 4(d) shows the hardness predictions and experimental measurements inθ– con-taining Fe Ni Mn steels;Dg= 30μm was assumed as no PAG size values were reported. The model is able to reproduce experimen-tal observations at 500°C, indicating that the predicted strengthening of NiMn particles are consistent with experimental data, as well as in predicting the hardening mechanisms in maraging steels; the discrep-ancies in growth kinetics at 400°C and 440°C can be due to temper-ature variations in the interfacial energy or due to a different structure formed in the steel; however no information was provided on the ini-tial martensitic structure. It is worth noting that the ageing conditions in (d) correspond to the conditions shown in Figs. 2 and 3 for the re-verted austenite kinetics in PH13 8Mo and FeNiMn steels, respec-tively. This shows that the models are successful in correlating varia-tions in microstructure and hardness.
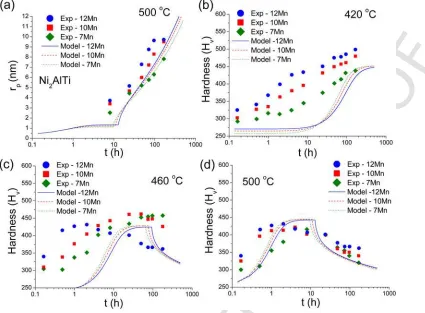
Fig. 5 shows results in Lean7Mn, Lean10Mn and Lean12Mn, where Ni2AlTi precipitates form. Fig. 5(a) shows the size evolution of Ni2AlTi for different Mn content, where it is confirmed that also Mn accelerates the growth of these particles, however a weaker effect is predicted. Nevertheless, it is predicted that coarsening occurs after 10 h Fig. 5(b), (c) and (d) show the hardness variation in these steels at different temperatures. At 420°C, it takes more than 100 h to reach the peak hardness in all cases due to the slow kinetics. Similarly, at
460°C Lean7Mn reaches the peak hardness after 100 h, whereas Lean10Mn and Lean12Mn reached the peak hardness after∼50 and
∼2 hours, respectively. However, the model underpredicts the hard-ness during underaging; these discrepancies can be due to the par-tial formation of NiMn, especially with higher Mn content, which can later transition to Ni2AlTi [24], or due to the interdiffusion of addi-tional elements to the intermetallic increasing the values ofrduring early stages of precipitation [25]. Nevertheless, the model describes the experimental trends in the peak hardness values and overaging. Fig. 5(d) shows Hvat 500°C, where the peak hardness is reached in all cases within 2–10 h, due to the rapid diffusion kinetics at high tem-peratures. This is also consistent with the increased kinetics in austen-ite reversion in Lean10Mn and Lean12Mn shown in Fig. 4. The model overpredicts (underpredicts) the experiments by 50 Hvduring overag-ing (underagoverag-ing), although it shows good agreement in the hardenoverag-ing (softening) rates; these discrepancies can be due to a lower volume fraction of Ni2AlTi not being considered, or due to interdiffusion of additional elements. Figs. 4 and 5 show complete microstructural de-scription and its correlation with strength in Lean7Mn, Lean10Mn and Lean12Mn during heat treatment.
U
N
C
O
R
R
E
C
T
E
D
P
R
O
[image:11.595.101.526.65.375.2]O
F
Fig. 4.Results on intermetallic formation and strengthening in PH13 8Mo: (a) mean particle radius, (b) volume fraction and number density and (c) hardness evolution. (d) Hard-ness evolution inθ–containing Fe Ni Mn steels.
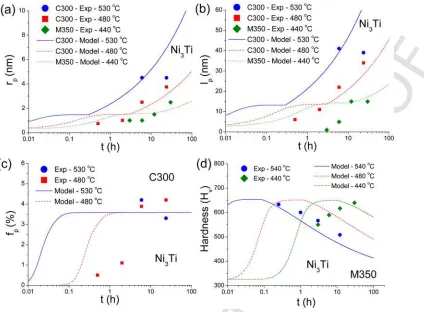
comitant variations in hardness showing the effects of precipitation and solid solution hardening in M350. In all cases the correlations between the models and experiments show good results, exceptfpat 440°C andHvat 480°C, where slowerηkinetics are reported. This can be due to variations in the interfacial energy with temperature. Ti contributions during underageing stem from solid solution harden-ing and transition to precipitation hardenharden-ing when Ni3Ti form at peak hardness and during overaging. It is interesting noting that these steels show apparent higher peak hardness than their Al–containing coun-terparts (PH13 8Mo) in spite of having lower volume fraction; this is due to their rod–shape morphology increasing the critical–resolved stress for dislocations to bypass the particles.
8. Discussion
A theoretical framework for prescribing microstructure and strength evolution in maraging steels has been proposed. It is based on describing the hierarchical structure of the martensitic matrix, includ-ing the density of dislocations, laths, and high–angle grain boundaries. This microstructural landscape allowed introducing evolution equa-tions for lath–shaped austenite, as it mostly forms at the lath bound-aries, restricting their growth within a martensite lath. The prescrip-tion of the dislocaprescrip-tion density provided the number density for in-termetallic particles nucleation, where classical theories for precipita-tion nucleaprecipita-tion, growth and coarsening where employed to describe the mean particle size and volume fraction. These results were com-bined to describe the evolution of the room–temperature hardness due to precipitation hardening under various ageing conditions in Fe Ni–, Fe Mn–and Fe Ni Mn–based maraging steels. Pre
cipitation parameters for each kind of intermetallic and reverted austenite were obtained from the literature and validated with experi-ments. These results show that the modelling methodology is able to describe microstructure and hardness in several maraging steels when modifying their chemical composition. This allows us to assess the in-dividual contribution of alloying elements typically included in com-mercial steels. Moreover, the predictions on reverted austenite forma-tion can also help us to design steels and heat treatments for increasing the ductility.
U
N
C
O
R
R
E
C
T
E
D
P
R
O
[image:12.595.100.525.66.379.2]O
F
Fig. 5.Results on intermetallic formation and strengthening in Lean7Mn, Lean10Mn and Lean12Mn. (a) particle radius, and hardness evolution at (b) 420°C, (b) 460°C, (b) 500°C.
8.1. Elemental optimisation: alloying contributions to strength
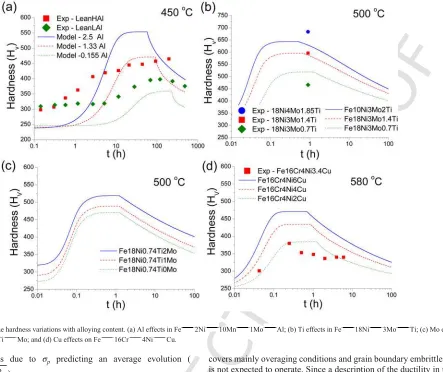
Results in the previous section showed how distinct intermetallics contribute to the total strength of commercial steels. However, it is also interesting to explore how the hardness changes when modify-ing the alloymodify-ing content of each element. Fig. 8(a) shows Al effects on Fe 4Ni 10Mn 1Mo Al (wt%) when ageing at 450°C and forming Ni2 AlMn; experimental results of two lean maraging steels with similar compositions are also shown (Table 1); LeanLAl contains 1 wt% of Ti, hence increasing the initial hardness by 50 Hv. Dg= 30μm was considered. The model shows good agreement with the experimental observations, showing an increase of∼200 Hvwhen the Al content increases from 0.15 to 2.5 wt%. This is due to the in-crease in the volume fraction of Ni2AlMn increasing precipitation strengthening effects. Fig. 8(b) shows the effects of Ti additions in the Fe 18Ni 3Mo Ti (wt%) system aged at 500°C;fNi3Ti,eq are estimated to be 0.093, 0.063 and 0.03, when adding 0.74, 1.4 and 2 wt% of Ti, respectively.Dg= 20μm was assumed. Experimental peak hardness are also shown in a number of 18Ni Ti Mo steels containing similar Ti and Mo additions [6]. The model results show good agreement with experimental trends. Moreover, the increase in hardness when increasing Ti content is more pronounced than Al. This is illustrated by comparing Fig. 8 (a) and (b), where the hardness in the Fe 18Ni 3Mo Ti system increases up to 650 Hvwith Ti additions of 2 wt%, whereas for the Fe 4Ni Mn Al it only in-creases up to∼500 Hvwith Al additions of 2 wt%; however, higher Ni content is required to form Ni3Ti. Fig. 8(c) shows the effects of
Mo in the Fe 18Ni–0.74Ti Mo system, where the hardness in-creases from 470 to 525 Hvwhen adding up to 3 wt%; the Mo contri-bution is lower as it mostly remains in solid solution. Fig. 8(d) shows the hardness evolution when increasing Cu content in the Fe 16Cr 4Ni Cu system aged at 580°C; experimental results in 17-4 SS (Fe–16.24Cr–3.94Ni–3.4 Cu wt%) are also shown for comparison, where Cu precipitates have the main strengthening contribution [27]; Dg= 50μm was estimated from Ref. [26]. The model shows an in-crease in hardness up to 475 Hvwhen adding 6 wt% of Cu, showing significantly lower strengthening than in previous cases; this is due to the increase in the volume fraction of Cu particles with Cu additions is lower (1 at% of copper is equivalent to 1% volume fraction). These results demonstrate that Ni3Ti induce the highest strengthening effect, followed by NiAl and variants, and Cu clusters display the weakest ef-fect.
U
N
C
O
R
R
E
C
T
E
D
P
R
O
[image:13.595.102.526.62.374.2]O
F
Fig. 6.Results on Ni3Ti formation and strengthening in C300 and M350: (a) particle radius and (b) length; (b) phase fraction evolution, and its (d) corresponding hardness.
Fig. 7.Relative contribution to strengthening in (a) M350 and (b) PH13 8Mo.
lustrate their relative contribution, Fig. 9(b) and (c) show the par-ticle radius and number density increments in Mar11, respectively, showing good results in the growth and coarsening rates; although a higher number density is predicted, the variation inNpfor both kind of precipitates is well described; the discrepancies can be due to a lower dislocation density induced by lower alloying concentrations, or
lower elemental partitioning effects. Fig. 9(d) shows the individual contribution of Ni2AlMn and BCC-Cu to the hardness in Mar11 (σss
andσMartare also added to each prediction); Ni2AlMn particles have higher strengthening than BCC-Cu; the peak hardness in Cu occurs∼
U
N
C
O
R
R
E
C
T
E
D
P
R
O
[image:14.595.98.541.64.436.2]O
F
Fig. 8.Analysis on the hardness variations with alloying content. (a) Al effects in Fe 2Ni 10Mn 1Mo Al; (b) Ti effects in Fe 18Ni 3Mo Ti; (c) Mo effects in Fe 18Ni–0.74Ti Mo; and (d) Cu effects on Fe 16Cr 4Ni Cu.
hardness; this is due to σp predicting an average evolution (
).
8.2. Elemental optimisation: ductility VS strength
An interesting aspect of this work is to correlate the strength/duc-tility tradeoff with alloying content and ageing time. For instance, in PH13 8Mo the peak hardness when ageing 525 and 575°C is achieved between 2 and 10 h (Fig. 4(c)), whereas full transformation of austenite is achieved after 70 h (Fig. 2(b)); the hardness then de-creases to 300 Hv. Nevertheless, Schnitzer et al. [14] reported an in-crease in the total elongation from 11% (as–quenched) up to 20% af-ter the austenite forms. Similar results have been reported in other steels [15,25]. Thus, there is an apparent link betweenγincrease and elongation. To further support this, a number of experimental ob-servations linking the volume fraction of reverted austenite and to-tal elongation (El) in overaging conditions are shown in Fig. 10(a). These data cover different Ni and Mn contents and ageing tempera-tures; they were obtained from Refs. [14,25,26,84–86]. It is interest-ing notinterest-ing that whenfγ= 0 (and when no grain–boundary embrittle-ment occurs), the elongation lies within 7–10%, and it increases as fγincreases. It is worth noting that this correlation does not rule out the fact that other mechanisms can control ductility in these steels, such as dislocation evolution in the martensite, precipitation structure and grain boundary processes. Nevertheless, the aim of this section is to correlate microstructure evolution (reverted austenite) with ductil-ity, based on experimental information collected in Fig. 10(a), which
U
N
C
O
R
R
E
C
T
E
D
P
R
O
[image:15.595.101.528.66.388.2]O
F
Fig. 9.Strengthening analysis when multiple precipitation occurs in Fe Mn Ni Al Cu. (a) Variations in the hardness for various compositions; (b) mean particle radius and (c) number density in Mar11. (d) Individual strengthening contribution in Mar11 from Ni2AlMn and Cu precipitates.
show the lower limit of this region. Similar calculations can be done under different ageing conditions.
It also is possible to assess the strength/ductility tradeoff during overageing for alloy design strategies. Fig. 10(d) shows the yield stress and ductility variations during overaging in M350, PH13 8Mo and 17-4SS, for different ageing times up to 500 h at 550°C; Additionally, a variant of M350 containing 4 wt% of Mn and only 14.9 wt% of Ni is shown with the remaining alloying additions be-ing held constant; the fraction of Ni3Ti decreases to 3.5% in this case. These lines are obtained by estimating the variations inσYwhen fγ> 0 and using previous formula for the total elongation.Dg= 20μm is assumed in all cases, whereas the parameters forγare taken from the previous section. It is clearly seen how the strength drops dras-tically once the reverted austenite forms in all cases, i.e. when the elongation increases; M350 is the only alloy with yield strength above 1200 MPa to reach total elongation of 20%. 17-4 SS is the weakest alloy, as it contains Cu particles and the low Ni content decreases the fraction of reverted austenite, therefore having the lower yield stress and elongation, and requiring longer times to reach peak hard-ness; the conventional inverse strength–elongation relationship does not hold for all ageing times, as the time to form BCC-Cu precipi-tates is of the same order of magnitude than the time when the re-verted austenite forms at this temperature, hence a small increment in elongation and hardness is predicted, however no experimental vali-dation was possible. It is interesting noting that the modified M350 does not change the variation between the strength and elongation, however the strength decreases by∼100 MPa due to the lower inter-metallic volume fraction. This alloy represents a good alternative to replace M350 at a lower cost if the strength and ductility required are
1200 MPa and greater than 20%, respectively, displaying similar strength/elongation relationship than PH13 8Mo. However, it can be stronger by 150 MPa.
9. Conclusions
The following concluding remarks are summarised:
• A physics–based modelling framework for the microstructure and mechanical properties in maraging steels has been introduced. A critical assessment of typical alloying elements controlling the hard-ness and total elongation was performed.
• Descriptions for the lath–shaped reverted austenite and inter-metallics were possible due to the characterisation of the hierarchi-cal structure of the martensitic matrix. This includes prescribing the dislocation density, lath and high–angle boundary size.
• Reverted austenite kinetics promoted by Ni and Mn additions were described using grain–boundary diffusion laws within a lath unit. Mn had stronger effect than Ni on increasing the growth rate and volume fraction.
• Descriptions for particle nucleation, growth, coarsening and volume fraction evolution were identified for Ni3Ti, NiAl and its variants, and BCC–Cu clusters. The dislocation density provided the prefer-ential nucleation sites for precipitation.
• Ti additions have the highest strengthening effect by precipitating Ni3Ti; however high Ni content is required. Al additions also con-tribute to the strength without the need to increase Ni content by forming B2 and L21intermetallics. Cu has the lower strengthening
U
N
C
O
R
R
E
C
T
E
D
P
R
O
[image:16.595.99.525.63.370.2]O
F
Fig. 10.Elongation analysis in maraging steels: (a) Correlation betweenfγand total elongation. Contour plots of (b)γequilibrium fraction at 550°C and (c) expected elongation for
different Ni and Mn contents when ageing at 550°C for 100 h. (d) Strength/ductility variations in various grades when ageing up to 500 h.
• A relationship between the reverted austenite and the total elonga-tion in overaging condielonga-tions was found. This result not only allowed comparing the relative strength of different steels but also their duc-tility. Thus, a complete modelling suite for alloy design based on microstructure description was postulated.
Acknowledgements
This research was supported by the grant EP/L025213/1 from the UK Engineering and Physical Sciences Research Council (EPSRC). E.I. Galindo-Nava and P.E.J. Rivera-Díaz-del-Castillo are grateful to Prof. Mark Blamire for the provision of laboratory facilities. 1.
Appendix A. Supplementary data
Supplementary data related to this article can be found at http://dx. doi.org/10.1016/j.actamat.2016.07.020.
References
[1] S. Nedjad, M. Ahmadabad, T. Furuhara, Correlation between the inter granular brittleness and precipitation reactions during isothermal aging of and Fe-Ni-Mn maraging steel, Mater. Sci. Eng. A 490 (2008) 105–112.
[2] N. Heo, Ductile-brittle-ductile transition and grain boundary segregation of Mn and Ni in an Fe-6Mn-12Ni alloy, Scr. Mater. 34 (1996) 1517–1522. [3] H. Leitner, M. Schober, R. Schnitzer, S. Zinner, Strengthening behavior of
Fe-Cr-Ni-Al-(Ti) maraging steels, Mater. Sci. Eng. A 528 (2011) 5264–5270. [4] D. Raabe, D. Ponge, O. Dmitrieva, B. Sander, Designing ultrahigh strength
steels with good ductility by combining transformation induced plasticity and martensite aging, Adv. Eng. Mater. 11 (2009) 547–555.
[5] V. Kardonskii, M. Perkas, High-strength maraging steel with a reduced cobalt concentration, Metalloved. i Termicheskaya Obrab. Met. 6 (1968) 32–35.
[6] M. Rao, Progress in understanding the metallurgy of 18 % nickel maraging steels, Int. J. Mater. Res. 97 (2006) 1594–1607.
[7] M. Kapoor, D. Isheim, G. Ghosh, S. Vaynman, M. Fine, Y. Chung, Aging char-acteristics and mechanical properties of 1600 MPa body-centered cubic Cu and B2-NiAl precipitation-strengthened ferritic steel, Acta Mater. 73 (2014) 56–74. [8] Z. Guo, W. Sha, E. Wilson, Modeling the evolution of microstructure during the
processing of maraging steels, JOM 56 (2004) 62–66.
[9] W. Xu, P. Rivera-Díaz-del-Castillo, S. van der Zwaag, Computational design of UHS maraging stainless steels incorporating composition as well as austenitisa-tion and ageing temperatures as optimisaaustenitisa-tion parameters, Phil. Mag. 89 (2009) 1647–1661.
[10] Q. Lu, W. Xu, S. van der Zwaag, A strain-based computational design of creep-resistant steels, Acta Mater. 64 (2014) 133–143.
[11] R. Schnitzer, R. Radis, M. Nöhrer, M. Schober, R. Hochfellner, S. Zinner, E. Povoden-Karadeniz, E. Kozeschnik, H. Leitner, Reverted austenite in PH 13-8 Mo maraging steels, Mater. Chem. Phys. 122 (2010) 138–145.
[12] S. Rajasekhara, P. Ferreira, Martensite→austenite phase transformation kinet-ics in an ultrafine-grained metastable austenitic stainless steel, Acta Mater. 59 (2011) 738–748.
[13] H. Mirzadeh, A. Najafizadeh, Modeling the reversion of martensite in the cold worked AISI 304 stainless steel by artificial neural networks, Mater. Des. 30 (2009) 570–573.
[14] R. Schnitzer, G. Zickler, E. LAch, H. Clemens, S. Zinner, T. Lippmann, H. Leit-ner, Influence of reverted austenite on static and dynamic mechanical properties of a PH 13-8 Mo maraging steel, Mater. Sci. Eng. A 527 (2010) 2065–2070. [15] D. Squires, E. Wilson, Aging and brittleness in an Fe-Ni-Mn alloy, Metall.
Trans. 3 (1972) 575–581.
[16] Y. Heo, M. Kim, H. Lee, Transformation of ordered face-centered tetragonal
θ-MnNi phase to face-centered cubic austenite during isothermal ageing of an Fe-Mn-Ni alloy, Acta Mater. 56 (2008) 1306–1314.
[17] E. Galindo-Nava, P. Rivera-Díaz-del-Castillo, A model for the microstructure behaviour and strength evolution in lath martensite, Acta Mater. 98 (2015) 81–83.