1
*** Corp
PREDICTION OF PARTIAL CHURNERS AND
BEHAVIOURAL LOYAL CUSTOMERS
THROUGH BEHAVIOURAL HISTORICAL
CUSTOMER DATA
PUBLIC, NON CONFIDENTIAL VERSION
Name: Stef Koeslag Student number: s1612239 University: University of Twente Company: ***
2
Colophon
DATE 13TH OF MAY 2016
PLACE ENSCHEDE
ACADEMIC YEAR 2015/2016
PROJECT REFERENCE MASTER THESIS
AUTHOR STEF KOESLAG
STUDENT NUMBER S1612239
EMAIL [email protected]
EDUCATION BUSINESS ADMINISTRATION
INSTITUTE UNIVERSITY OF TWENTE
FACULTY BEHAVIOURAL, MANAGEMENT AND SOCIAL SCIENCES
Exam committee
SUPERVISORS UNIVERSITY 1. DR. MATTHIAS DE VISSER
2. DR. MICHEL EHRENHARD
3
Management summary
Importance of a churn analysis
A lot of companies experience that their products become commodities and that it is more difficult to solely
differentiate on price and product quality. This increased the competition in those kind of industries and
companies have a harder time to offer an added value that makes customers want to switch between
suppliers. The cost of acquiring new customers exceeds, therefore, in most cases the cost of preventing
customers from leaving. Besides, B2B companies have often long-term relationships with their customers.
So, a small decrease in churners can have a substantial influence on the long-term profit. Preventing
customers from leaving is therefore a necessity for companies. Often, companies implement a shotgun
strategy by targeting all customers with an incentive to stay. Although it is easy to implement, it is a waste
of valuable resources because the company also sent incentives to customers who are already loyal. This is
one of the reasons that churn analyses are becoming more popular among academics and companies.
The goal of churn analysis is to detect the customers that have the highest probability of leaving, by
means of a predictive model that is based on the behaviour of previous churners. It is the first step in
preventing customers from churning. The second step is to identify the reason for churning and the third
step is to target them with an incentive to stay. This ensures a higher efficiency and allocation of resources
because the company is only focusing on the customers that have the tendency to leave.
Churn analysis at ***
This study conducted a churn analysis at *** by using logistic regression. The focus was on customers with
the highest purchase behaviour of the *** market that bought *** in 2014 and 2015. A difficulty of the ***
market is that the company does not have contracts with their customers. The complexity of a churn analysis
lies then in the fact that it is not sure when a customer ended the relationship. In this case, it is more
appropriate to focus on partial defection of a customer in the next period (prediction period) instead of the
prediction of a permanent defection. That is, when the customer terminates the contract.
This study took the same approach as previous partial churn studies by operationalizing a partial
churner through a calibration and prediction period – figure 3. The calibration period is used to measure the
customer behaviour while the prediction period is used for the classification of partial churners. More
specifically, a customer is classified, in this study, as a partial churner when he decreased its purchases with
more than 25% and when he fell below a frequency threshold. This threshold was the total average of all
customers purchases in the calibration period. The data set consisted eventually of 112 customers of which
4
To data, this study was the first churn analysis and data mining project at ***. The current data
system is mainly build for the registration of data that can improve the processes of customer support,
marketing and sales, instead for the purpose of predictive analyses. So, the underlying objective of this study
was not to get a churn model that directly could be implemented into the daily operations but rather to lay
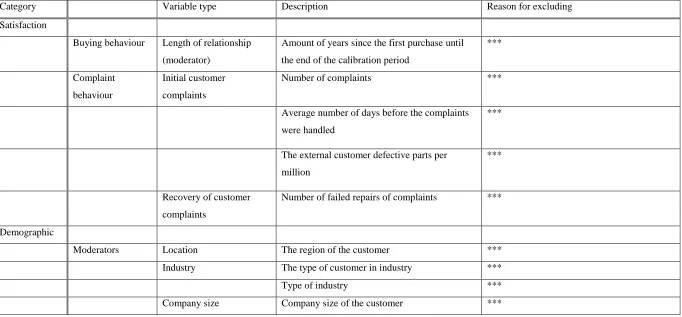
the groundwork for future churn analyses. This study therefore suggested a list of variables (churn
predictors), through literature and interviews with employees of ***, independent of the data available at
***. This gave direct implications for *** on what data they should collect for churn analysis. The variables
that could not be tested in this study, are recommended for future analyses.
Customer behaviour that differentiate churners from behavioural loyal (repeat purchasing)
customers
The objective of a churn analysis is to identify the typical customer behaviour of previous churners, with
the purpose of developing a model, that can predict future churners beforehand. However, to identify this
churn behaviour, it is first important to understand the drivers that influence the level of behavioural loyalty
(repeat purchasing). Behavioural loyalty means a customer that continues doing business with the supplier.
The literature review in this study showed that the most important driver of repeat purchasing is the strength
of the relationship between a customer and firm. Factors that moderate the relation between strength of the
relationship-repeat purchases are situational factors and customer characteristics.
This study focused on customer satisfaction to describe the strength of the relationship and
demographic as a way to explain the different characteristics between customers. Situational factors were
excluded due to the small time period of the data set of this study. Customer behaviour that explains the
level of customer satisfaction (and subsequently, strength of the relationship) is related to the buying
behaviour and complaining behaviour. In other words, customers that are not satisfied with the company
will generally have a different complaining and buying behaviour than customers that are satisfied. A list
of variables, that could measure this customer behaviour and demographic attributes, is suggested through
interviews and literature. To lay groundwork for future churn analyses, this was done independent of the
data available at ***.
Methodology & results
The churn analysis was conducted through logistic regression with 14 variables, suggested through literature
and interviews, that could be extracted from the database. The tested variables were related to RFM and
consist of the buying behaviour of the customer. RFM stands for the recency between purchases, frequency
of purchases and the monetary spending of a customer. Complaint behaviour and demographic variables
follow-5
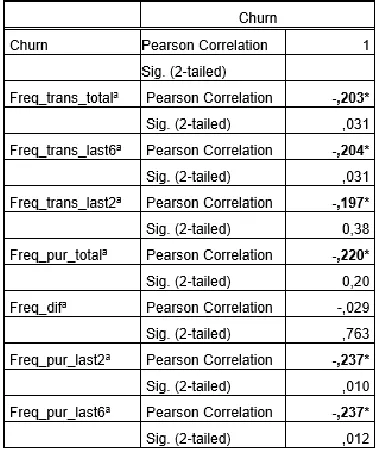
up studies. In total, 10 of the 14 variables showed predictive power in the univariate analysis. These consist
of the recency and frequency variables. The monetary variables had no predictive power.
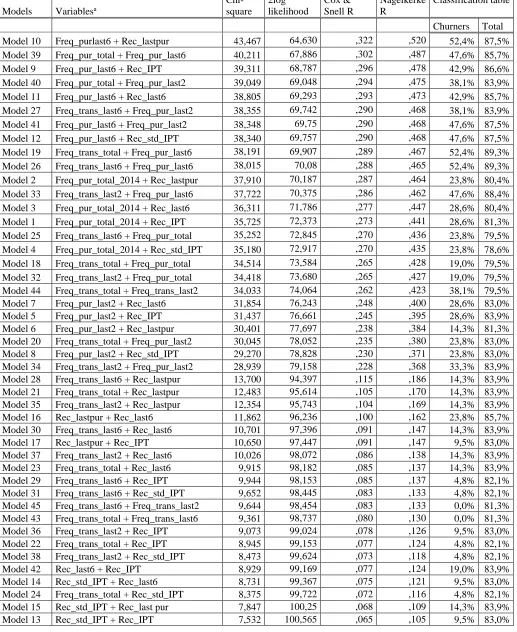
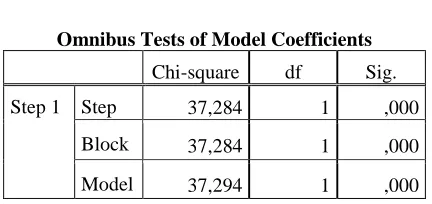
After an extensive model selection, a multivariable model with the ‘frequency of purchases in the last 6 months’ and ‘the amount of days since last purchase’ was the most predictive combination that could
differentiate churners from behavioural customers. This model could identify 11 of the 21 churners and
improved the base model (a model without predictors) with 6,2%. However, the model should not be
generalized and implemented because the linearity of the logit was violated. Moreover, it is worth
mentioning that only two variables could be included in the model due to the rule of thumb of logistic
regression. This rule states that one variable can be added for every 10 events (churners). It is therefore
recommended to retest this model in a larger data set. It also advisable to test the model in combination
with, at first, the other variables that showed predictive power and second, the variables that could not be
tested due to the lack of data.
Recommendations & conclusions
The churn analysis in this study has led to a few recommendations that is advisable for *** to consider in
order to be effective and efficient in predictive analyses. First of all, *** should retest the variables (of the
model), and the variables that have not been tested, in a larger data set. The variables and model in this study
are tested on a small data set of 112 customers and generalizing it is therefore not advisable. Especially
since the linearity of the logit of the model was violated. Besides, a dataset with more churners could include
more predictors. This could further improve the predictability of the model.
Second, the main conclusion of this study is that the data system at *** is not build for predictive
statistical analyses. It is recommended that ***, therefore, makes some adjustments in their data system
before they embark on a follow-up study. This implies ***. Besides, it is advisable to assess whether
statistical analyses, as churn analyses, should be done in-house or whether is better to outsource it to another
company. Namely, these analyses depend on a lot of arbitrary and complex decisions and proper statistical
knowledge and experience is therefore required.
At last, because the quality of the data system and the required knowledge for predictive analyses,
it is not recommended to begin directly with predictive (churn) analysis. *** should follow up the
recommendations above. In the meantime, the company can begin with monitoring churn by means of the
RFM variables. This gives the organization more time to organize their organization for the purpose of
predictive (churn) analyses. Monitoring churn analysis is cheaper and more simplistic than predictive churn
analysis. The only difference is that predictive churn analysis is a leading indicator while monitoring churn
analysis is a lagging indicator. In other words, with predictive churn analyses, you want to predict the
6
churn status. Therefore, it is advisable to use a more conservative criteria that determines if a customer is a
partial churner or not. If the customer falls below/above that criteria, it is classified as a partial churner.
Monitoring the changes in the RFM of a customer is valuable because a customer will not leave all of a
sudden. Instead, the customer will gradually change its business from one supplier to another. So,
monitoring a significant change in a customer’s RFM behaviour can be a sign of churn. The company should
7
Table of Contents
Management summary ... 3
1.0 Introduction ... 9
1.1 Outline of this chapter ... 9
1.2 Description of situation and complication at *** ... 9
1.3 Basic concepts ... 11
1.4 Research objective:... 14
1.5 Research question: ... 14
1.6 Structure of this report ... 15
2.0 Literature review ... 17
2.1 Outline of this chapter ... 17
2.2 Search strategy literature ... 17
2.3 Customer loyalty ... 17
2.4 Antecedents of behavioural loyalty ... 22
3.0 Deductive approach; Predictors and operationalization ... 28
3.1 Outline of this chapter ... 28
3.2 Customer satisfaction ... 29
3.3 Demographic ... 36
4.0 Inductive approach; Predictors and operationalization ... 38
4.1 Outline of this chapter ... 38
4.2 Customer satisfaction ... 39
4.3 Demographic ... 40
5.0 Methodology ... 41
5.1 Outline of this chapter ... 41
5.2 Selection of most behavioural loyal customers ... 41
5.3 Operationalization partial churners ... 42
5.4 Data ... 45
5.5 Final data set and classification partial churners at *** ... 46
5.6 Data mining techniques ... 47
5.7 Behavioural predictors churn analysis *** ... 49
6.0 Results ... 52
8
6.2 Descriptive statistics ... 53
6.3 Pearson correlation ... 54
6.4 Selection of variables for logistic regression model ... 55
6.5 Interpretation of logistic regression model ... 59
7.0 Discussion ... 67
7.1 Outline of this chapter ... 67
7.2 Practical implication ... 67
7.3 Research implication ... 68
7.4 Limitations ... 69
8.0 Conclusion ... 70
Bibliography ... 72
Appendix 1: Set of problems ... 76
Appendix 2: Company information ... 77
Appendix 3: Concept clarification CXM ... 78
Appendix 4: Phases knowledge discovery through data mining ... 79
Appendix 5: Antecedents satisfaction ... 81
Appendix 6: List of interviewees ... 83
Appendix 7: Univariate analysis ... 84
9
1.0 Introduction
1.1 Outline of this chapter
This study is conducted at *** (from now on, ***) and is commissioned by the Customer Experience
Manager of the ***. The sections of the introduction are divided as follows. The description of situation
and complication consists of information about the external and internal situation of *** that explains the
importance of this topic. The direction of this study is chosen, in conjunction with ***, after a
comprehensive company analysis described in Appendix 1. This is based on literature and diverse interviews
with employees of ***. The remaining parts of the introduction consist of a deepening of the most important
concepts of this study, the research goal, research question and the structure of this study. Background
information about the company *** can be found in Appendix 2.
1.2 Description of situation and complication at ***
There are a lot of external developments that have an effect on the current competitive landscape, on how
companies behave and how they are doing business. Nowadays, customers conduct a large amount of
research themselves before even contacting the supplier (Kamaladevi, 2009; Adamson, et al., 2012). This
has ensured that customers are better informed than they used to be and that they make their most important
buying decisions earlier in the buying funnel (Lecinski, 2011). As an example, consider how customers
make their buying decision without talking to the sales person. These customers are doing their own research
on quality, price and type of products. At the time they are in the shop, they have made their buying decision
and are difficult to influence. This development is mainly due to the easiness of getting and sharing
information through the internet and the continuing development of the technology to share - i.a. computers,
smartphones, tablets - and the channels to share - social media and other platforms (Lecinski, 2011). As a
result, customers are more sophisticated about the suppliers products and are therefore increasingly
demanding (Smith et al., 2014; Hollyoake, 2009). Second, besides the increased customer knowledge,
companies are experiencing that products become commodities and markets are getting saturated –
especially in the maturity phase of the product cycle (Liu & et al., 2011; Schmitt, 2003). These factors have
ensured that it is more difficult for companies to create competitive advantage by differentiating on price
and product quality. Hence, a lot of companies are looking for ways to get better insights in the needs of the
customers and try to create the best customers experience as possible.
*** has anticipated on the external developments by ***. Second, the company has introduced a
Customer Experience Management (CXM) function in August 2015 – see Appendix 3. The rationale behind
Customer Experience Management is that customer value is created in the whole customer journey and not
10
the core tasks of the Customer Experience manager at *** is to increase the satisfaction and loyalty of
current customers. To create such a customer satisfaction and engagement, *** needs to understand the
customer needs and the value that is delivered to the customer. At the moment, *** measures the satisfaction
and loyalty through surveys and interviews where a customer is asked to reflect its experience in a cognitive
way (Journée & Weber, 2014). A disadvantage of such measurements is that the results could be biased.
For instance, a very positive or negative experience just before the survey could have an influence on the
outcome.
*** has recognized the limitations of subjective measurements, like surveys and interviews, for
loyalty and wants to begin with analysing customer (dis)loyalty through a more objective measurement.
Namely, historical customer data. The importance of collecting and processing large amounts of data and
translating it into knowledge is also described in literature. Cooper et al. (2000) state that it is a core
competency for successful companies. The process of utilizing raw data is known as knowledge discovery
in data bases and data mining. Most customer data is often captured in the company’s CRM systems. These
can consist of all data that is gathered through a company after an interaction with the customer. One of the
major criticisms about CRM systems is that companies invested a lot of money without getting valuable
customer information in return. In most cases, the problem is not the lack of data, but the redundancy of
unnecessary data. Therefore, it is extremely valuable for companies to convert this data into valuable
information. Another advantage of using customer data instead of subjective methods, like interviews and
surveys, is that it consists of the actual behaviour of customers. So, it is more objective and the participant
cannot affect the results of the measurement (Bryman & Bell, 2011). At the moment, *** has gathered a lot
of data in their data warehouse that could consists of valuable customer information. However, this data has
not been utilized to full extent.
The focus of this study is on developing a model that can predict what customers abrupt the
relationship with *** (churners) by using historical customer data. The aim is to identify behavioural
characteristics that are particular for a customer who tends to leave the company. Because this is the first
time that such an analysis is done at ***, it is likely that the data system is not perfectly suitable for data
mining projects. Therefore, the underlying objective is not to develop a model that can directly be
implemented at ***. Rather, its objective is to identify important variables and to lay the groundwork for
future data mining projects in the field of churn analysis at ***. This topic is chosen, in conjunction with
***, after the comprehensive external and internal analysis – Appendix 1. The subsequent sections describe
a deepening of the concept churn analysis and the concept knowledge discovery through data mining. These
concepts are described inseparable from each other in literature and form a good base for the sequel of the
11
1.3 Basic concepts
1.3.1 Churn analysis
It is well-known that it is less expensive for a company to retain customers than to attract new customers
(Berson, et al., 2000; Tsai & Lu, 2009; Dick & Basu, 1994). Furthermore, a small decrease in churners can
have a major positive effect on the profit.1 This applies in particular to business-to-business (from now on,
B2B) where customers spend in general more money (Rauyruen et al., 2007; Jahromi et al., 2014).
However, it has become more difficult to retain the increasingly demanding customers due to the
saturated markets, products that become commodities and the knowledge that customers have about the
products. It is even more difficult to retain customers for companies that have no contract with the customer.
As a consequence, customers can switch between suppliers without noticing. In those businesses, companies
apply often a ‘shotgun strategy’ to prevent customers from leaving (Jahromi et al., 2014). The company
send incentives to all customers, in the hope that they will remain loyal. Although this strategy is easy to
implement, it is highly inefficient because it is wasting valuable recourses to customers who are already
loyal (Jahromi et al., 2014). For this reason, churn analysis has gained increasingly attention by many
academics and practitioners (Van den Poel & Lariviére, 2004; Chen et al.,2015; Buckinx & Van den Poel,
2005; Mozer et al. 2000).
A churner is a customer that has the “the tendency to defect or cease business with a company”
(Kamakura et al., 2005, p. 286). In contrast, a customer that continues doing business with the supplier is
behavioural loyal (Bandyopadhyay, 2007). Predicting customer churn is “the process of calculating the
probability of future churning behaviour for customers in the database, using a predictive model, based on
prior behaviour” of churners (Jahromi et al., 2014, p.1259). In other words, with a churn analysis you try to
identify the typical customer behaviour of previous churners, with the purpose of developing a model, that
can predict future churners beforehand.
Most studies on customer churn have focused on the B2C sectors retail, backing and
telecommunications (Chen et al., 2015). These studies are mostly conducted in contractual settings where it
is easier to identify a churner. The extant literature of customer churn in B2B remains relative novel
(Jahromi et al., 2014; Chen et al., 2015). This has mainly to do with the non-contractual setting and the fact
that (big) data has not been embraced as it has been in B2C (Jahromi et al., 2014). As a consequence, it is
more complex to get the necessary data from a B2B company and to operationalize a churner in a business
12
where there is no contract between the customer and the supplier. In other words, when can we conclude
that the customer really stopped doing business with the supplier (churn)?
To summarize, the premise of a churn analysis is that companies should pay attention to the
customers behaviour – figure 1 (Klepac, 2014). More specifically, is the behaviour of a leaving customer
different than for a loyal customer? The objective of a churn analysis is then to predict the customers who
have the greatest probability of churning. A company should then use the analysis to determine why a
customer is leaving and to conduct a strategy to prevent those churners from leaving. This ensures a more
[image:12.612.109.427.243.415.2]efficient allocation of valuable resources.
FIGURE 1: ADAPTED FROM “DEVELOPING CHURN MODELS USING DATA MINING TECHNIQUES AND SOCIAL NETWORK ANALYSIS (P.9), BY G. KLEPAC, 2014, IGI GLOBAL, COPYRIGHT 2014 BY IGI GLOBAL.
Acquired
Active customer
Reduction
Partial churn
13 1.3.2 Knowledge discovery through data mining
The internet and the development of different technologies and systems have made it easier for companies
to rapidly gather a high volume of data. However, this data is only useful when it has made the transition to
information and subsequently to knowledge. Nowadays, companies are more aware of this potential source
of information (Ngai et al., 2009; Berson et al., 2000). It is also noticed by academics that the traditional
data analytic and query techniques extract often superficial information from the databases, while this data
often consists of much more valuable information (Ngai et al., 2009). Hence, there is an increasing need
from companies to process this data in an effective and efficient way with the purpose to utilize this deeply
hidden information. The utilization of data for the discovery of information and knowledge has many
definitions – data archaeology, data pattern processing, information discovery, information harvesting,
knowledge extraction - but is often known as knowledge discovery in databases and data mining (Fayyad
et al., 1996).
Data mining can be defined as the “application of specific algorithms for extracting patterns from
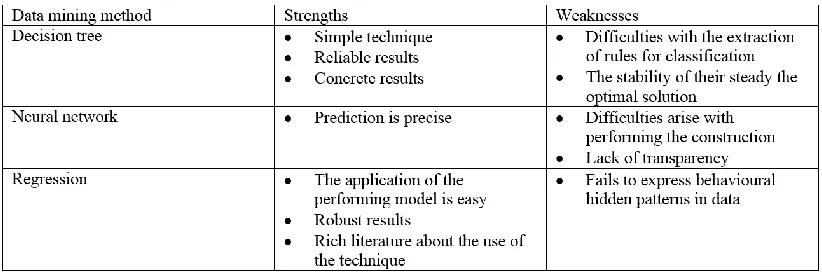
data“ (Fayyad et al., 1996, p.39). The most common data mining techniques consist of decision tree, logistic
regression and neural networks (Ngai et al., 2009). Knowledge discovery in databases can be seen as the
overall process of utilizing data wherein data mining is a sub phase. In general, a knowledge discovery in
databases project consists of the following phases: business problem, data understanding, data preparation,
data mining, interpretation results and the implementation of the results (Cabena et al., 1998; Cos et al.,
2012; Fayyad et al., 1996; Miller & Han, 2009). Appendix 4 shows an overview of the phases described in
literature. In some literature, data mining is used interchangeable with the definition of knowledge discovery
in databases. In these cases, data mining is also seen as the overall process of utilizing data (Watson, 2000;
Edelstein, 2000). However, this study sees data mining as a single step – application of a specific algorithm
- of knowledge discovery in data bases projects.
The phases of this study will consist of the business problem phase – described in the introduction,
literature review, data preparation, data mining and the interpretation of the results. This can serve as a
guideline for this study. It is remarkable, from an academic perspective, that the phases proposed in literature
did not include a clear theoretical phase. A section that describe the prior literature about the specific
business problem is more efficient. For this study, previous literature about churn analysis can increase the
likelihood of successful identification of churners. Moreover, the step which consists of the ‘implementation
14
1.4 Research objective:
Develop a model that consists of variables, that can be extracted from *** databases, which predict whether
a customer will remain behavioural loyal or churn.
1.5 Research question:
What customer characteristics or behaviour, extracted from *** existing data warehouse(s), can
differentiate behavioural loyal customers from churners?
1.5.1 Sub questions
Theoretical section:
1. What is behavioural loyalty and how can it be operationalized in a non-contractual B2B organization?
2. What antecedents of behavioural loyalty can differentiate churners from behavioural loyal customers? Deduction:
3. How can these antecedents be operationalized, into variables, through literature?
Induction:
4. How can these antecedents be operationalized, into variables, through the experiences of employees of ***?
Practical section:
15
1.6 Structure of this report
The direction of this study is chosen after a comprehensive analysis of the current internal and external
situation in the area of Customer Experience Management of ***. The structure of narrowing down from a
broad, diverse list of ‘problems’ to one problem situation is common for business problem solving and has
been taken over from the regulative cycle by Van Strien (1997). It gives a complete picture of the internal
and external situation and how it is related to each other. This report is structured as follows. The first phase,
set of problems, can be found in Appendix 1. The second phase, problem choice, is explained in the
description of situation and complication. The remaining phases consist of the literature review, the
identification of churn predictors through a deductive and inductive approach, testing these predictors and
the interpretation of the results. The structure of this report is illustrated in figure 2.
The literature review describe the first two sub questions. The first sub question consists of the
concept (behavioural) loyalty and how churn can be defined and operationalized in a non-contractual
business. The second question will explain the most important antecedents of behavioural loyalty. The focus
is on antecedents that can be measured in customer data and can differentiate churners from behavioural
loyal customers.
The identification of predicting variables for behavioural loyalists and churners are twofold. First
of all, the deduction approach is more top-down and starts with literature for the operationalization of
predicting variables. Second, the induction part is more
bottom-top and consists of experiences *** employees. These employees
could give novel input about customer behaviour that is different
for churners and behavioural loyalists in a B2B sector. This is
valuable, especially, because most extant literature tested
variables in a B2C context with a contractual setting.
The methodology part consists of the: operationalization
of a partial churner for this study, data mining technique, data
selection, data preparation and a selection of the variables that
could be extracted from *** database. The outcomes of the
analysis are evaluated in the chapters results, discussion and
conclusion.
At last, a difficulty with the data of *** is that it is
gathered through different data systems. ***. Hence, the quality
of the data is not known. Thus, in consultation with *** is decided
that the identification of predicting variables (deduction and
[image:15.612.373.595.405.662.2]induction chapters), that could differentiate churners from behavioural loyal customers, will be written
16
beforehand and independently of the data available. This creates an ideal overview of data that *** should
gather for the purpose of churn analysis. A disadvantage is that there is a possibility that some indicators
17
2.0 Literature review
2.1 Outline of this chapter
The first section explains the strategy for the search of literature in this study. The second section (first sub
question) begins with a general explanation of the importance of the concept customer loyalty, the types of
loyalty and how previous studies defined and operationalized non-behavioural loyalty (churn) in a B2B
company with a non-contractual setting. In a contractual setting, it is easy to identify a customer who is
leaving the company. In this case, a customer terminates the contract and goes to a competitor. Identifying
a churner in a B2B organization, with a non-contractual setting, is arbitrary and complex because it is unclear
when a customer is actually churned. The third section (second sub question) describes the antecedents of
customer behavioural loyalty that can be measured in customer data and can differentiate churners from
behavioural loyal customers. Subsequently, the antecedents that are most applicable to this study are
described in more detail.
2.2 Search strategy literature
The databases that will be used for finding literature consist of Scopus and Google Scholar. The initial
search for literature is based on the keywords “customer loyalty”, “customer churn” and “churn analysis”.
The other sections have a more targeted approach where above keywords are used in combination with
“types of“, “operationalization of”, “partial”, “B2B”, “data mining” or “behavioural”. The first step is to
select relevant articles with the most citations. To get the most recent literature, the focus is on literature
from the year 2000 until now. Only the articles with a minimum citations of 10 will be selected. However,
the minimum citations does not apply for articles of the last two years. The second step is to find articles
through the snowball method. The snowball method gives the opportunity to you use references or citations
from a highly cited article. In this case, articles will also be used that fall outside the demarcation of the
sixteen years.
2.3 Customer loyalty
The concept of customer loyalty remains very popular among academics and practitioners because it is seen
as an important way to create competitive advantage. Recent studies are still using very old literature as a
baseline to describe loyalty (Oliver, 1999; Dick & Basu, 1994). Instead of criticizing the dominant literature,
they focused more on the effects and ways to reach customer loyalty (Sureshchandar et al., 2002; Rauyruen
et al., 2007; De Canniere et al., 2009; Liu, Guo, & Lee, 2011). Well-known outcomes of customer loyalty
are increased revenue and a reduction of the customer acquisition costs (Shankar et al., 2004). However,
18
them loyal (Kamaladevi, 2009; Adamson, et al., 2012; Smith et al., 2014; Hollyoake, 2009). Identifying
churners beforehand could be therefore a valuable asset for a company. This ensures that they do not have
to target all customers but only have to focus on the customers with the highest likelihood of churn.
2.3.1 Types of loyalty
The popularity of loyalty is of all times. Although, when two people talk about loyalty it is easy to create
confusion. This is caused by the different components and types that loyalty consist of. In general, with the
concept customer loyalty is often meant composite loyalty (Day, 1969; Jacoby & Chestnut, 1978; Jacoby &
Kyner, 1973), consisting of attitudinal and behavioural loyalty (Dick & Basu, 1994; Bandyopadhyay, 2007).
With behavioural loyalty is meant a customer who continuously buys a product at the same company while
with attitudinal loyalty is meant a customer that is an advocate and recommends the company to friends or
partners. The level of attitudinal and behavioural loyalty is different per customer. As a consequence, the
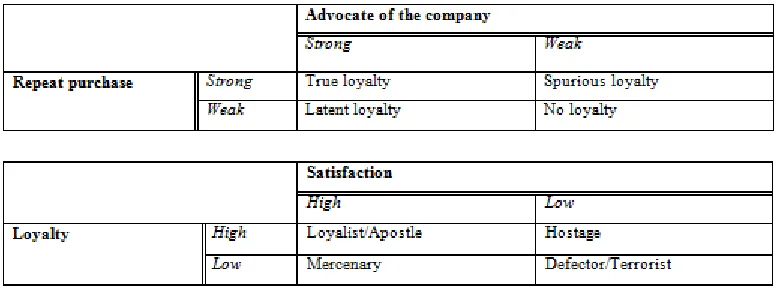
varying degrees of loyalty leads to four different kinds of outcomes – see table 1. Namely, no loyalty,
spurious loyalty, latent loyalty or true loyalty (Dick & Basu, 1994).
First of all, true loyalty is the most admirable situation consisting of both a high attitudinal as a high
behavioural loyalty (Dick & Basu, 1994). These kind of customers are an advocate of the company and are
not sensitive to switching incentives from competitors. For instance, a change in price will not have an effect
on the customer to switch between suppliers. In the worst case, the customer makes an adjustment in the
quantity of the order.
Second, latent loyalty consists of customers that have a high attitudinal level and a low behavioural
level of loyalty (Dick & Basu, 1994). Although the customers are a true advocate of the company, they are
restraint by situational factors. For instance, money restraints or distribution channels make it difficult to
acquire the product. Moreover, it could also be that customers are highly satisfied with the supplier, but that
they don’t need the products because of the low demands of their own customers. It is important for a
company to recognize this type of customers and to subsequently, develop ways to remove or minimalize
the barriers which hold them back to purchase.
Third, spurious loyalty consists of a low attitudinal loyalty and a high behavioural loyalty (Dick &
Basu, 1994). It is also known as ‘phantom’ loyalty. This category includes customers that show high levels
of repeat purchases while they are not really committed to the supplier. These customers are restrained by
barriers to switch. For instance, due to monetary constraints, habit, convenience or a lack of alternative
suppliers (Dick & Basu, 1994). A customer that is spurious loyal will likely churn when a competitor offers
an appealing incentive to switch.
The last category consists of no loyalty. As the name suggest, this refers to customers who are no
19
of these customers are limited and it is very difficult to change them into true loyal customers. As a
consequence, these customers are churning when a switching incentive is offered by a competitor.
Another view is described through the Apostle model by Jones & Sasser (1995). This is almost
similar as described above, although now it is classified as loyalists, mercenaries, defectors and hostages –
see table 1. Furthermore, this model is operationalized by satisfaction and loyalty, while the aforementioned
is operationalized by behavioural and attitudinal loyalty. It is important for a company to understand in
which category their customers belong to one of the discussed models above.
To conclude, this study will focus on behavioural loyalty rather than attitudinal loyalty. This is in
line with Haghkhah et al., (2013) who suggest that the focus on behavioural loyalty is better when
interpreting patterns for repeat purchases. As a repetition, behavioural loyalty can be defined as a customer
who continuously buys a product at the same company. The opposite of a behavioural loyal customer is a
churner. Churn can be defined as “the tendency of customers to defect or cease business with a company”
(Kamakura et al., 2005, p. 286). From now on, with the concept loyalty is meant behavioural loyalty unless
specified otherwise. At last, the different types of loyalty can give the reader a better understanding of the
whole loyalty concept. However, the objective of this study is not to identify why a customer is churning
[image:19.612.72.462.400.544.2]but to identify the behaviour of churning customer.
20 2.3.2 Partial customer non-activity in a non-contractual business
The definition and operationalization of a customer who is going to churn (behavioural disloyalty) in a
non-contractual setting is a complex task. This section will therefore give an explanation about how this is done
in current literature. It provides a better understanding of churn analysis and the sequel of this study.
Although, it is worth mentioning that the operationalization of churn for this study is described in the
methodology chapter (section 5.2 and 5.3) while this section provides only an overview of extant literature.
The crux of churn in a non-contractual setting is that the absence of a contract between a supplier
and a customer makes it difficult to identify the exact time when a customer is leaving the company
permanently. This is probably the reason that most academic literature has focused on sectors with a
contractual setting, such as the finance, telecom or the insurance sector (Jahromi et al., 2014). In a
contractual setting, a customer who is going to churn has terminated the contract. In this case it is clear when
the customer stopped doing business with the company.
The exact time of termination of the customer relationship in a non-contractual setting is more
arbitrary. Therefore, extant literature about the prediction of churn in non-contractual settings has focused
on the partial defection of a customer in the next period instead of the prediction of a permanent decision
(Buckinx & Van den Poel, 2005; Jahromi et al., 2014). In this case, the focus is on customers who bought
no or significantly less products than previous period. These customers are partial churners because they
are deviating from their normal buying pattern (Buckinx & Van den Poel, 2005). The focus on partial
churners could also be more valuable for a company than total churn because there is still an opportunity to
retain those customers. In other words, a partial churner in a non-contractual setting is defined as a customer
who is “being active (calibration period) in the first period while being inactive (prediction period) in the
second period” - See figure 3 (Tamaddoni Jahromi et al., 2014, p. 1260). To get a better understanding, the
calibration period in churn analysis is then used to measure the behaviour (independent variables) that
differentiate churners from behavioural loyal customers.
The inactive of a customer in a non-contractual setting is often operationalized through a certain
threshold. So, the customer is seen as a partial churner when the indicator is below or higher than the
determined threshold in the prediction period. Tamaddoni Jahromi et al. (2014) and Chen et al. (2015)
operationalized a non-active customer when the customer had at least one purchase in the calibration period
and no purchase in the prediction period. They based the non-activity of a customer on the frequency of
purchases. Slightly different, Buckinx & Van den Poel (2005) focused on the customers who had a
frequency of purchases and a standard deviation of the inter-purchase time above average in the calibration
period. Subsequently, if these selected customers fell below these averages in the prediction period, they
were identified as a non-active customer. A disadvantage of a (frequency) threshold is that a customer with
21
FIGURE 3: PARTIAL CHURN BY MEANS OF A PREDICTION PERIOD
behaviour, and not fall below the threshold, is determined as a loyalist (Glady et al., 2009). Migueis et al.
(2012) solved this disadvantage by operationalizing a partial defector based on percentage changes in
customers spending from one period to another. In this case, a customer was classified as a churner if he
spent less than 40% in the next period. Although, these authors focused on new customers with similar
spending through the succession of first products’ categories purchased (Migueis et al.,2012).
To conclude, a calibration and a prediction period have to be used when defining and
operationalizing partial churn in a non-contractual business. The calibration period serves then for the
measurement of the (predicting) variables and the prediction period is used to define a partial churner. The
operationalization of partial customer churn and a further explanation of the prediction and calibration
22
2.4 Antecedents of behavioural loyalty
The purpose of this study is to identify what customer data comprises behavioural characteristics that
differentiate churners from behavioural loyal customers. Most studies of customer churn have focused on
the B2C sectors retail, backing and telecommunications (Chen et al., 2015). Variables that had an effect on
churn in these articles were related to the customer usage, buying behaviour and customer characteristics
based on demographic or geographic variables (Van den Poel & Lariviére, 2004; Chen et al.,2015; Buckinx
& Van den Poel, 2005; Mozer et al. 2000). Although, the relation between these type of variables is not
clearly explained in literature. The focus in most churn studies was mainly on the statistical analysis rather
than an explanation of the variables. This study will therefore contribute to previous literature by providing
a better theoretical explanation between the drivers of behavioural loyalty and the type of variables described
in previous churn studies. This will give a better understanding about the relation between the variables and
what these type of variables really explain.
To begin with, composite customer loyalty is influenced by “the strength of the relationship between a customer’s relative attitude and repeat purchases” (Dick & Basu, 1994, p.99). This lead to the four types
of loyalty that is described in chapter 2.3.1. The focus of this study is on customers who remain a high repeat
patronage. Previous chapter showed that a high repeat patronage (behavioural loyalty) can be created with
both a high and a low attitudinal loyalty. This implies that the customer does not have to be an advocate of
the company to have a behavioural loyal relationship. To get a good grip on what determines the strength
of a behavioural relationship, the first paragraph will explain the antecedents of relationship quality.
According to Palmatier et al. (2006, p.138) “relationship quality is the “overall assessment of the strength
of a relationship”. Moreover, it is stated that high levels of relationship quality results in a high purchasing
behaviour (de Canniére et al., 2008). The sequel paragraphs will explain antecedents that moderate the
strength of a relationship. In general, this can be divided into the individual characteristics of a customer
and situational factors (Ball et al., 2004; Dick & Basu, 1994).
Strength of the relationship between a customer and firm
The strength of the relationship can best be described through the relationship quality antecedents. These
are often seen as the most influential antecedents of loyalty. There are a lot of antecedents that are described
as a part of relationship quality. These concepts are highly related but have a different meaning (Palmatier
et al., 2006). The most common concepts are trust, satisfaction, commitment and sometimes service quality
(Rauyruen et al, 2009; Palmatier et al., 2006). There is no unambiguous agreement among academics which
antecedent comprises “the key aspects of a relationship that most affect outcomes” (Palmatier et al., 2006,
p.139). The focus of this study is on antecedents that affect the outcome repeat purchases (behavioural
23
effect on attitudinal and/or behavioural loyalty are Rauyruen et al. (2009). It turned out that satisfaction and
service quality were the only antecedents of relationship quality that have a significant effect on behavioural
loyalty. Rauyruen et al. (2009, p.8) state that “while both the attitudinal and behavioural components are
important in achieving composite loyalty there are different paths to achieving each component”, suggesting
that customer satisfaction/service quality are better drivers of behavioural loyalty. The importance of these
drivers of behavioural loyalty is also recognized by other authors (Shankar, Erramilli, & Lam, 2004; Walsh
et al., 2006; Eriksson & Vaghult, 2000) and will therefore be the focus of this study. Customer satisfaction
and service quality have received a lot of academic attention, although the operationalization of the concepts
remains ambiguous and uncertain. Therefore, this study adopt the view of the highly cited article of
Sureshchandar (2002) who sees customer satisfaction as a multidimensional construct that should be
operationalized along the same factors and variables as service quality is operationalized. So, an increase in
customer satisfaction will likely lead into an increase in service quality. The next paragraphs will explain
the antecedents that moderate the relation between the strength of the relationship (customer satisfaction)
and a customer’s repeat purchases. These moderators fall into situational and customer characteristics.
Situational factors
Situational factors are events that ensure an abruption or a barrier to switch in a relationship between a
customer and supplier (Dick & Basu, 1994). This could be caused by several temporary conditions that have
an effect on whether customer buy or not. For instance, stock-outs of products, switching costs, incentives
from competitors or by macro environment developments (Dick & Basu, 1994; Ball et al., 2004; Blut et al.,
2015). This could be legal changes, economic changes or technological changes (Ball et al, 2004). All these
factors mediate the relation between the relationship quality and a customer’s repeat purchasing behaviour
(Dick & Basu, 1994). These conditions are often measured through surveys where a customer is asked to
evaluate their perception of the situational factors. However, situational factors are not popular in churn
analyses. The reason is that situational factors are often difficult to measure in data. Authors who included
situational factors in their churn study are Van den Poel & Lariviére (2004). They measured the effect that
mergers/acquisitions and the prosperity at a certain moment have on churn. These authors used a data set of
77 years. Measuring the effect of situational factors will be difficult when a short time period is used. This
is also recognized by Mozer et al. (2000) that excluded macro environment in their churn analysis due to
24 Customer characteristics
Customer characteristics describe the differences between customers based on their attributes (Ball et al.,
2004). It could give an explanation why customers have a different purchase behaviour. These attributes
moderate the relation between relationship quality and a customer’s purchasing behaviour (Buckinx & Van
den Poel, 2005). The attributes of customer characteristics are mostly applicable to B2C where the customer
is an individual person. In this case, the focus is on characteristics that can differentiate the personality and
the societal factors – norms and values, culture beliefs – of customers. These are often described through
the demographic attributes of a customer (Dick & Basu, 1994; Buckinx & Van den Poel, 2005). This
category is widely adopted in the churn literature (Van den Poel & Lariviére, 2004; Mozer et al. 2000;
Buckinx & Van den Poel, 2005). The popularity of demographic is thanks to the easiness of measuring and
the fact that demographic variables are often correlated with the product/service usage, customer demands
and their preferences (Kotler, 2003). In B2B, where the customer is seen as an entity, it is more difficult to
describe their disparate characteristics. In general, it is stated that B2B relationships are more rational than
B2C relationships (Hollyoake, 2009). This is due to the fact that a B2B customer is often acting on behalf
of their customers. Most B2B studies use therefore more standard demographic attributes as a way to
segment customers (Kotler, 2004; Chen et al., 2015).
Antecedents of this study
The relationship between the antecedents of this study is visualized in figure 4. This study will focus on
customer satisfaction as a concept to describe the strength of the relationship of behavioural customers.
Previous paragraph described that the other antecedents that determine the strength of a relationship had no
significant effect on behavioural loyalty. Moreover, it is more difficult to capture concepts as trust and
commitment in observational data while the behaviour of a (dis)satisfied customer is easier to capture.
Second, demographic attributes of a customer will be used to describe the factors that moderate the relation
between the strength of a customer’s relationship and repeat purchases (behavioural loyalty). Demographic
variables have been proven to be a good moderating predictor for churn (Buckinx & Van den Poel, 2005).
And at last, situational factors will be excluded from this study because the difficulty of measuring it in a
data set with a small time period. Although, it remains interesting for the prediction of churn when a longer
time set is used. For instance, it would be interesting to see if certain legal, economic or environmental
changes have an effect on the actual switching behaviour of customers. Although, for the reliability of the
25
To conclude, the antecedents identified in this chapter show directly the relationship with the type
of variables in previous studies about churn analyses. Namely, the customer buying behaviour and usage of
a product/service are outcomes of the strength of the relationship (customer satisfaction) between a customer
and supplier. This is moderated by the customer characteristics (demographic attributes) and situational
factors. This can work as a framework for future churn studies that want to identify customer behaviour that
can differentiate churners from behavioural loyal customers. In other words, what customer behaviour
shows the strength of the relationship between a customer and firm and what factors moderate the relation
between the strength of the customer relationship and repeat purchases. The next sections will describe a
more detailed explanation of the chosen antecedents.
FIGURE 4: RELATIONSHP ANTECEDENTS
26 2.4.1 Customer satisfaction
This section tries to give a better understanding of the concept customer satisfaction. Previous chapter
showed that customer satisfaction can explain the strength of the relationship between a customer and a
supplier. The first part of this chapter will explain the general effect of customer satisfaction on behavioural
loyalty. The remaining paragraphs will explain the definition, interpretation, antecedents and how a
customer express the strength of the relationship by means of customer satisfaction. At last, an explanation
on how to operationalize customer satisfaction for churn analyses will be purposed for this study.
First of all, there is an overall agreement that customer satisfaction leads to both behavioural loyalty
as well as attitudinal loyalty (Rauyruen, 2009). Moreover, previous studies have revealed that a positive
customer satisfaction negatively affect churn (Walsh et al., 2006; Eriksson & Vaghult, 2000). For instance,
Eriksson & Vaghult (2000) showed that satisfied customers are more likely to stay at the same firm. They
found a positive correlation between relationship satisfaction and their repeat purchases.
Although, despite the popularity of the concept satisfaction, there is still no univocal definition. One
definition that is widely accepted by authors (Eggert & Ulaga, 2002; Rauruen, 2009), that describe B2B
relationships, is from Chumpitaz and Paparoidiamis (2004). They define customer satisfaction as “an overall
evaluation of the total purchase, use and relationships experience with a product or service over time, as
expressed by members of the buying decision centre” (p. 238). Customer satisfaction can be intrepreted in
two different ways. Namely, as a transaction specific satisfaction or a cumulative customer satisfaction.
Transaction specific satisfaction can be defined as the evaluation of an individual specific purchase
occasion, while the cumulative customer satisfaction can be defined as the overall evaluation of the
relationship or brand between a customer and firm to date (Gil Saura & Frasquet, 2009). Levik-Olsen &
Johnson (2003) suggest that cumulative satisfaction is more appropriate in making predictions of customer
behaviour. Therefore, this study will focus on cumulative customer satisfaction.
Whether a customer is satisfied or not depends on many factors. For instance, the degree of
satisfaction of a customer can be influenced by the functional quality, technical quality, expectations, price,
image of the firm or a customer desires (Gandhi & Sing Kang, 2011). These factors can best be explained
through the most dominant antecedents of customer satisfaction, namely, disconfirmation
(expectation-performance), affact and customer equity (Szymanski & Henard, 2001) - these are explained in more detail
in Appendix 5. On the other hand, only a few studies have investigated the outcomes of customer
satisfaction. Szymanski & Henard (2001) suggest in their meta-analysis that a customer is expressing its
(dis)satisfaction through repeat purchasing, complaining behaviour and word of mouth. As a repetition,
extant churn literature focused on variables that explained the strength of a relationship between a customer
and supplier. These studies focused mainly on the purchasing behaviour and the customer usage of a product
27
et al.,2015; Buckinx & Van den Poel, 2005; Mozer et al. 2000). Therefore, it seems also logical to focus on
outcomes of customer satisfaction rather than the focus on antecedents. Namely, the perception of an
expectation and performance is different for each customer and could be influenced by a lot of factors, while
the outcomes customer satisfaction are more homogeneous. Thus, the focus on how a customer express its
satisfaction makes it easier to identify behavioural patterns that are typical for churners.
To conclude, the objective of this study is to identify behavioural attributes that can differentiate
churners from behavioural loyal customers. In other words, what behaviour is typical for churners? Previous
chapter described that the strength of the relationship have an affect on repeat purchases. This study will
therefore focus on complaint behaviour and buying behaviour, as categories to operationalize variables,
because this explains the strength of the relationship between a customer and supplier. Namely, these are
the outcomes of a (dis)satisfied customer and therefore, customers who are going to churn will probably
have different complaint and buying attributes than (behavioural) loyal customers. Word of mouth will not
be applicable to this study due to the absence of this type of customer data in data systems. Chapters 3 and
4 will operationalize predicting variables that can be measured in customer data and that explains the
behavioural characteristics of customers by means of complaint and buying behaviour.
2.4.2 Demographic
Previous chapter described that demographic attributes moderate the relation between strength of the
relationship, between a customer and supplier, and repeat purchases (Buckinx & Van den Poel, 2005). The
popularity of demographic as a way to segment customers is mainly thanks to the correlation that it has with
product/service usage, customer demands and customer preferences (Kotler, 2003). Besides, demographic
variables are often easy to measure. It is therefore not surprising that the antecedent demographic is adopted
by many authors as a category for variables in churn analyses. More specifically, Buckinx & Van den Poel
(2005) described that demographic is one of the most popular category for variables in churn analyses.
In general, demographic variables are mostly applicable to the B2C market. Variables that can
segment customers are, among others, household, age, gender, education, religion and geographical data
(Kotler, 2003; Buckinx & Van den Poel, 2005). Most variables are, however, not relevant for B2B. This is
due to the fact that a business customer is seen as an entity, where a B2C customer is often an individual.
Demographic variables that are used in B2B markets to segment customers consist of industry, company
size and location (Kotler, 2003). It is most likely that customers with a different industry, company size and
location have a different behaviour and thus a disparate level of behavioural loyalty. Therefore, these
attributes will be used as demarcation for the operationalization of the variables by means of a deductive
28
3.0 Deductive approach; Predictors and operationalization
3.1 Outline of this chapter
This chapter uses a deductive approach to identify customer behaviour that could be different for churners
and behavioural loyal customers. More specifically, extant literature on how a customer express its degree
of customer satisfaction will be used to identify if the behaviour of a dissatisfied customer is different than
for a satisfied customer. This behaviour will be further explained through the moderators of the demographic
attributes.
It should be said that the operationalization of variables is written independently from the data
available at ***. A difficulty with the data at *** is that it is currently gathered through different data
systems. As a consequence, it is possible that the systems gather not the same data or in the same format.
Thus, in consultation with *** is decided that the identification of predicting variables will be written
independently of the data available. This creates an ideal overview of data that *** should gather for the
purpose of churn analyses. A disadvantage is that there is a possibility that some variables from literature
can’t be tested due to the absence of data. Hence, the definitive list of variables used in this study can be
found in the methodology chapter while this chapter only suggests variables in an ideal situation where all
data is available.
The chapter will begin with a general explanation about buying behaviour, complaining behaviour
and the moderating demographic attributes. These will be divided into sub-categories and at last,
operationalization’s for variables – that can differentiate churners from behavioural loyal customers - will
be suggested for this study. It is worth mentioning that the suggested variables, in the deductive and
inductive chapters, are based on the prediction of partial churn that is operationalized through a frequency
threshold. The operationalization of partial churn for this study is described in more detail in the
29
3.2 Customer satisfaction
3.2.1 Type of product(s)
A company who wants to do a churn analysis should determine which products to include for analysis.
Namely, a customer who buys a convenient product has a totally different behaviour and preference than
someone who buys an expensive or customized product. Therefore, it is suggested that the variables of
customer satisfaction - repeat purchasing and complaint behaviour - should be adjusted to the determined
product (category) used for the churn analysis. Grouping the customers behaviour based on product
characteristics is recognized by Chang & Tsai (2011).
3.2.2 Purchasing behaviour
As previously mentioned, repeat purchasing is one of the ways how a customer is expressing its satisfaction
and strength of the relationship with the supplier. However, a customer who is dissatisfied in a
non-contractual setting is not going to switch all of a sudden (Buckinx & Van den Poel, 2005). The customer is
probably switching some of his products gradually from one supplier to another supplier. In this case, a
customer becomes a partial churner. If the supplier does not recognize this partial churner, the chances are
that the customer is defecting totally. This also explains that a significant change in buying behaviour of a
customer could imply that the strength of the relationship is weakened and that the customer is going to
churn.
So, it can be stated that changes in the buying behaviour are a predictor of a customer’s future repeat
purchasing. This is also seen in literature, where the inclusion of buying behaviour attributes for the
prediction of churners are used by several authors (Miguéis et al., 2012; Jahromi et al., 2014; Buckinx &
Van den Poel, 2005; Chen et al., 2015). The most common attributes of buying behaviour are recency,
frequency and monetary (RFM). Another suggested attribute that can influence the company’s profitability
is the total length of a relationship (LOR) with a company. LOR moderates the buying behaviour of a
customer (Buckinx & Van den Poel, 2005; Chen et al., 2015; Miguéis et al., 2012).
To summarize, the above sub-categories will be explained and operationalized into variables in the
following sections. This is an ideal list of variables based on extant literature. The definitive selection of
predictors can be found in the methodology chapter because it is unclear whether the variables can be
30 Operationalization variables
Recency / Inter-purchase time
Recency is considered to be the most powerful predictor for identifying churners compared to the other
variables of RFM (Miguéis et al., 2012). It describes how recently a customer did business with the company
(Chen et al., 2015). It is proposed that the more recent a customer buys products from the supplier, the lower
the probability that the customer is going to churn in the subsequent period. In other words, a customer that
is changing its purchasing behaviour significantly, by enlarging the number of days between purchases, will
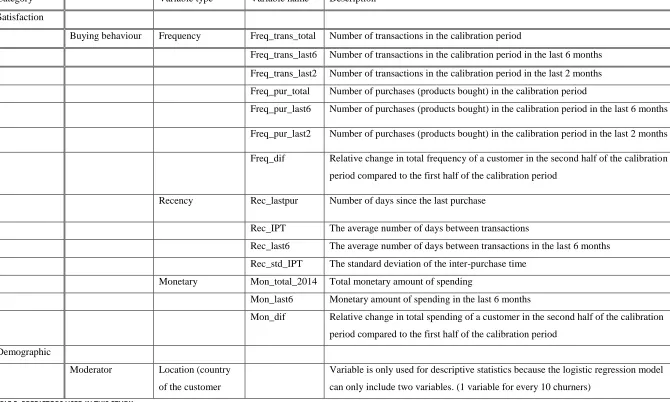
have a greater likelihood of churn. This study suggests four recency variables that explain the purchasing
behaviour based on the amount of days since the last transaction and the inter-purchase time (IPT). The
inter-purchase time is the time between two purchases. The variables are based on literature by Buckinx &
Van den Poel (2005), Jahromi et al. (2014), van den Poel, Lariviére (2004) and Chen et al. (2015).
First of all, three inter-purchase-time variables are suggested. The inter-purchase time is sometimes
mentioned in literature as the latency between purchases. The first suggested variable is for the whole
calibration period, the second one is for a more recent time period and the third one explains the standard
deviation between the IPT. The last variable explains the amount of days since the last transaction. These
variables could indicate attributes that are different for churners and behavioural loyal customers.
The p in the variable stands for the type of product or product categories that are taken into account. The
focus should be on product groups that have similar buying behaviour characteristics. The variables are
operationalized as follows.
1. 𝑇ℎ𝑒 𝑎𝑣𝑒𝑟𝑎𝑔𝑒 𝑛𝑢𝑚𝑏𝑒𝑟 𝑜𝑓 𝑑𝑎𝑦𝑠 𝑏𝑒𝑡𝑤𝑒𝑒𝑛 𝑡𝑟𝑎𝑛𝑠𝑎𝑐𝑡𝑖𝑜𝑛𝑠 (𝑓𝑜𝑟 𝑝𝑟𝑜𝑑𝑢𝑐𝑡𝑝)
2. 𝑇ℎ𝑒 𝑎𝑣𝑒𝑟𝑎𝑔𝑒 𝑛𝑢𝑚𝑏𝑒𝑟 𝑜𝑓 𝑑𝑎𝑦𝑠 𝑏𝑒𝑡𝑤𝑒𝑒𝑛 𝑡𝑟𝑎𝑛𝑠𝑎𝑐𝑡𝑖𝑜𝑛𝑠 𝑖𝑛 𝑡ℎ𝑒 𝑙𝑎𝑠𝑡𝑡 (𝑓𝑜𝑟 𝑝𝑟𝑜𝑑𝑢𝑐𝑡𝑝)
3. 𝑇ℎ𝑒 𝑠𝑡𝑎𝑛𝑑𝑎𝑟𝑑 𝑑𝑒𝑣𝑖𝑎𝑡𝑖𝑜𝑛 𝑜𝑓 𝑡ℎ𝑒 𝑖𝑛𝑡𝑒𝑟 − 𝑝𝑢𝑟𝑐ℎ𝑎𝑠𝑒 𝑡𝑖𝑚𝑒
4. 𝑁𝑢𝑚𝑏𝑒𝑟 𝑜𝑓 𝑑𝑎𝑦𝑠 𝑠𝑖𝑛𝑐𝑒 𝑡ℎ𝑒 𝑙𝑎𝑠𝑡 𝑡𝑟𝑎𝑛𝑠𝑎𝑐𝑡𝑖𝑜𝑛 (𝑓𝑜𝑟 𝑝𝑟𝑜𝑑𝑢𝑐𝑡𝑝)
Frequency of purchases
The second category of RFM is frequency. The extant literature of churn analysis has shown that the more
often a customer is purchasing, the less likely the customer is going to churn in the subsequent period
(Miguéis et al., 2012). Hence, a customer’s frequency of purchases is seen as a good predictor for their
future behaviour (Buckingx & Van den Poel, 2005; Jahromi et al., 2014; Chen et al., 2015).
Frequency is often measured through the number of purchases or transactions. In this study, a purchase
is defined as a single product bought while a transaction is an order that could consists of more purchases.
This study will use both concepts to measure the behavioural category frequency.
The first two variables are focusing on the amount of transactions. This is the original frequency