EUROPEAN ORGANISATION FOR NUCLEAR RESEARCH (CERN)
Eur. Phys. J. C(2016) 76: 392
DOI:10.1140/epjc/s10052-016-4184-8
CERN-EP-2016-080 14th December 2016
Search for squarks and gluinos in final states with jets and missing
transverse momentum at
√
s
=
13 TeV with the ATLAS detector
The ATLAS Collaboration
Abstract
A search for squarks and gluinos in final states containing hadronic jets, missing transverse momentum but no electrons or muons is presented. The data were recorded in 2015 by the ATLAS experiment in √s =13 TeV proton–proton collisions at the Large Hadron Collider. No excess above the Standard Model background expectation was observed in 3.2 fb−1 of analyzed data. Results are interpreted within simplified models that assumeR-parity is con-served and the neutralino is the lightest supersymmetric particle. An exclusion limit at the 95% confidence level on the mass of the gluino is set at 1.51 TeV for a simplified model incorporating only a gluino octet and the lightest neutralino, assuming the lightest neutralino is massless. For a simplified model involving the strong production of mass-degenerate first-and second-generation squarks, squark masses below 1.03 TeV are excluded for a massless lightest neutralino. These limits substantially extend the region of supersymmetric parameter space excluded by previous measurements with the ATLAS detector.
c
2016 CERN for the benefit of the ATLAS Collaboration.
Contents
1 Introduction 3
2 The ATLAS detector and data samples 3
3 Monte Carlo simulated samples 4
4 Object reconstruction and identification 7
5 Analysis strategy and fit description 8
6 Event selection and signal regions definitions 9
7 Background estimation and validation 11
8 Systematic uncertainties 14
9 Results, interpretation and limits 15
1 Introduction
Supersymmetry (SUSY) [1–6] is a generalization of space-time symmetries that predicts new bosonic partners for the fermions and new fermionic partners for the bosons of the Standard Model (SM). If
R-parity is conserved [7], SUSY particles (called sparticles) are produced in pairs and the lightest super-symmetric particle (LSP) is stable and represents a possible dark-matter candidate. The scalar partners of the left- and right-handed quarks, the squarks ˜qLand ˜qR, mix to form two mass eigenstates ˜q1and ˜q2
ordered by increasing mass. Superpartners of the charged and neutral electroweak and Higgs bosons also mix to produce charginos ( ˜χ±) and neutralinos ( ˜χ0). Squarks and the fermionic partners of the gluons, the gluinos ( ˜g), could be produced in strong-interaction processes at the Large Hadron Collider (LHC) [8] and decay via cascades ending with the stable LSP, which escapes the detector unseen, producing substantial missing transverse momentum (EmissT ).
The production of gluinos and squarks is the primary target for early supersymmetry searches in proton– proton (pp) collisions at a centre-of-mass energy of 13 TeV at the LHC because of the large expected cross-sections predicted for the production of supersymmetric particles which participate to the strong interaction. This document presents a search for these particles in final states containing only hadronic jets and large missing transverse momentum. Interest in this final state is motivated by the large number of
R-parity-conserving models [9,10] in which squarks (including anti-squarks) and gluinos can be produced in pairs ( ˜gg˜, ˜qq˜, ˜qg˜) and can decay through ˜q→qχ˜10and ˜g→qq¯χ˜01to the lightest neutralino, ˜χ01, assumed
to be the LSP. Additional decay modes can include the production of charginos via ˜q → qχ˜± (where ˜
qandq are of different flavour) and ˜g → qq¯χ˜±. Subsequent chargino decay to W±χ˜01 can lead to still larger multiplicities of jets. The analysis presented here adopts the same analysis strategy as the previous ATLAS search designed for the analysis of the 7 TeV and 8 TeV data collected during Run 1 of the LHC, described in Refs. [11–15]. The CMS Collaboration has set limits on similar models in Refs. [16–21].
In this search, events with reconstructed electrons or muons are rejected to reduce the background from events with neutrinos (W→eν, µν) and to avoid any overlap with a complementary ATLAS search in final states with one lepton, jets and missing transverse momentum [22]. The selection criteria are optimized in the (mg˜,mχ˜0
1) and (mq˜,mχ˜ 0
1) planes, (wheremg˜,mq˜andmχ˜ 0
1 are the gluino, squark and the LSP masses,
respectively) for simplified models [23–25] in which all other supersymmetric particles are assigned masses beyond the reach of the LHC. Although interpreted in terms of SUSY models, the results of this analysis could also constrain any model of new physics that predicts the production of jets in association with missing transverse momentum.
2 The ATLAS detector and data samples
The ATLAS detector [26] is a multi-purpose detector with a forward-backward symmetric cylindrical geometry and nearly 4π coverage in solid angle.1 The inner tracking detector (ID) consists of pixel
1 ATLAS uses a right-handed coordinate system with its origin at the nominal interaction point in the centre of the detector.
The positivex-axis is defined by the direction from the interaction point to the centre of the LHC ring, with the positivey-axis pointing upwards, while the beam direction defines thez-axis. Cylindrical coordinates (r, φ) are used in the transverse plane,φ being the azimuthal angle around thez-axis. The pseudorapidityηis defined in terms of the polar angleθbyη=−ln tan(θ/2) and the rapidity is defined asy=(1/2) ln[(E+pz)/(E−pz)] whereEis the energy andpzthe longitudinal momentum of the
and silicon microstrip detectors covering the pseudorapidity region|η| < 2.5, surrounded by a transition radiation tracker which improves electron identification over the region|η| < 2.0. The innermost pixel layer, the insertable B-layer [27], was added between Run 1 and Run 2 of the LHC, at a radius of 33 mm around a new, narrower and thinner, beam pipe. The ID is surrounded by a thin superconducting solenoid providing an axial 2 T magnetic field and by a fine-granularity lead/liquid-argon (LAr) electromagnetic calorimeter covering |η| < 3.2. A steel/scintillator-tile calorimeter provides hadronic coverage in the central pseudorapidity range (|η|<1.7). The endcap and forward regions (1.5<|η|<4.9) of the hadronic calorimeter are made of LAr active layers with either copper or tungsten as the absorber material. The muon spectrometer with an air-core toroid magnet system surrounds the calorimeters. Three layers of high-precision tracking chambers provide coverage in the range |η| < 2.7, while dedicated chambers allow triggering in the region|η|<2.4.
The ATLAS trigger system [28] consists of two levels; the first level is a hardware-based system, while the second is a software-based system called the High-Level Trigger. The events used in this search were selected using a trigger logic that accepts events with a missing transverse momentum above 70 GeV, calculated using a sum over calorimeter cells. The trigger is 100% efficient for the event selections considered in this analysis. Auxiliary data samples used to estimate the yields of background events were selected using triggers requiring at least one isolated electron (pT > 24 GeV), muon (pT > 20 GeV)
or photon (pT > 120 GeV). To increase the efficiency at high momenta, additional single-electron and single-muon triggers that do not require any isolation were included with thresholds ofpT=60 GeV and pT =50 GeV, respectively.
The dataset used in this analysis was collected in 2015 with the LHC colliding proton beams at a centre-of-mass energy of 13 TeV, with 25 ns bunch spacing. The peak delivered instantaneous luminosity was
L = 5.2×1033 cm−2s−1 and the mean number of additional ppinteractions per bunch crossing in the dataset washµi=14. Application of beam, detector and data-quality criteria resulted in a total integrated luminosity of 3.2 fb−1. The uncertainty in the integrated luminosity is ±5%. It is derived, following a methodology similar to that detailed in Ref. [29], from a preliminary calibration of the luminosity scale using a pair ofx–ybeam-separation scans performed in August 2015.
3 Monte Carlo simulated samples
Simulated Monte Carlo (MC) data samples are used to optimize the selections, estimate backgrounds and assess the sensitivity to specific SUSY signal models.
SUSY signals are described in this paper by simplified models. They are defined by an effective Lag-rangian describing the interactions of a small number of new particles, typically assuming one production process and one decay channel with a 100% branching fraction. Signal samples used to describe squark-and gluino-pair production, followed by the direct2decays of squarks ( ˜q→qχ˜01) and direct ( ˜g→qq¯χ˜01) or one-step3( ˜g→qq¯0Wχ˜01) decays of gluinos as shown in Figure1, are generated with up to two extra par-tons in the matrix element using MG5_aMC@NLO event generator [30] interfaced to Pythia8.186 [31].
The CKKW-L merging scheme [32] is applied with a scale parameter that is set to a quarter of the mass of the gluino for ˜gg˜ production or of the squark for ˜qq˜ production. The A14 [33] set of tuned paramet-ers (tune) is used for underlying event together with the NNPDF2.3LO [34] parton distribution function
2Direct decays are those where the considered SUSY particles decay directly into SM particles and the LSP.
(PDF) set. The EvtGen v1.2.0 program [35] is used to describe the properties of theb- andc- hadron
decays in the signal samples and the background samples except those produced with Sherpa[36]. The
signal cross-sections are calculated at next-to-leading order (NLO) in the strong coupling constant, adding the resummation of soft gluon emission at next-to-leading-logarithmic accuracy (NLO+NLL) [37–41]. The nominal cross-section is taken from an envelope of cross-section predictions using different PDF sets and factorization and renormalization scales, as described in Ref. [42], considering only light-flavour quarks (u,d,s,c). Cross-sections are evaluated assuming masses of 450 TeV for the light-flavour squarks in case of gluino- or gluinos in case of squark-pair production. The free parameters aremχ˜0
1 andmq˜ (mg˜)
for gluino-pair (squark-pair) production models.
[image:5.595.109.499.236.348.2](a) (b) (c)
Figure 1: The decay topologies of (a) squark-pair production and (b, c) gluino-pair production, in the simplified models with direct decays of squarks and direct or one-step decays of gluinos.
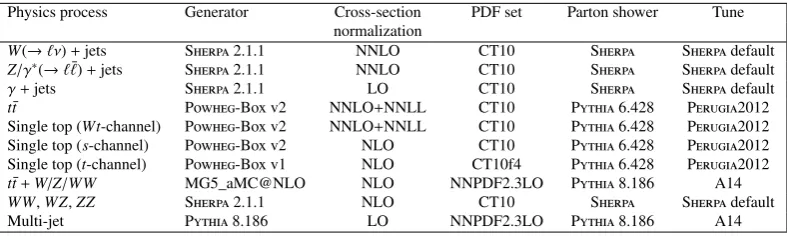
A summary of the SM background processes together with the MC generators, cross-section calculation orders inαs, PDFs, parton shower and tunes used is given in Table1.
Table 1: The Standard Model background Monte Carlo simulation samples used in this paper. The generators, the
order inαsof cross-section calculations used for yield normalization, PDF sets, parton showers and tunes used for
the underlying event are shown.
Physics process Generator Cross-section PDF set Parton shower Tune normalization
W(→`ν)+jets Sherpa2.1.1 NNLO CT10 Sherpa Sherpadefault
Z/γ∗(→``¯)+jets Sherpa2.1.1 NNLO CT10 Sherpa Sherpadefault
γ+jets Sherpa2.1.1 LO CT10 Sherpa Sherpadefault
t¯t Powheg-Boxv2 NNLO+NNLL CT10 Pythia6.428 Perugia2012 Single top (Wt-channel) Powheg-Boxv2 NNLO+NNLL CT10 Pythia6.428 Perugia2012 Single top (s-channel) Powheg-Boxv2 NLO CT10 Pythia6.428 Perugia2012 Single top (t-channel) Powheg-Boxv1 NLO CT10f4 Pythia6.428 Perugia2012
t¯t+W/Z/WW MG5_aMC@NLO NLO NNPDF2.3LO Pythia8.186 A14
WW,WZ,ZZ Sherpa2.1.1 NLO CT10 Sherpa Sherpadefault Multi-jet Pythia8.186 LO NNPDF2.3LO Pythia8.186 A14
The production ofγ, W orZ bosons in association with jets [43] is simulated using the Sherpa 2.1.1
generator. For W orZ bosons, the matrix elements are calculated for up to two partons at NLO and up to two additional partons at leading order (LO) using the Comix [44] and OpenLoops [45]
matrix-element generators, and merged with the Sherpaparton shower [46] using the ME+PS@NLO prescription
[image:5.595.109.503.504.622.2]four partons depending on the pT of the photon, and merged with the Sherpaparton shower using the
ME+PS@LO prescription [48]. In both cases (W/Z+jets orγ+jets production), the CT10 PDF set [49] is used in conjunction with dedicated parton shower-tuning developed by the authors of Sherpa. TheW/Z
+ jets events are normalized to their NNLO cross-sections [50]. For the γ+jets process the LO cross-section, taken directly from the SherpaMC generator, is multiplied by a correction factor as described in
Section7.
For the generation oftt¯and single-top processes in theWt ands-channel [51] the Powheg-Boxv2 [52]
generator is used with the CT10 PDF set. The electroweak (EW)t-channel single-top events are generated using the Powheg-Boxv1 generator. This generator uses the four-flavour scheme for the NLO
matrix-element calculations together with the fixed four-flavour PDF set CT10f4 [49]. For this process, the decay of the top quark is simulated using MadSpintool [53] preserving all spin correlations, while for all
processes the parton shower, fragmentation, and the underlying event are generated using Pythia6.428
[54] with the CTEQ6L1 [55] PDF set and the corresponding Perugia2012 tune (P2012) [56]. The top
quark mass is set to 172.5 GeV. Thehdampparameter, which controls thepTof the first additional emission
beyond the Born configuration, is set to the mass of the top quark. The main effect of this is to regulate the high-pT emission against which the ttbar system recoils [51]. The tt¯events are normalized to the
NNLO+NNLL [57,58]. Thes- andt-channel single-top events are normalized to the NLO cross-sections [59,60], and theWt-channel single-top events are normalized to the NNLO+NNLL [61,62].
For the generation oftt¯+EW processes (tt¯+W/Z/WW) [63], the MG5_aMC@NLO [30] generator at LO interfaced to the Pythia8.186 parton-shower model is used, with up to two (tt¯+W), one (tt¯+Z)
or no (tt¯+WW) extra partons included in the matrix element. The ATLAS underlying-event tune A14 is used together with the NNPDF2.3LO PDF set. The events are normalized to their respective NLO cross-sections [64,65].
Diboson processes (WW,WZ, ZZ) [66] are simulated using the Sherpa2.1.1 generator. For processes
with four charged leptons (4`), three charged leptons and a neutrino (3`+1ν) or two charged leptons and two neutrinos (2`+2ν), the matrix elements contain all diagrams with four electroweak vertices, and are calculated for up to one (4`, 2`+2ν) or no partons (3`+1ν) at NLO and up to three partons at LO using the Comixand OpenLoopsmatrix-element generators, and merged with the Sherpaparton shower using the
ME+PS@NLO prescription. For processes in which one of the bosons decays hadronically and the other leptonically, matrix elements are calculated for up to one (ZZ) or no (WW,WZ) additional partons at NLO and for up to three additional partons at LO using the Comixand OpenLoopsmatrix-element generators,
and merged with the Sherpaparton shower using the ME+PS@NLO prescription. In all cases, the CT10
PDF set is used in conjunction with a dedicated parton-shower tuning developed by the authors of Sherpa.
The generator cross-sections are used in this case.
The multi-jet background is generated with Pythia8.186 using the A14 underlying-event tune and the
NNPDF2.3LO parton distribution functions.
For all Standard Model background samples the response of the detector to particles is modelled with a full ATLAS detector simulation [67] based on Geant4 [68]. Signal samples are prepared using a fast
simulation based on a parameterization of the performance of the ATLAS electromagnetic and hadronic calorimeters [69] and on Geant4 elsewhere.
All simulated events are overlaid with multiple ppcollisions simulated with the soft QCD processes
of Pythia8.186 using the A2 tune [33] and the MSTW2008LO parton distribution functions [70]. The
4 Object reconstruction and identification
The reconstructed primary vertex of the event is required to be consistent with the luminous region and to have at least two associated tracks withpT>400 MeV. When more than one such vertex is found, the vertex with the largestP
p2Tof the associated tracks is chosen.
Jet candidates are reconstructed using the anti-ktjet clustering algorithm [71,72] with jet radius parameter
of 0.4 and starting from clusters of calorimeter cells [73]. The jets are corrected for energy from pile-up using the method suggested in Ref. [74]: a contribution equal to the product of the jet area and the median energy density of the event is subtracted from the jet energy [75]. Further corrections, referred to as the jet energy scale corrections, are derived from MC simulation and data and used to calibrate on average the energies of jets to the scale of their constituent particles [76]. Only jet candidates with pT > 20 GeV
and|η|< 2.8 after all corrections are retained. An algorithm based on boosted decision trees, ‘MV2c20’ [77], is used to identify jets containing ab-hadron (b-jets), with an operating point corresponding to an efficiency of 77% in simulatedtt¯events, along with a rejection factor of 140 for gluon and light-quark jets and of 4.5 for charm jets [77,78]. Candidateb-tagged jets are required to havepT >50 GeV and|η|<2.5.
Events with jets originating from detector noise and non-collision background are rejected if the jets fail to satisfy the ‘LooseBad’ quality criteria, or if at least one of the two leading jets withpT >100 GeV fails
to satisfy the ‘TightBad’ quality criteria, both described in Ref. [79]. These selections affect less than 1% of the events used in the search.
Two different classes of reconstructed lepton candidates (electrons or muons) are used in this analysis. When selecting samples used for the search, events containing a ‘baseline’ electron or muon are rejected. The selections applied to identify baseline leptons are designed to maximize the efficiency with which
W+jets and top quark background events are rejected. When selecting ‘control region’ samples for the purpose of estimating residualW+jets and top quark backgrounds, additional requirements are applied to leptons to ensure greater purity of the these backgrounds. These leptons are referred to as ‘high-purity’ leptons below and form a subset of the baseline leptons.
Baseline muon candidates are formed by combining information from the muon spectrometer and in-ner tracking detectors as described in Ref. [80] and are required to have pT > 10 GeV and |η| < 2.7.
High-purity muon candidates must additionally have|η| < 2.4, the significance of the transverse impact parameter with respect to the primary vertex,|dPV0 |/σ(dPV0 ) <3, the longitudinal impact parameter with respect to the primary vertex|zPV0 sin(θ)|<0.5 mm, and to satisfy ‘GradientLoose’ isolation requirements described in Ref. [80] which rely on the use of tracking-based and calorimeter-based variables and im-plement a set ofη- andpT-dependent criteria. The leading muon is also required to havepT>25 GeV.
Baseline electron candidates are reconstructed from an isolated electromagnetic calorimeter energy de-posit matched to an ID track and are required to have pT > 10 GeV,|η| < 2.47, and to satisfy ‘Loose’
likelihood-based identification criteria described in Ref. [81]. High-purity electron candidates addition-ally must satisfy ‘Tight’ selection criteria described in Ref. [81], and the leading electron must have
pT > 25 GeV. They are also required to have|dPV0 |/σ(d0PV) < 5, |zPV0 sin(θ)| < 0.5 mm, and to satisfy
similar isolation requirements as those applied to high-purity muons.
After the selections described above, ambiguities between candidate jets with|η| < 2.8 and leptons are resolved as follows: first, any such jet candidate lying within a distance∆R≡ p(∆y)2+(∆φ)2=0.2 of a
radiate a photon and be misidentified as a jet) and the number of tracks associated with the jet is less than three.
Additional ambiguities between electrons and muons in a jet, originating from the decays of hadrons, are resolved to avoid double counting and/or remove non-isolated leptons: the electron is discarded if a baseline electron and a baseline muon share the same ID track. If two baseline electrons are within∆R=
0.05, the electron with the lowestpT is discarded.
The measurement of the missing transverse momentum vectorEmissT (and its magnitudeEmissT ) is based on the calibrated transverse momenta of all electron, muon, photon and jet candidates and all tracks originating from the primary vertex and not associated with such objects [82].
Reconstructed photons, although not used in the main signal-event selection, are selected in the region used to constrain theZ+jets background, as explained in Section7. Photon candidates are required to satisfypT > 130 GeV and|η|< 2.37, to satisfy photon shower shape and electron rejection criteria [83],
and to be isolated. Ambiguities between candidate jets and photons (when used in the event selection) are resolved by discarding any jet candidates lying within∆R= 0.4 of a photon candidate. Additional selections to remove ambiguities between electrons or muons and photons are applied such that the photon is discarded if it is within∆R=0.4 of an electron or muon.
Corrections derived from data control samples are applied to account for differences between data and simulation for the lepton trigger and reconstruction efficiencies, the lepton momentum/energy scale and resolution, and for the efficiency and mis-tag rate of theb-tagging algorithm.
5 Analysis strategy and fit description
To search for a possible signal, selections are defined to enhance the signal relative to the SM background. These signal region (SR) selections are optimized to maximize the expected significance for each model considered using MC simulation for the signal and the SM backgrounds. To estimate the SM backgrounds in a consistent and robust fashion, corresponding control regions (CRs) are defined for each of the signal regions. They are chosen to be non-overlapping with the SR selections in order to provide independent data samples enriched in particular background sources, and are used to normalize the background MC simulation. The CR selections are optimized to have negligible SUSY signal contamination for the mod-els near the previously excluded boundary [14], while minimizing the systematic uncertainties arising from the extrapolation of the CR event yields to estimate backgrounds in the SR. Cross-checks of the background estimates are performed with data in several validation regions (VRs) selected with require-ments such that these regions do not overlap with the CR and SR selections, again with a low expected signal contamination.
To extract the final results, three different classes of likelihood fit are employed: background-only, model-independent and model-dependent fits [84]. A background-only fit is used to estimate the background yields in each SR. The fit is performed using as constraints only the observed event yields from the CRs associated with the SR, but not the SR itself. It is assumed that signal events from physics beyond the Standard Model (BSM) do not contribute to these yields. The scale factors (µW+jets,µZ+jets,µTop,µMulti−jet)
considered and by Poisson distributions, respectively. The background-only fit is also used to estimate the background event yields in the VRs.
If no excess is observed, a model-independent fit is used to set upper limits on the number of BSM signal events in each SR. This fit proceeds in the same way as the background-only fit, except that the number of events observed in the SR is added as an input to the fit, and the BSM signal strength, constrained to be non-negative, is added as a free parameter. The observed and expected upper limits at 95% confidence level (CL) on the number of events from BSM phenomena for each signal region (S95obs and Sexp95) are derived using theCLs prescription [85], neglecting any possible signal contamination in the control
re-gions. These limits, when normalized by the integrated luminosity of the data sample, may be interpreted as upper limits on the visible cross-section of BSM physics (hσi95
obs), where the visible cross-section is
defined as the product of production cross-section, acceptance and efficiency. The model-independent fit is also used to compute the one-sidedp-value (p0) of the background-only hypothesis, which quantifies the statistical significance of an excess.
Finally, model-dependent fits are used to set exclusion limits on the signal cross-sections for specific SUSY models. Such a fit proceeds in the same way as the model-independent fit, except that both the yield in the signal region and the signal contamination in the CRs are taken into account. Correlations between signal and background systematic uncertainties are taken into account where appropriate. Signal-yield systematic uncertainties due to detector effects and the theoretical uncertainties in the signal acceptance are included in the fit.
6 Event selection and signal regions definitions
Due to the high mass scale expected for the SUSY models considered in this study, the ‘effective mass’,
meff, is a powerful discriminant between the signal and most SM backgrounds. When selecting events with at leastNj jets,meff(Nj) is defined to be the scalar sum of the transverse momenta of the leadingNj
jets andETmiss. Requirements placed onmeffandETmissform the basis of this search by strongly suppressing
the multi-jet background where jet energy mismeasurement generates missing transverse momentum. The final signal selection uses requirements on bothmeff(incl.), which sums over all jets with pT > 50 GeV
andETmiss, which is required to be larger than 200 GeV.
Following the object reconstruction described in Section4, events are discarded if a baseline electron or muon with pT > 10 GeV remains, or if they contain a jet failing to satisfy quality selection criteria
designed to suppress detector noise and non-collision backgrounds (described in Section4). Events are also rejected if no jets with pT > 50 GeV are found. Reconstructed photons and hadronically decaying
τ-leptons are not used in SR selections.
In order to maximize the sensitivity in the (mg˜,mq˜) plane, a variety of signal regions are defined. Squarks
typically generate at least one jet in their decays, for instance through ˜q →qχ˜01, while gluinos typically
generate at least two jets, for instance through ˜g→qq¯χ˜10. Processes contributing to ˜qq˜and ˜gg˜ final states therefore lead to events containing at least two or four jets, respectively. Decays of heavy SUSY and SM particles produced in longer ˜qand ˜g decay cascades (e.g. ˜χ±1 → qq0χ˜01) tend to further increase the jet
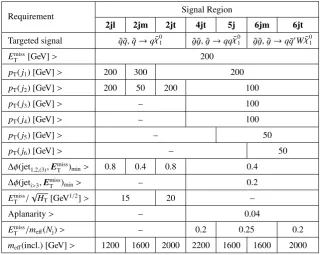
Seven inclusive SRs characterized by increasing minimum jet multiplicity from two to six, are defined in Table2. Some of them require the same jet-multiplicity, but are distinguished by increasing background rejection, ranging from ‘loose’ (labelled ‘l’) to ‘tight’ (labelled ‘t’).
In each region, different thresholds are applied on jet momenta and on∆φ(jet,Emiss
T )min, which is defined
to be the smallest azimuthal separation betweenEmissT and the momenta of any of the reconstructed jets with pT > 50 GeV. Requirements on ∆φ(jet,EmissT )min and ETmiss/meff(Nj) are designed to reduce the
background from multi-jet processes. For the SRs which are optimized for squark-pair (gluino-pair) production followed by the direct decay of squarks (gluinos), the selection requires∆φ(jet,EmissT )min>0.8
(∆φ(jet,EmissT )min > 0.4) using up to three leading jets present in the event. For the SRs requiring at
least four jets in the final state, an additional requirement∆φ(jet,Emiss
T )min > 0.2 is placed on all jets.
Signal region 2jm makes use of the presence of jets due to initial-state radiation by requiring a higher
pT threshold for the most energetic jet in the event, and is optimized to target models with small mass differences between the SUSY particles (compressed scenarios).
In the 2-jet SRs the requirement onEmissT /meff(Nj) is replaced by a requirement onEmissT /
√
HT(whereHT
is defined as the scalar sum of the transverse momenta of all jets), which was found to lead to enhanced sensitivity to models characterized by ˜qq˜ production. In the other regions, additional suppression of background processes is based on the aplanarity variable, which is defined asA=3/2λ3, whereλ3is the
[image:10.595.144.468.449.704.2]smallest eigenvalue of the normalized momentum tensor of the jets [86].
Table 2: Selection criteria and targeted signal model used to define each of the signal regions in the analysis. Each SR is labelled with the inclusive jet multiplicity considered (‘2j’, ‘4j’ etc.) together with the degree of background
rejection. The latter is denoted by labels ‘l’ (‘loose’), ‘m’ (‘medium’) and ‘t’ (‘tight’). TheETmiss/meff(Nj) cut in any
Nj-jet channel uses a value ofmeffconstructed from only the leadingNjjets (meff(Nj)). However, the finalmeff(incl.)
selection, which is used to define the signal regions, includes all jets withpT >50 GeV.
Requirement Signal Region
2jl 2jm 2jt 4jt 5j 6jm 6jt
Targeted signal q˜q˜, ˜q→qχ˜01 g˜g˜, ˜g→qqχ˜
0
1 g˜g˜, ˜g→qq¯0Wχ˜ 0 1
Emiss
T [GeV]> 200
pT(j1) [GeV]> 200 300 200
pT(j2) [GeV]> 200 50 200 100
pT(j3) [GeV]> – 100
pT(j4) [GeV]> – 100
pT(j5) [GeV]> – 50
pT(j6) [GeV]> – 50
∆φ(jet1,2,(3),EmissT )min> 0.8 0.4 0.8 0.4
∆φ(jeti>3,E miss
T )min> – 0.2
Emiss T /
√
HT[GeV1/2]> 15 20 –
Aplanarity> – 0.04
Emiss
T /meff(Nj)> – 0.2 0.25 0.2
7 Background estimation and validation
Standard Model background processes contribute to the event counts in the signal regions. The domin-ant sources are: Z+jets,W+jets, top quark pairs, single top quarks, dibosons and multi-jet production. Diboson production is estimated with MC simulated data normalized to NLO cross-section predictions, as described in Section3. Most of theW+jets background is composed ofW →τνevents in which the
τ-lepton decays to hadrons, with additional contributions from W → eν, µνevents in which no baseline electron or muon is reconstructed. The largest part of the Z+jets background comes from the irredu-cible component in which Z → νν¯ decays generate large EmissT . Top quark pair production followed by semileptonic decays, in particulartt¯→ bb¯τνqq0 (with theτ-lepton decaying to hadrons), as well as single-top-quark events, can also generate largeEmissT and satisfy the jet and lepton-veto requirements. The multi-jet background in the signal regions is due to missing transverse momentum from misrecon-struction of jet energies in the calorimeters, as well as neutrino production in semileptonic decays of heavy-flavour hadrons. After applying the requirements based on ∆φ(jet,Emiss
T )min and ETmiss/meff(Nj)
[image:11.595.100.506.388.470.2]listed in Table2the remaining multi-jet background is negligible.
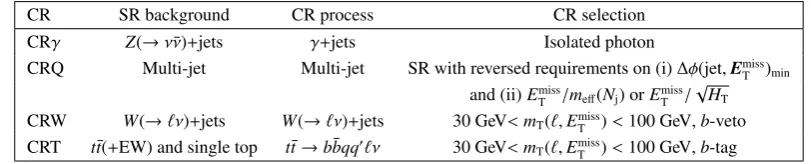
Table 3: Control regions used in the analysis. Also listed are the main targeted background in the SR in each case, the process used to model the background, and the main CR requirement(s) used to select this process. The transverse momenta of high-purity leptons (photons) used to select CR events must exceed 25 (130) GeV. The jet
pTthresholds andmeff(incl.) selections match those used in the corresponding SRs.
CR SR background CR process CR selection
CRγ Z(→νν¯)+jets γ+jets Isolated photon
CRQ Multi-jet Multi-jet SR with reversed requirements on (i)∆φ(jet,Emiss
T )min
and (ii)Emiss
T /meff(Nj) orEmissT /
√
HT
CRW W(→`ν)+jets W(→`ν)+jets 30 GeV<mT(`,EmissT )<100 GeV,b-veto
CRT tt¯(+EW) and single top tt¯→bbqq¯ 0`ν 30 GeV<
mT(`,EmissT )<100 GeV,b-tag
In order to estimate the backgrounds in a consistent and robust fashion, four control regions are defined for each of the seven signal regions, giving 28 CRs in total. The CR selections are optimized to maintain adequate statistical precision while minimizing the systematic uncertainties arising from the extrapolation of the CR event yield to estimate the background in the SR. This latter requirement is addressed through the use of CR jet pT thresholds and meff(incl.) selections which match those used in the SR. The CR
definitions are listed in Table3.
The CRγregion is used to estimate the contribution ofZ(→νν¯)+jets background events to each SR by selecting a sample ofγ+jets events with pT(γ) > 130 GeV and then treating the reconstructed photon
as contributing toEmissT . For pT(γ) significantly larger thanmZ the kinematic properties of such events
The CRW and CRT regions aim to select samples rich inW(→`ν)+jets and semileptonictt¯background events respectively. Consequently, they differ in their number ofb-jets (zero or greater or equal to one respectively) but apply the same selection requirements on the transverse massmT formed by theETmiss
and a high-purity lepton withpT >25 GeV. These samples are used to estimate respectively theW+jets
and combinedtt¯and single-top background populations, treating the lepton as a jet with the same mo-mentum to model background events in which a hadronically decaying τ-lepton is produced or events in which no baseline electron or muon is reconstructed because it is outside the detector acceptance or below the required pT threshold. The CRW and CRT selections omit the SR selection requirements on
∆φ(jet,EmissT )minorETmiss/meff(Nj) (EmissT /
√
HTwhere appropriate) in order to increase the number of CR data events without significantly increasing the theoretical uncertainties associated with the background estimation procedure.
The CRQ region uses reversed selection requirements on ∆φ(jet,EmissT )min and on ETmiss/meff(Nj) (or ETmiss/√HTwhere appropriate) to produce samples enriched in multi-jet background events.
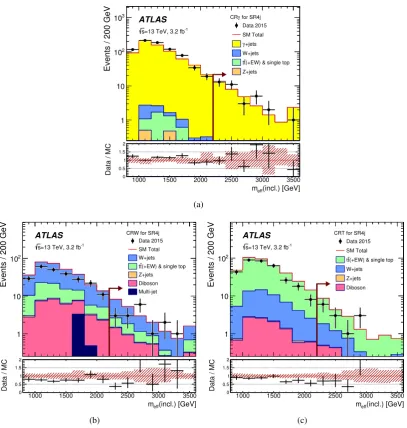
As an example, themeff(incl.) distributions in control regions associated with SR 4jt are shown in
Fig-ure2. In all CRs, the data are consistent with the pre-fit MC background prediction within uncertainties, although the overall normalization is lower by approximately one standard deviation.
The background estimation procedure is validated by comparing the numbers of events observed in the VRs to the corresponding SM background expectations obtained from the background-only fits. Several VR samples are selected with requirements distinct from those used in the CRs, which maintain a low probability of signal contamination.
The CRγ estimates of theZ(→ νν¯)+jets background are validated using the samples of Z(→ ``¯)+jets events selected by requiring high-purity lepton pairs of opposite sign and identical flavour for which the dilepton invariant mass lies within 25 GeV of the mass of theZ boson (VRZ). In VRZ, the leptons are treated as contributing toETmiss.
The CRW and CRT estimates of theW+jets and top quark background are validated with the same CRW and CRT selections, but reinstating the requirement on∆φ(jet,EmissT )minandETmiss/meff(Nj) (orEmissT /
√
HT
as appropriate), and treating the lepton either as a jet (VRW, VRT) or as contributing to EmissT (VRWν, VRTν).
The CRQ estimates of the multi-jet background are validated with VRs for which the CRQ selection is ap-plied, but with the SRETmiss/meff(Nj) (EmissT /
√
HT) requirement reinstated (VRQa), or with a requirement
of an intermediate value of∆φ(jet,EmissT )minapplied (VRQb).
(incl.) [GeV] eff
m
1000 1500 2000 2500 3000 3500
Events / 200 GeV
1 10 2 10 3 10 ATLAS -1 =13 TeV, 3.2 fb s for SR4j γ CR Data 2015 SM Total +jets γ W+jets
(+EW) & single top t t Z+jets (incl.) [GeV] eff m
1000 1500 2000 2500 3000 3500
Data / MC 0.50 1 1.5 2 (a) (incl.) [GeV] eff m
1000 1500 2000 2500 3000 3500
Events / 200 GeV
1 10 2 10 ATLAS -1
=13 TeV, 3.2 fb s
CRW for SR4j Data 2015 SM Total W+jets
(+EW) & single top t t Z+jets Diboson Multi-jet (incl.) [GeV] eff m
1000 1500 2000 2500 3000 3500
Data / MC 0.50
1 1.5 2 (b) (incl.) [GeV] eff m
1000 1500 2000 2500 3000 3500
Events / 200 GeV
1 10 2 10 ATLAS -1 =13 TeV, 3.2 fb s
CRT for SR4j Data 2015
SM Total
(+EW) & single top t t W+jets Z+jets Diboson (incl.) [GeV] eff m
1000 1500 2000 2500 3000 3500
Data / MC 0.50 1 1.5 2
[image:13.595.104.512.144.573.2](c)
Figure 2: Observedmeff(incl.) distributions in control regions (a) CRγ, (b) CRW and (c) CRT after selecting events
withEmissT >200 GeV and at least four energetic jets with the corresponding transverse momenta as indicated in
Table2for SR 4jt. No selection requirements on∆φ(jet,Emiss
T )minorE miss
T /meff(Nj) are applied in these distributions.
The arrows indicate the values at which the requirements onmeff(incl.) are applied. The histograms denote the
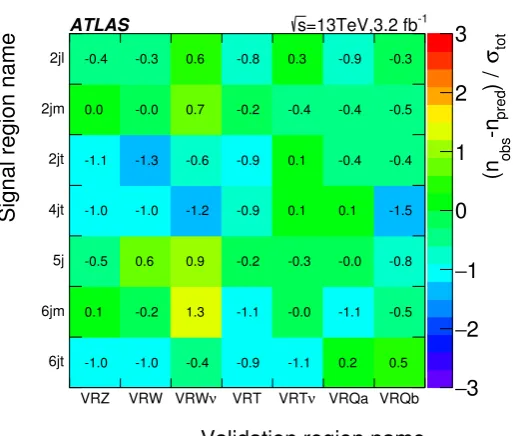
tot σ ) / pred -n obs (n 3 − 2 − 1 − 0 1 2 3
Validation region name VRZ VRW VRWν VRT VRTν VRQa VRQb
Signal region name
[image:14.595.174.432.104.322.2]6jt 6jm 5j 4jt 2jt 2jm 2jl -1.0 0.1 -0.5 -1.0 -1.1 0.0 -0.4 -1.0 -0.2 0.6 -1.0 -1.3 -0.0 -0.3 -0.4 1.3 0.9 -1.2 -0.6 0.7 0.6 -0.9 -1.1 -0.2 -0.9 -0.9 -0.2 -0.8 -1.1 -0.0 -0.3 0.1 0.1 -0.4 0.3 0.2 -1.1 -0.0 0.1 -0.4 -0.4 -0.9 0.5 -0.5 -0.8 -1.5 -0.4 -0.5 -0.3 -1 =13TeV,3.2 fb s ATLAS
Figure 3: Differences between the numbers of observed events in data and the SM background predictions for each
VR, expressed as a fraction of the total uncertainty which combines the uncertainty on the background expectations, and the expected statistical uncertainty of the test obtained from the number of expected events.
8 Systematic uncertainties
Systematic uncertainties in background estimates arise from the use of extrapolation factors which relate observations in the control regions to background expectations in the signal regions, and from the MC modelling of minor backgrounds.
The overall background uncertainties, detailed in Table4, range from 8% in SR 2jl to 29% in SR 6jt. In SR 2jl the loose selection minimizes theoretical uncertainties and the impact of statistical fluctuations in the CRs, while the opposite is true in SR 6jt.
For the backgrounds estimated with MC simulation-derived extrapolation factors, the primary common sources of systematic uncertainty are the jet energy scale (JES) calibration, jet energy resolution (JER), theoretical uncertainties, and limited event yields in the MC samples and data CRs. Correlations between uncertainties (for instance between JES or JER uncertainties in CRs and SRs) are taken into account where appropriate.
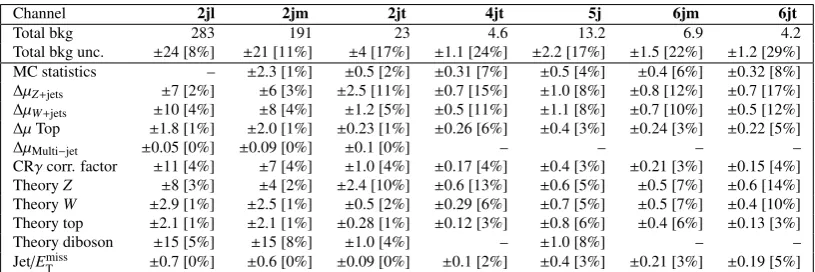
Table 4: Breakdown of the dominant systematic uncertainties in the background estimates. The individual
un-certainties can be correlated, and do not necessarily add in quadrature to the total background uncertainty. ∆µ
uncertainties are the result of the control region statistical uncertainties and the systematic uncertainties entering a specific control region. In brackets, uncertainties are given relative to the expected total background yield, also presented in the Table. Empty cells (indicated by a ‘-’) correspond to uncertainties lower than 1 per mil.
Channel 2jl 2jm 2jt 4jt 5j 6jm 6jt
Total bkg 283 191 23 4.6 13.2 6.9 4.2
Total bkg unc. ±24 [8%] ±21 [11%] ±4 [17%] ±1.1 [24%] ±2.2 [17%] ±1.5 [22%] ±1.2 [29%] MC statistics – ±2.3 [1%] ±0.5 [2%] ±0.31 [7%] ±0.5 [4%] ±0.4 [6%] ±0.32 [8%]
∆µZ+jets ±7 [2%] ±6 [3%] ±2.5 [11%] ±0.7 [15%] ±1.0 [8%] ±0.8 [12%] ±0.7 [17%] ∆µW+jets ±10 [4%] ±8 [4%] ±1.2 [5%] ±0.5 [11%] ±1.1 [8%] ±0.7 [10%] ±0.5 [12%]
∆µTop ±1.8 [1%] ±2.0 [1%] ±0.23 [1%] ±0.26 [6%] ±0.4 [3%] ±0.24 [3%] ±0.22 [5%]
∆µMulti−jet ±0.05 [0%] ±0.09 [0%] ±0.1 [0%] – – – –
CRγcorr. factor ±11 [4%] ±7 [4%] ±1.0 [4%] ±0.17 [4%] ±0.4 [3%] ±0.21 [3%] ±0.15 [4%] TheoryZ ±8 [3%] ±4 [2%] ±2.4 [10%] ±0.6 [13%] ±0.6 [5%] ±0.5 [7%] ±0.6 [14%] TheoryW ±2.9 [1%] ±2.5 [1%] ±0.5 [2%] ±0.29 [6%] ±0.7 [5%] ±0.5 [7%] ±0.4 [10%] Theory top ±2.1 [1%] ±2.1 [1%] ±0.28 [1%] ±0.12 [3%] ±0.8 [6%] ±0.4 [6%] ±0.13 [3%] Theory diboson ±15 [5%] ±15 [8%] ±1.0 [4%] – ±1.0 [8%] – – Jet/EmissT ±0.7 [0%] ±0.6 [0%] ±0.09 [0%] ±0.1 [2%] ±0.4 [3%] ±0.21 [3%] ±0.19 [5%]
Uncertainties arising from theoretical modelling of background processes are evaluated by comparing samples produced with different MC generators. TheW/Z+jets events generated with Sherpaare
com-pared to events generated with MG5_aMC@NLO at leading order and interfaced to the Pythia 8.186
parton shower model. Uncertainties in the modelling of top quark pair production are estimated by com-paring Powheg-Box to aMc@Nlo[90], and by accounting for different generator and radiation tunes.
Uncertainties associated with PDF modelling of top quark pair production are found to be negligible. Uncertainties in diboson production due to PDF, renormalization, factorization and resummation scale uncertainties (estimated by increasing and decreasing the scales used in the MC generators by a factor of two) are accounted for by applying a uniform 50% uncertainty in all SRs, and are the dominant source of uncertainty in SRs 2jl and 2jm. Uncertainties associated with the modelling ofZ+jets production are largest in the SRs with tight selection cuts (up to 14%). The statistical uncertainty arising from the use of MC samples is largest (8%) in SR 6jt. The uncertainties arising from the data-driven correction procedure applied to events selected in the CRγregion, described in Section7, are included in Table4under ‘CRγ corr. factor’ and reach a value of 4% in most of the SRs. The impact of lepton reconstruction uncertain-ties, and of the uncertainties related to theb-tag/b-veto efficiency, on the overall background uncertainty are found to be negligible for all SRs. The total background uncertainties for all SRs, broken down into the main contributing sources, are summarized in Table4.
9 Results, interpretation and limits
Table 5: Numbers of events observed in the signal regions used in the analysis compared with background expecta-tions obtained from the fits described in the text. No signal contribution is considered in the CRs for the fit. Empty
cells (indicated by a ‘-’) correspond to estimates lower than 0.01. The p-values (p0) give the probabilities of the
ob-servations being consistent with the estimated backgrounds. For an observed number of events lower than expected,
the p-value is truncated at 0.5. Between parentheses,p-values are also given as the number of equivalent Gaussian
standard deviations (Z). Also shown are 95% CL upper limits on the visible cross-section (hσi95
obs), the visible
number of signal events (Sobs95 ) and the number of signal events (S95exp) given the expected number of background
events (and±1σexcursions of the expectation).
Signal Region 2jl 2jm 2jt 4jt 5j 6jm 6jt
MC expected events
Diboson 31 31 3.5 0.6 2.1 0.9 0.4
Z/γ∗+jets 167 104 13 2.0 5.4 2.8 1.4
W+jets 80 46 5.0 1.1 3.4 1.7 1.0
tt¯(+EW)+single top 18 17 1.3 0.9 2.7 1.6 1.0
Multi-jet 0.7 0.8 0.04 – – – –
Total MC 296 199 23 4.6 14 7.0 3.8
Fitted background events
Diboson 31±15 31±16 3.5±1.8 0.6±0.3 2.1±1.1 0.9±0.5 0.43±0.27
Z/γ∗+jets 170±16 114±11 16±4 2.5±0.9 6.0±1.3 3.2±1.0 2.2±1.0
W+jets 68±10 35±9 3.5±1.3 0.9±0.6 3.5±1.3 1.9±0.9 1.2±0.7
tt¯(+EW)+single top 14±3 10±3 0.7±0.4 0.6±0.3 1.7±0.9 0.9±0.5 0.32±0.26 Multi-jet 0.49±0.05 0.6±0.4 0.02±0.10 – – – – Total bkg 283±24 191±21 23±4 4.6±1.1 13.2±2.2 6.9±1.5 4.2±1.2
Observed 263 191 26 7 7 4 3
hσi95
obs[fb] 16 15 5.2 2.7 1.7 1.7 1.6
S95
obs 44 48 17 8.7 5.4 5.4 5.0
S95exp 54+−2114 48+
16
−10 14.0+ 5.4
−3.9 6.3+ 2.9
−1.7 8.7+ 4.2
−1.9 6.6+ 3.2
−1.5 5.7+ 2.8 −1.5
p0(Z) 0.50 (0.00) 0.50 (0.00) 0.40 (0.26) 0.17 (0.94) 0.50 (0.00) 0.50 (0.00) 0.50 (0.00)
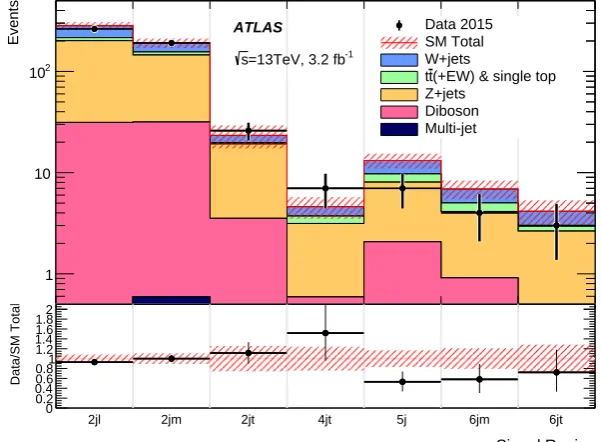
Signal Region
2jl 2jm 2jt 4jt 5j 6jm 6jt
Events
1 10 2 10
Data 2015 SM Total W+jets
(+EW) & single top t
t Z+jets Diboson Multi-jet ATLAS
-1 =13TeV, 3.2 fb s
Signal Region
2jl 2jm 2jt 4jt 5j 6jm 6jt
Data/SM Total
[image:16.595.149.450.467.688.2]0 0.2 0.4 0.6 0.81 1.2 1.4 1.6 1.82
Figure 4: Comparison of the observed and expected event yields as a function of signal region. The background
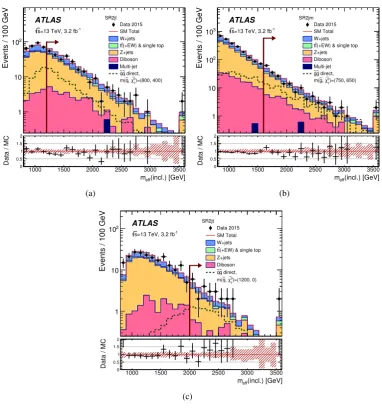
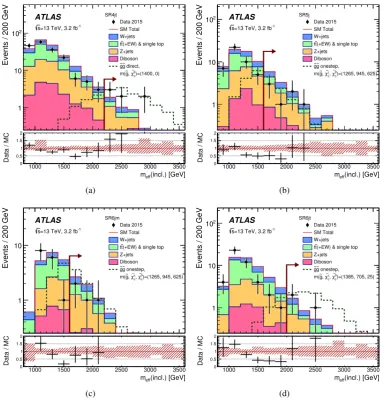
Distributions ofmeff(incl.) obtained before the final selections on this quantity (but after applying all other
selections), for data and the different MC samples normalized with the theoretical cross-sections, i.e. be-fore applying the normalization from the CR fit, are shown in Figures5–6. Examples of typical expected SUSY signals are shown for illustration. These signals correspond to the processes to which each SR is primarily sensitive – ˜qq˜ production for the lower jet-multiplicity SRs and ˜gg˜ production for the higher jet-multiplicity SRs. In these figures, data and background distributions largely agree within uncertain-ties. The differences seen in the lower regions ofmeff(incl.) distribution (1.2 – 2.0 TeV) in Figure6do not
(incl.) [GeV] eff
m
1000 1500 2000 2500 3000 3500
Events / 100 GeV
1 10 2 10 ATLAS -1
=13 TeV, 3.2 fb s
SR2jl Data 2015 SM Total W+jets
(+EW) & single top t t Z+jets Diboson Multi-jet direct, q ~ q ~ )=(800, 400) 0 1 χ ∼ , q ~ m( (incl.) [GeV] eff m
1000 1500 2000 2500 3000 3500
Data / MC 0
0.5 1 1.5 2 (a) (incl.) [GeV] eff m
1000 1500 2000 2500 3000 3500
Events / 100 GeV
1 10 2 10 3 10 ATLAS -1 =13 TeV, 3.2 fb s
SR2jm Data 2015 SM Total W+jets
(+EW) & single top t t Z+jets Diboson Multi-jet direct, g ~ g ~ )=(750, 650) 0 1 χ ∼ , g ~ m( (incl.) [GeV] eff m
1000 1500 2000 2500 3000 3500
Data / MC 0 0.5 1 1.5 2 (b) (incl.) [GeV] eff m
1000 1500 2000 2500 3000 3500
Events / 100 GeV
1 10 2 10 ATLAS -1
=13 TeV, 3.2 fb s
SR2jt Data 2015 SM Total W+jets
(+EW) & single top t t Z+jets Diboson direct, q ~ q ~ )=(1200, 0) 0 1 χ ∼ , q ~ m( (incl.) [GeV] eff m
1000 1500 2000 2500 3000 3500
Data / MC 0.50 1 1.5 2
[image:18.595.115.498.97.507.2](c)
Figure 5: Observedmeff(incl.) distributions for the (a) 2jl, (b) 2jm, (c) 2jt signal regions. The histograms denote
the MC background expectations prior to the fits described in the text, normalized to cross-section times integrated luminosity. The last bin includes the overflow. In the lower panels the hatched (red) error bands denote the com-bined experimental, MC statistical and theoretical modelling uncertainties. The arrows indicate the values at which
the requirements on meff(incl.) are applied. Expected distributions for benchmark model points, normalized to
(incl.) [GeV] eff
m
1000 1500 2000 2500 3000 3500
Events / 200 GeV
1 10 2 10 ATLAS -1 =13 TeV, 3.2 fb s
SR4jt Data 2015 SM Total W+jets
(+EW) & single top t t Z+jets Diboson direct, g ~ g ~ )=(1400, 0) 0 1 χ∼ , g ~ m( (incl.) [GeV] eff m
1000 1500 2000 2500 3000 3500
Data / MC 0 0.5 1 1.5 2 (a) (incl.) [GeV] eff m
1000 1500 2000 2500 3000 3500
Events / 200 GeV
1 10
2
10 ATLAS
-1
=13 TeV, 3.2 fb s
SR5j Data 2015 SM Total W+jets
(+EW) & single top t t Z+jets Diboson onestep, g ~ g ~
)=(1265, 945, 625) 0 1 χ∼ , ± 1 χ∼ , g ~ m( (incl.) [GeV] eff m
1000 1500 2000 2500 3000 3500
Data / MC 0 0.5 1 1.5 2 (b) (incl.) [GeV] eff m
1000 1500 2000 2500 3000 3500
Events / 200 GeV
1 10
ATLAS
-1
=13 TeV, 3.2 fb s
SR6jm Data 2015 SM Total W+jets
(+EW) & single top t t Z+jets Diboson onestep, g ~ g ~
)=(1265, 945, 625) 0 1 χ∼ , ± 1 χ∼ , g ~ m( (incl.) [GeV] eff m
1000 1500 2000 2500 3000 3500
Data / MC 0.50 1 1.5 2 (c) (incl.) [GeV] eff m
1000 1500 2000 2500 3000 3500
Events / 200 GeV
1 10
2
10 ATLAS
-1
=13 TeV, 3.2 fb s
SR6jt Data 2015 SM Total W+jets
(+EW) & single top t t Z+jets Diboson onestep, g ~ g ~
)=(1385, 705, 25) 0 1 χ∼ , ± 1 χ∼ , g ~ m( (incl.) [GeV] eff m
1000 1500 2000 2500 3000 3500
Data / MC 0.50
1 1.5 2
[image:19.595.115.500.100.507.2](d)
Figure 6: Observedmeff(incl.) distributions for the (a) 4jt, (b) 5j, (c) 6jm and (d) 6jt signal regions. The histograms
denote the MC background expectations prior to the fits described in the text, normalized to cross-section times integrated luminosity. The last bin includes the overflow. In the lower panels the hatched (red) error bands denote the combined experimental, MC statistical and theoretical modelling uncertainties. The arrows indicate the values at
which the requirements onmeff(incl.) are applied. Expected distributions for benchmark model points, normalized
to NLO+NLL cross-section (Section 3) times integrated luminosity, are also shown for comparison (masses in
GeV).
In the absence of a statistically significant excess, limits are set on contributions to the SRs from BSM physics. Upper limits at 95% CL on the number of BSM signal events in each SR and the correspond-ing visible BSM cross-section are derived from the model-independent fits described in Section5using theCLs prescription. Limits are evaluated using MC pseudo-experiments. The results are presented in
Table5.
‘Observed limits’ are calculated from the observed SR event yields for the nominal signal cross-section. ‘Expected limits’ are calculated by setting the nominal event yield in each SR to the corresponding mean expected background.
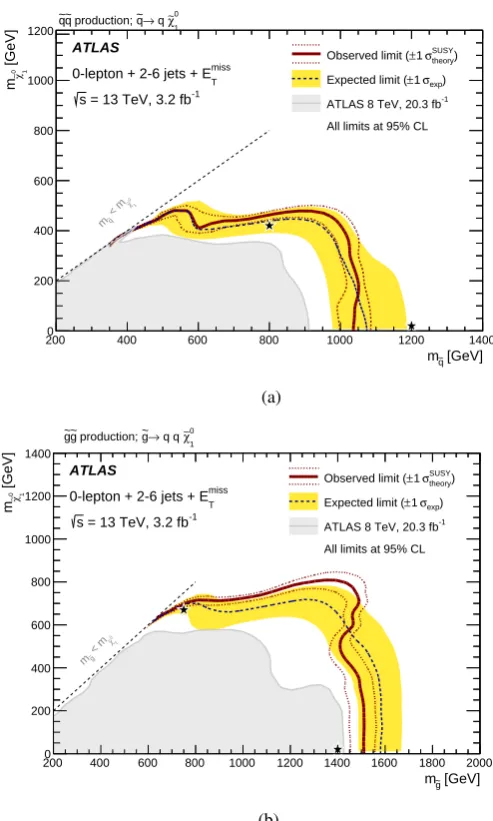
In Figure7, limits are shown for two classes of simplified models in which only direct production of light-flavour squark or gluino pairs are considered. In these simplified model scenarios, the upper limit of the excluded light-flavour squark mass region is 1.03 TeV assuming massless ˜χ01, as obtained from the
signal region 2jt. The corresponding limit on the gluino mass is 1.51 TeV if the ˜χ01is massless, as obtained
[GeV]
q ~
m
200 400 600 800 1000 1200 1400
[GeV] 0 1 χ∼ m 0 200 400 600 800 1000 1200 1 0 χ ∼ < m q ~ m -1
= 13 TeV, 3.2 fb s
miss T
ATLAS
0-lepton + 2-6 jets + E
All limits at 95% CL ) SUSY theory σ 1 ±
Observed limit (
)
exp
σ
1
±
Expected limit (
-1
ATLAS 8 TeV, 20.3 fb
0 1
production; ~q→ q χ∼
q ~ ~q (a) [GeV] g ~ m
200 400 600 800 1000 1200 1400 1600 1800 2000
[GeV]
0χ∼1
m 0 200 400 600 800 1000 1200 1400 1 0 χ ∼ < m g ~ m 0 1 χ∼ q q → g ~ production; g ~ g ~ ATLAS -1
= 13 TeV, 3.2 fb s
miss T
0-lepton + 2-6 jets + E
All limits at 95% CL ) SUSY theory σ 1 ±
Observed limit (
)
exp σ
1
±
Expected limit (
-1
ATLAS 8 TeV, 20.3 fb
[image:21.595.167.414.95.506.2](b)
Figure 7: Exclusion limits for direct production of (a) light-flavour squark pairs with decoupled gluinos and (b) gluino pairs with decoupled squarks. Gluinos (light-flavour squarks) are required to decay to two quarks (one quark) and a neutralino LSP. Exclusion limits are obtained by using the signal region with the best expected sensitivity at each point. The blue dashed lines show the expected limits at 95% CL, with the light (yellow) bands indicating the
1σexcursions due to experimental and background-only theoretical uncertainties. Observed limits are indicated
by medium dark (maroon) curves where the solid contour represents the nominal limit, and the dotted lines are obtained by varying the signal cross-section by the renormalization and factorization scale and PDF uncertainties. Results are compared with the observed limits obtained by the previous ATLAS search [15]. The black stars indicate
the benchmark models used in Figures5and6.
In Figure 8, limits are shown for pair-produced gluinos each decaying via an intermediate ˜χ±1 to two
quarks, a W boson and a ˜χ01. Results are presented for simplified models in which the mass of the
chargino ˜χ±1 is fixed tom( ˜χ ±
1) = (m( ˜g)+m( ˜χ 0
1))/2. For a ˜χ 0
1mass of∼ 200 GeV, the lower limit on the
parameter space where the mass difference between the gluino and the lightest neutralino is small, the best sensitivity is obtained from the signal region 2jm. Results are compared with the observed limits obtained from the statistical combination of the search with no lepton and the search with one isolated lepton, high-pT jets and missing transverse momentum performed at ATLAS [15] using the 8 TeV data.
Statistical combinations of these two searches, designed to be statistically independent in their signal and control region definitions, are performed in order to increase the exclusion reach in models in which at least two analyses obtain comparable sensitivities, and still provide the strongest exclusion limits in the region of parameter space in which the mass of gluino is between 700 and 1100 GeV and the ˜χ01mass is
above∼500 GeV.
[GeV]
g ~
m
400 600 800 1000 1200 1400 1600 1800 2000
[GeV]
0χ∼1
m 200 400 600 800 1000 1200 1400 1 0 χ ∼ < m g ~ m ATLAS -1
= 13 TeV, 3.2 fb s
miss T
0-lepton + 2-6 jets + E
All limits at 95% CL ) SUSY theory σ 1 ±
Observed limit (
)
exp
σ
1
±
Expected limit (
-1
ATLAS 8 TeV, 20.3 fb ))/2
0
∼χ
±
)=(m(g~)+m(
∼χ
, m(
0 1
∼χ → qqW ~
g production; ~g ~
[image:22.595.167.411.232.411.2]g 1 1
Figure 8: Exclusion limits for pair-produced gluinos each decaying via an intermediate ˜χ±1to two quarks, aWboson
and a ˜χ01for models with a fixedm( ˜χ
±
1)=(m( ˜g)+m( ˜χ 0
1))/2 and varying values ofm( ˜g) andm( ˜χ 0
1). Exclusion limits
are obtained by using the signal region with the best expected sensitivity at each point. The blue dashed lines show
the expected limits at 95% CL, with the light (yellow) bands indicating the 1σexcursions due to experimental and
background-only theoretical uncertainties. Observed limits are indicated by medium dark (maroon) curves where the solid contour represents the nominal limit, and the dotted lines are obtained by varying the signal cross-section by the renormalization and factorization scale and PDF uncertainties. Results are compared with the observed limits obtained from the statistical combination of the search with no lepton and the search with one isolated lepton,
high-pTjets and missing transverse momentum performed at ATLAS [15]. The black stars indicate the benchmark
models used in Figure6.
10 Conclusion
This paper reports a search for squarks and gluinos in final states containing high-pT jets, large
miss-ing transverse momentum but no electrons or muons, based on a 3.2 fb−1 dataset of √s = 13 TeV proton–proton collisions recorded by the ATLAS experiment at the LHC in 2015. Good agreement is seen between the numbers of events observed in the data and the numbers of events expected from SM processes.
For a massless lightest neutralino, gluino masses below 1.51 TeV are excluded at the 95% confidence level in a simplified model with only gluinos and the lightest neutralino. For a simplified model involving the strong production of squarks of the first and second generations, with decays to a massless lightest neutralino, squark masses below 1.03 TeV are excluded, assuming mass-degenerate squarks. In simplified models with pair-produced gluinos, each decaying via an intermediate ˜χ±1 to two quarks, aWboson and
a ˜χ01, gluino masses below 1.5 TeV are excluded for ˜χ 0
1masses of∼200 GeV. These results substantially
extend the region of supersymmetric parameter space excluded by previous LHC searches.
Acknowledgements
We thank CERN for the very successful operation of the LHC, as well as the support staff from our institutions without whom ATLAS could not be operated efficiently.
We acknowledge the support of ANPCyT, Argentina; YerPhI, Armenia; ARC, Australia; BMWFW and FWF, Austria; ANAS, Azerbaijan; SSTC, Belarus; CNPq and FAPESP, Brazil; NSERC, NRC and CFI, Canada; CERN; CONICYT, Chile; CAS, MOST and NSFC, China; COLCIENCIAS, Colombia; MSMT CR, MPO CR and VSC CR, Czech Republic; DNRF and DNSRC, Denmark; IN2P3-CNRS, CEA-DSM/IRFU, France; GNSF, Georgia; BMBF, HGF, and MPG, Germany; GSRT, Greece; RGC, Hong Kong SAR, China; ISF, I-CORE and Benoziyo Center, Israel; INFN, Italy; MEXT and JSPS, Japan; CNRST, Morocco; FOM and NWO, Netherlands; RCN, Norway; MNiSW and NCN, Poland; FCT, Por-tugal; MNE/IFA, Romania; MES of Russia and NRC KI, Russian Federation; JINR; MESTD, Serbia; MSSR, Slovakia; ARRS and MIZŠ, Slovenia; DST/NRF, South Africa; MINECO, Spain; SRC and Wallenberg Foundation, Sweden; SERI, SNSF and Cantons of Bern and Geneva, Switzerland; MOST, Taiwan; TAEK, Turkey; STFC, United Kingdom; DOE and NSF, United States of America. In addition, individual groups and members have received support from BCKDF, the Canada Council, CANARIE, CRC, Compute Canada, FQRNT, and the Ontario Innovation Trust, Canada; EPLANET, ERC, FP7, Ho-rizon 2020 and Marie Skłodowska-Curie Actions, European Union; Investissements d’Avenir Labex and Idex, ANR, Région Auvergne and Fondation Partager le Savoir, France; DFG and AvH Foundation, Ger-many; Herakleitos, Thales and Aristeia programmes co-financed by EU-ESF and the Greek NSRF; BSF, GIF and Minerva, Israel; BRF, Norway; Generalitat de Catalunya, Generalitat Valenciana, Spain; the Royal Society and Leverhulme Trust, United Kingdom.
References
[1] Y. A. Golfand and E. P. Likhtman, Extension of the Algebra of Poincare Group Generators and Violation of p Invariance, JETP Lett.13(1971) 323, [Pisma Zh.Eksp.Teor.Fiz.13:452-455,1971].
[2] D. V. Volkov and V. P. Akulov,Is the Neutrino a Goldstone Particle?,Phys. Lett. B46(1973) 109.
[3] J. Wess and B. Zumino,Supergauge Transformations in Four-Dimensions,Nucl. Phys. B70(1974) 39.
[4] J. Wess and B. Zumino,Supergauge Invariant Extension of Quantum Electrodynamics,Nucl. Phys.
B78(1974) 1.
[5] S. Ferrara and B. Zumino,Supergauge Invariant Yang-Mills Theories,Nucl. Phys. B79(1974) 413.
[6] A. Salam and J. A. Strathdee,Supersymmetry and Nonabelian Gauges,Phys. Lett. B51(1974) 353–
355.
[7] G. R. Farrar and P. Fayet,Phenomenology of the Production, Decay, and Detection of New Had-ronic States Associated with Supersymmetry,Phys. Lett. B76(1978) 575.
[8] L. Evans and P. Bryant,LHC Machine,JINST3(2008) S08001.
[9] P. Fayet, Supersymmetry and Weak, Electromagnetic and Strong Interactions, Phys. Lett. B 64
(1976) 159.
[10] P. Fayet, Spontaneously Broken Supersymmetric Theories of Weak, Electromagnetic and Strong Interactions,Phys. Lett. B69(1977) 489.
[11] ATLAS Collaboration, Search for squarks and gluinos using final states with jets and missing transverse momentum with the ATLAS detector in √s=7 TeV proton-proton collisions,Phys. Lett.
B701(2011) 186–203, arXiv:1102.5290 [hep-ex].
[12] ATLAS Collaboration, Search for squarks and gluinos using final states with jets and missing transverse momentum with the ATLAS detector in √s=7 TeV proton-proton collisions,Phys. Lett.
B710(2012) 67–85, arXiv:1109.6572 [hep-ex].
[13] ATLAS Collaboration,Search for squarks and gluinos with the ATLAS detector in final states with jets and missing transverse momentum using 4.7 fb−1of √s=7TeV proton-proton collision data,
Phys. Rev. D87(2013) 012008, arXiv:1208.0949 [hep-ex].
[14] ATLAS Collaboration,Search for squarks and gluinos with the ATLAS detector in final states with jets and missing transverse momentum using √s= 8TeV proton–proton collision data,JHEP09
(2014) 176, arXiv:1405.7875 [hep-ex].
[15] ATLAS Collaboration, Summary of the searches for squarks and gluinos using √s = 8 TeV pp collisions with the ATLAS experiment at the LHC,JHEP 10 (2015) 054, arXiv:1507 . 05525 [hep-ex].
[16] CMS Collaboration,Search for supersymmetry in hadronic final states using MT2 in pp collisions
at √s=7TeV,JHEP10(2012) 018, arXiv:1207.1798 [hep-ex].
[17] CMS Collaboration,Search for new physics in the multijet and missing transverse momentum final state in proton-proton collisions at √s=7TeV,Phys. Rev. Lett.109(2012) 171803, arXiv:1207. 1898 [hep-ex].
[18] CMS Collaboration, Search for supersymmetry in hadronic final states with missing transverse energy using the variablesαTand b-quark multiplicity in pp collisions at 8 TeV,Eur. Phys. J. C73
[19] CMS Collaboration,Inclusive search for supersymmetry using the razor variables in pp collisions
at √s=7TeV,Phys. Rev. Lett.111(2013) 081802, arXiv:1212.6961 [hep-ex].
[20] CMS Collaboration,Search for new physics in the multijet and missing transverse momentum final state in proton-proton collisions at √s=8 TeV,JHEP06(2014) 055, arXiv:1402.4770 [hep-ex]. [21] CMS Collaboration,Searches for Supersymmetry using the MT2Variable in Hadronic Events
Pro-duced in pp Collisions at 8 TeV,JHEP05(2015) 078, arXiv:1502.04358 [hep-ex].
[22] ATLAS Collaboration, Search for squarks and gluinos in events with isolated leptons, jets and missing transverse momentum at √s = 8 TeV with the ATLAS detector, JHEP 04 (2015) 116, arXiv:1501.03555 [hep-ex].
[23] J. Alwall et al., Searching for Directly Decaying Gluinos at the Tevatron, Phys. Lett. B 666
(2008) 34–37, arXiv:0803.0019 [hep-ph].
[24] J. Alwall, P. Schuster and N. Toro,Simplified Models for a First Characterization of New Physics at the LHC,Phys. Rev. D79(2009) 075020, arXiv:0810.3921 [hep-ph].
[25] D. Alves et al.,Simplified Models for LHC New Physics Searches,J. Phys. G: Nucl. Part. Phys.39
(2012) 105005, arXiv:1105.2838 [hep-ph].
[26] ATLAS Collaboration, The ATLAS Experiment at the CERN Large Hadron Collider, JINST 3
(2008) S08003.
[27] ATLAS Collaboration,ATLAS Insertable B-Layer Technical Design Report, ATLAS-TDR-19 (2010),
url:http://cdsweb.cern.ch/record/1291633.
[28] ATLAS Collaboration, Performance of the ATLAS Trigger System in 2010, Eur. Phys. J. C 72
(2012) 1849, arXiv:1110.1530 [hep-ex].
[29] ATLAS Collaboration, Improved luminosity determination in pp collisions at √s =7 TeV using the ATLAS detector at the LHC,Eur. Phys. J. C73(2013) 2518, arXiv:1302.4393 [hep-ex]. [30] J. Alwall, R. Frederix, S. Frixione, V. Hirschi, F. Maltoni, O. Mattelaer, H. -S. Shao, T. Stelzer, P.
Torrielli, M. Zaro,The automated computation of tree-level and next-to-leading order differential cross sections, and their matching to parton shower simulations,JHEP07(2014) 079, arXiv:1405. 0301 [hep-ph].
[31] T. Sjöstrand et al.,An Introduction to PYTHIA 8.2,Comput. Phys. Commun.191(2015) 159–177, arXiv:1410.3012 [hep-ph].
[32] L. Lönnblad and S. Prestel,Matching Tree-Level Matrix Elements with Interleaved Showers,JHEP
03(2012) 019, arXiv:1109.4829 [hep-ph].
[33] ATLAS Collaboration, Summary of ATLAS Pythia 8 tunes, ATL-PHYS-PUB-2012-003 (2012),
url:http://cdsweb.cern.ch/record/1474107.
[34] R. D. Ball et al.,Parton distributions with LHC data,Nucl. Phys. B867(2013) 244–289, arXiv:1207. 1303 [hep-ph].
[35] D. J. Lange,The EvtGen particle decay simulation package,Nucl. Instrum. Meth. A462(2001) 152.
[36] T. Gleisberg et al.,Event generation with SHERPA 1.1,JHEP02 (2009) 007, arXiv:0811.4622 [hep-ph].
[38] A. Kulesza and L. Motyka,Threshold resummation for squark-antisquark and gluino-pair produc-tion at the LHC,Phys. Rev. Lett.102(2009) 111802, arXiv:0807.2405 [hep-ph].
[39] A. Kulesza and L. Motyka,Soft gluon resummation for the production of gluino-gluino and squark-antisquark pairs at the LHC,Phys. Rev. D80(2009) 095004, arXiv:0905.4749 [hep-ph]. [40] W. Beenakker et al., Soft-gluon resummation for squark and gluino hadroproduction, JHEP 12
(2009) 041, arXiv:0909.4418 [hep-ph].
[41] W. Beenakker et al., Squark and gluino hadroproduction,Int. J. Mod. Phys. A 26 (2011) 2637– 2664, arXiv:1105.1110 [hep-ph].
[42] M. Krämer et al.,Supersymmetry production cross sections in pp collisions at √s=7 TeV, arXiv:1206. 2892 [hep-ph].
[43] ATLAS Collaboration,Monte Carlo Generators for the Production of a W or Z/γ∗Boson in Asso-ciation with Jets at ATLAS in Run 2, (2016),url:http://cds.cern.ch/record/2120133.
[44] T. Gleisberg and S. Höche,Comix, a new matrix element generator,JHEP12(2008) 039, arXiv:0808. 3674 [hep-ph].
[45] F. Cascioli, P. Maierhofer and S. Pozzorini, Scattering Amplitudes with Open Loops,Phys. Rev.
Lett.108(2012) 111601, arXiv:1111.5206 [hep-ph].
[46] S. Schumann and F. Krauss,A Parton shower algorithm based on Catani-Seymour dipole factor-isation,JHEP03(2008) 038, arXiv:0709.1027 [hep-ph].
[47] S. Höche et al., QCD matrix elements+ parton showers: The NLO case, JHEP 04 (2013) 027, arXiv:1207.5030 [hep-ph].
[48] S. Höche, F. Krauss, S. Schumann and F. Siegert,QCD matrix elements and truncated showers,
JHEP05(2009) 053, arXiv:0903.1219 [hep-ph].
[49] H.-L. Lai et al., New parton distributions for collider physics,Phys. Rev. D 82 (2010) 074024, arXiv:1007.2241 [hep-ph].
[50] F. P. R. Gavin Y. Li and S. Quackenbush, FEWZ 2.0: A code for hadronic Z production at next-to-next-to-leading order, Comput. Phys. Commun. 182 (2011) 2388–2403, arXiv:1011 . 3540 [hep-ph].
[51] ATLAS Collaboration, Simulation of top quark production for the ATLAS experiment at √s =
13 TeV, (2016),url:http://cds.cern.ch/record/2120417.
[52] S. Alioli et al.,A general framework for implementing NLO calculations in shower Monte Carlo programs: the POWHEG BOX,JHEP06(2010) 043, arXiv:1002.2581 [hep-ph].
[53] P. Artoisenet et al.,Automatic spin-entangled decays of heavy resonances in Monte Carlo simula-tions,JHEP03(2013) 015, arXiv:1212.3460 [hep-ph].
[54] T. Sjöstrand, S. Mrenna and P. Skands,PYTHIA 6.4 Physics and Manual, JHEP05 (2006) 026, arXiv:hep-ph/0603175.
[55] J. Pumplin et al., New generation of parton distributions with uncertainties from global QCD analysis,JHEP07(2002) 012, arXiv:hep-ph/0201195 [hep-ph].
[56] P. Z. Skands,Tuning Monte Carlo Generators: The Perugia Tunes,Phys. Rev. D82(2010) 074018, arXiv:1005.3457 [hep-ph].
[58] M. Czakon and A. Mitov,Top++: A Program for the Calculation of the Top-Pair Cross-Section at Hadron Colliders,Comput. Phys. Commun.185(2014) 2930, arXiv:1112.5675 [hep-ph]. [59] M. Aliev et al.,HATHOR: HAdronic Top and Heavy quarks crOss section calculatoR, Comput.
Phys. Commun.182(2011) 1034–1046, arXiv:1007.1327 [hep-ph].
[60] P. Kant et al.,HatHor for single top-quark production: Updated predictions and uncertainty estim-ates for single top-quark production in hadronic collisions,Comput. Phys. Commun.191(2015) 74– 89, arXiv:1406.4403 [hep-ph].
[61] N. Kidonakis, Two-loop soft anomalous dimensions for single top quark associated production with a W- or H-,Phys. Rev. D82(2010) 054018, arXiv:1005.4451 [hep-ph].
[62] N. Kidonakis, Next-to-next-to-leading-order collinear and soft gluon corrections for t-channel single top quark production,Phys. Rev. D83(2011) 091503, arXiv:1103.2792 [hep-ph]. [63] ATLAS Collaboration,Modelling of the ttH and t¯ tV¯ (V =W,Z)processes for √s=13TeV ATLAS
analyses, (2016),url:http://cds.cern.ch/record/2120826.
[64] K. M. A. Lazopoulos T. McElmurry and F. Petriello,Next-to-leading order QCD corrections to ttZ¯
production at the LHC,Phys. Lett. B666(2008) 62–65, arXiv:0804.2220 [hep-ph].
[65] J. M. Campbell and R. K. Ellis,ttW¯ ±production and decay at NLO,JHEP07(2012) 052, arXiv:1204. 5678 [hep-ph].
[66] ATLAS Collaboration, Multi-Boson Simulation for 13 TeV ATLAS Analyses, (2016),url:http:
//cds.cern.ch/record/2119986.
[67] ATLAS Collaboration,The ATLAS Simulation Infrastructure,Eur. Phys. J. C70(2010) 823, arXiv:1005. 4568 [physics.ins-det].
[68] S. Agostinelli et al.,GEANT4: A simulation toolkit,Nucl. Instrum. Meth. A506(2003) 250–303.
[69] ATLAS Collaboration, The simulation principle and performance of the ATLAS fast calorimeter simulation FastCaloSim, ATL-PHYS-PUB-2010-013 (2010), url: http : / / cds . cern . ch /
record/1300517.
[70] A. D. Martin, W. J. Stirling, R. S. Thorne, G. Watt,Parton distributions for the LHC,Eur. Phys. J.
C63(2009) 189–285, arXiv:0901.0002 [hep-ph].
[71] M. Cacciari, G. P. Salam and G. Soyez,The anti-ktjet clustering algorithm,JHEP04(2008) 063,
arXiv:0802.1189 [hep-ph].
[72] M. Cacciari and G. P. Salam, Dispelling the N3 myth for the kt jet-finder, Phys. Lett. B 641
(2006) 57–61, arXiv:hep-ph/0512210.
[73] W. Lampl et al.,Calorimeter Clustering Algorithms: Description and Performance, (2008),url:
http://cdsweb.cern.ch/record/1099735.
[74] M. Cacciari and G. P. Salam,Pileup subtraction using jet areas,Phys. Lett. B659(2008) 119–126, arXiv:0707.1378 [hep-ph].
[75] ATLAS Collaboration,Performance of pile-up mitigation techniques for jets in pp collisions at
√
s=8TeV using the ATLAS detector, (2015), arXiv:1510.03823 [hep-ex].
[76] ATLAS Collaboration,Jet Calibration and Systematic Uncertainties for Jets Reconstructed in the ATLAS Detector at √s = 13 TeV, ATL-PHYS-PUB-2015-015 (2015), url: http : / / cdsweb .