Optical Coherence Tomography System
and its Applications
Chen Li
Department of Electrical Engineering and Electronics
University of Liverpool
Thesis submitted in accordance with the requirements of the University of
Liverpool for the degree of
Doctor of Philosophy
The author hereby declares that this thesis is a record of work carried out in the Department of Electrical Engineering and Electronics at the University of Liverpool during the period from October 2010 to December 2015. The system developments, measurements, result analysis are my own research outcomes. I hereby declare that except where specific reference is made to the work of others, the contents of this dissertation are original and have not been submitted in whole or in part for consideration for any other degree or qualification in this, or any other university. This dissertation is my own work and contains nothing which is the outcome of work done in collaboration with others, except as specified in the text.
The thesis would not have been possible without the help of many people in so many ways. First and foremost, I would like to express my sincere gratitude and gratefulness to my supervisor, Dr. Yaochun Shen, who has always been available to advise me, provided me with various aspects of research suggestions, offered continuous guidance and support on this work, and introduced me to a great industrial experience.
I also would like to thank Dr. Harm van Zalinge, who has helped me so much during the thesis revision, suggested valuable writing tips, clarified my understanding of doing an academic research and boosted my confidence in completing the revision.
Special thanks go to Dr. Philip Taddy and Dr. Robert May from Teraview Ltd., for your generous supports throughout the industrial placement.
I would like to offer my special thanks and appreciation to my parents and parents-in-law, who always have faiths in me and supported me all the time.
Optical coherence tomography (OCT) is a versatile and powerful imaging technique widely used in biomedical applications. It employs destructive radiation and performs non-contact micrometre-scale cross-sectional imaging of the sample structure. However, classic OCT systems generally apply a single-point detection scheme, which creates inefficiencies in terms of the experimental alignment of system, the point-by-point signal acquisition process and the measurement speed. One of its variants, full-field optical coherence tomography (FF-OCT) employs parallel illumination and directly acquiresen-faceimages with a com-plementary camera, hence omitting the need of electromechanical lateral scans as in classic OCT systems. Current FF-OCT systems could offer more efficient measurement procedures as well as superior imaging performance, however, they are neither economically viable nor universally applicable to different applications. There is a need for a simplified low cost system to make such a powerful technology readily available for a wide range of applications.
In this thesis, the development of a low cost simple FF-OCT system is described from its system setup, experimental procedures, data analysis, and system performance. The system consists of only essential components including the probing lens and beam-splitter, together with a low-cost infrared LED source and CMOS camera. During the measurement, the system only requires to control the axial movement of the sample arm and the image acquisition by the camera. For the imaging of a sample with a depth of 100 µm, the FF-OCT measurement only takes less than two minutes. The time-efficient measurement with the simple system offers great advantage over the developed phase-shifting FF-OCT system, which requires lengthy measurement and excessive operations, despite the decoupling of signal strength and instantaneous phase with penetration depth. Therefore, compared to state-of-the-art systems, it has the advantage of being low-cost, fast image acquisition speed and simple experimental operations.
74 dB. The characterisation of small-size pharmaceutical pellet coatings, bovine corneal layers and paint films is to demonstrate the potential of the simple FF-OCT system for the tomographic imaging. The layered structures and internal morphology features can be revealed by analysing the measured FF-OCT B-scan images and A-scan signals. First of all, the simple FF-OCT system is capable of performing accurate and quick measurements of pellet coatings, which are validated by the XµCT technique. FF-OCT imaging can provide a spatial characterisation of coating layers, an accurate determination of coating thickness, and an estimation of coating uniformity and porosity, making the simple system a powerful tool for the coating evaluation of similar pharmaceutical pellets. Secondly, the simple system can detect corneal surfaces and the two anterior layers of bovine cornea. This could permit the prediction of the corneal oedematous state and epithelial erosions by the analysis of the FF-OCT results of the corneal structure. Thirdly, the simple system is capable of revealing the surface and subsurface of basecoat and clearcoat films. The measurement of their paint thicknesses is also verified by the reference profilometry results. FF-OCT imaging can provide further spatial evaluation of a paint film and the areal thickness map could be obtained. The study of these paint samples with the simple system might provide an indication for the FF-OCT measurement of industrial automotive paint.
List of figures xv
List of tables xix
Nomenclature xix
1 Introduction 1
1.1 Research Overview . . . 1
1.2 Thesis Motivation and Objectives . . . 2
1.2.1 Development of the FF-OCT System . . . 2
1.2.2 Tomographic Imaging . . . 3
1.2.2.1 Characterisation of Pellet Coatings . . . 3
1.2.2.2 Imaging of the Ultra-fine Corneal Layers . . . 4
1.2.2.3 Inspection of Paints . . . 4
1.2.3 Surface Measurements . . . 5
1.2.4 Thesis Objective . . . 6
1.3 Thesis Outline . . . 7
1.4 Contribution of Research . . . 8
1.5 Auto-bibliography . . . 9
2 Overview of Optical Coherence Tomography 11 2.1 Introduction . . . 11
2.2 Background . . . 12
2.2.1 Imaging . . . 12
2.2.2 Surface Topography . . . 12
2.3 Optical Coherence Tomography . . . 13
2.3.1 Development of OCT . . . 15
2.4 Principle of OCT . . . 19
2.4.1 Basic OCT Configuration . . . 20
2.4.2 Time-Domain OCT . . . 25
2.4.3 Fourier-Domain OCT . . . 32
2.4.4 Practical Aspect of OCT System Design . . . 36
2.4.5 Comparison between Time-Domain OCT and Fourier-Domain OCT 43 2.5 Full-Field OCT . . . 43
2.5.1 System Configuration . . . 44
2.5.2 Operational Schemes . . . 44
2.5.3 Performance Characteristics . . . 46
2.6 Summary . . . 48
3 Development of two FF-OCT System 49 3.1 Introduction . . . 49
3.2 Principle of the FF-OCT Technique . . . 50
3.3 Development of a Simple FF-OCT System . . . 52
3.3.1 System Setup . . . 52
3.3.2 Experimental Procedures . . . 55
3.3.3 Data Analysis for Tomographic Imaging . . . 58
3.3.4 Data Analysis for the Surface Topography . . . 63
3.3.5 System Performance . . . 68
3.3.5.1 Depth-Resolution . . . 68
3.3.5.2 Transverse Resolution . . . 69
3.3.5.3 System Sensitivity . . . 71
3.4 Development of a Phase-Shifting FF-OCT System . . . 73
3.4.1 Experimental Arrangement . . . 74
3.4.2 Experimental Procedures . . . 75
3.4.3 System Characteristics . . . 79
3.5 Discussion . . . 81
3.6 Summary . . . 83
4 Tomographic Imaging Studies using the Simple FF-OCT System 85 4.1 Evaluation of Pharmaceutical Pellet Coating . . . 85
4.1.1 Introduction . . . 85
4.1.2 Overview of Analytical Techniques for Coatings Analysis . . . 87
4.1.2.2 Analytical Techniques . . . 87
4.1.2.3 Characterisation of Pellet Coating . . . 90
4.1.3 Characterisation of Pellet Coating using FF-OCT . . . 92
4.1.3.1 Measurement Procedures . . . 92
4.1.3.2 Single-Layer Coated Pellets . . . 93
4.1.3.3 Double-Layer Coated Pellets . . . 97
4.1.3.4 Triple-Layer Coated Pellets . . . 104
4.1.4 Discussion . . . 107
4.1.5 Summary . . . 109
4.2 Characterisation of Corneal Structure . . . 110
4.2.1 Introduction . . . 110
4.2.2 Ultra-fine Corneal Structure . . . 111
4.2.3 Characterisation of Corneal Disorders by OCT . . . 114
4.2.3.1 Corneal Oedema . . . 114
4.2.3.2 Corneal Erosion . . . 116
4.2.4 Imaging of Corneal Structure by FF-OCT . . . 117
4.2.5 Discussion . . . 119
4.2.6 Summary . . . 121
4.3 Assessment of Paint Quality . . . 122
4.3.1 Introduction . . . 122
4.3.2 Single-Coat Paint Samples . . . 123
4.3.2.1 Automotive Paint . . . 123
4.3.2.2 Single-Coat Paint Panels . . . 124
4.3.3 Results and Discussion . . . 126
4.3.3.1 Determination of Paint Thickness . . . 127
4.3.3.2 Evaluation of Thickness Distribution . . . 131
4.3.4 Discussion . . . 133
4.3.5 Summary . . . 134
4.4 Conclusions . . . 134
5 Surface Topography Studies using the Simple FF-OCT System 137 5.1 Introduction . . . 137
5.2 Determination of Surface Variation . . . 137
5.3 Validation of the FF-OCT System for Surface Topography . . . 138
5.3.1.1 AFM Measurement . . . 139
5.3.1.2 FF-OCT Measurement . . . 140
5.3.2 Performance Evaluation . . . 142
5.4 Determination of Electrode Thickness . . . 143
5.4.1 Bow-tie Photoconductive Antenna . . . 143
5.4.1.1 Bow-tie Antenna . . . 144
5.4.1.2 FF-OCT Measurement . . . 144
5.4.1.3 Nanostructured Surface Characterisation . . . 145
5.4.1.4 Determination of Areal Electrode Thickness . . . 146
5.4.2 Diode Rectifier . . . 147
5.4.2.1 MIIM Rectifier . . . 148
5.4.2.2 FF-OCT Measurement . . . 149
5.4.2.3 Nanostructured Surface Characterisation . . . 150
5.4.2.4 Determination of Electrode Thickness . . . 154
5.5 Analysis of Refractive Power . . . 155
5.5.1 PMMA Models . . . 156
5.5.2 Surface Characterisation by FF-OCT . . . 157
5.5.2.1 FF-OCT Measurement . . . 157
5.5.2.2 PMMA Models for Refractive Correction . . . 157
5.5.2.3 PMMA Models for Optical Homogeneity Testing . . . . 159
5.5.3 Determination of Refractive Powers . . . 159
5.5.3.1 Refractive Power . . . 160
5.5.3.2 Areal Refractive Power . . . 161
5.5.4 Discussion . . . 162
5.6 Summary . . . 162
6 Conclusion 165
References 169
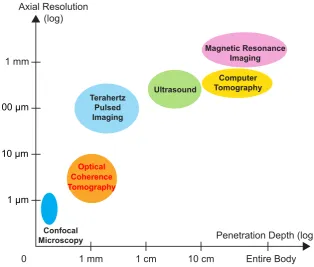
2.1 An overview of the axial resolution and the penetration depth for imag-ing modalities includimag-ing X-ray CT, MRI, ultrasonography, TPI, OCT and
confocal microscopy. . . 15
2.2 Schematic diagram of a Michelson interferometer. . . 21
2.3 Basic configuration and components of an OCT system. . . 22
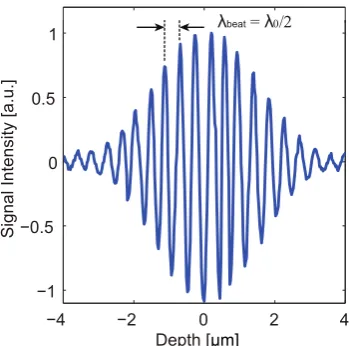
2.4 Schematic diagram of time-domain OCT in free-space optics configuration. 26 2.5 A time-domain OCT interferogram with cycle lengthλbeat equal to half the source central wavelengthλ0. . . 30
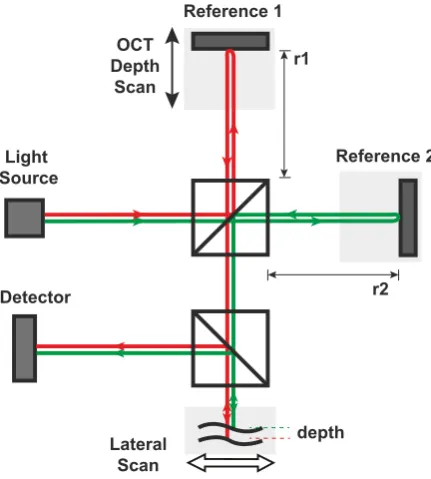
2.6 Time-domain OCT in dual beam scheme. . . 31
2.7 Time-domain OCT inen-facescheme. . . 32
2.8 Schematic diagram of spectral interferometry Fourier-domain OCT . . . 35
2.9 Schematic diagram of wavelength tuning Fourier-domain OCT . . . 36
2.10 Schematic diagram of the parallel or full-field OCT system . . . 45
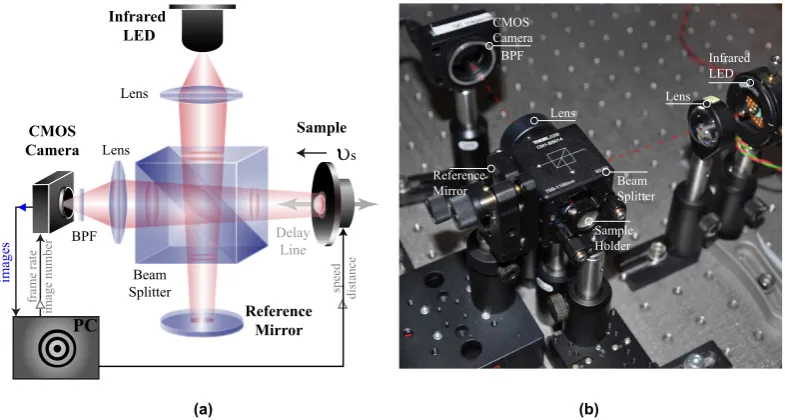
3.1 Schematic diagram and photo of the developed simple FF-OCT system . . . 53
3.2 GUI for the motorised translation stage . . . 56
3.3 Flowchart of the experimental procedures for the simple FF-OCT system . 57 3.4 Data analysis for tomographic imaging . . . 62
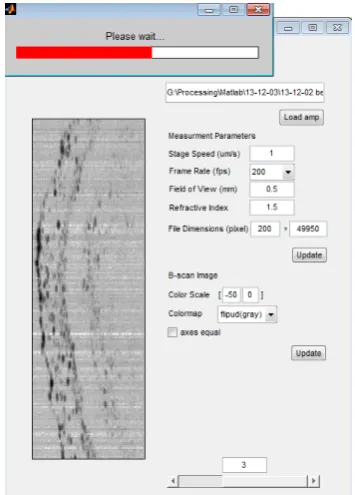
3.5 GUI for browsing B-scan images . . . 64
3.6 Zero-order interferogram . . . 65
3.7 Schematic diagram of position search with interpolation . . . 66
3.8 Phase unwrapping of an example topographic image with wrapped phases . 67 3.9 Flowchart of FF-OCT data analysis with tomographic imaging and surface topography . . . 68
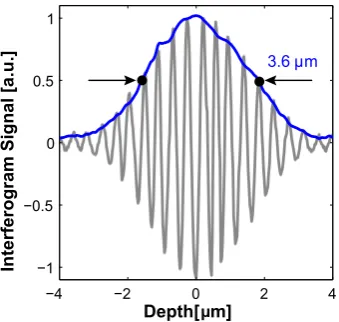
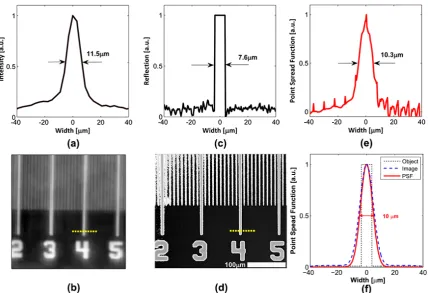
3.10 Determination of the FF-OCT depth-resolution . . . 69
3.11 Determination of transverse resolution via a deconvolution . . . 70
3.13 Determination of the system sensitivity with a mirror sample . . . 73
3.14 Schematic diagram of a phase-shifting FF-OCT system with a phase-shifting module . . . 75
3.15 Illustration of the five-step phase-shifting algorithm for envelope retrieval . 77 3.16 GUI of the control module of the phase-shifting FF-OCT system . . . 78
3.17 Flowchart of the measurement with the phase-shifting FF-OCT system . . . 79
3.18 Sensitivity comparison between the phase-shifting system and the simple system . . . 80
4.1 Photos of investigated pellets and a pellet cross-sectional microscopy image 93 4.2 B-scan images (left) and A-scan signals (right) of single layer coated pellets with varying coating thicknesses . . . 95
4.3 An example B-scan image showing manually marked points for the determi-nation of coating layer thickness . . . 96
4.4 Linear correlations between OCT measured pellet coating thicknesses and estimated weight gain thicknesses for the four batches . . . 96
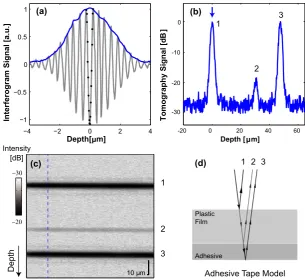
4.5 An FF-OCT interference signal in (a) and the corresponding A-scan signal in decibels in (b) of the double-layer coated pellet. . . 99
4.6 B-scan images of the double-layer coated pellet by FF-OCT in (a) and XµCT in (b). . . 100
4.7 Five randomly selected A-scan signals in (a) and the mean signal averaged over 200 A-scan signals in (b). . . 101
4.8 A pellet model with the ROI illustrated by the central cylinder volume in (a) and a cross-section model of pellet coatings with the deviation of the measured thickness evaluated in (b) . . . 102
4.9 En-faceimages measured by FF-OCT in (a) and XµCT in (b) at progressive depths . . . 103
4.10 B-scan images and A-scan signals of two batches of triple layers coated pellets105 4.11 B-scan images in logarithmic scale obtained by FF-OCT for the four batches (three pellet samples per batch) of triple layer coated pellets, with their dissolution rates stated. . . 106
4.12 Histological section of a healthy human cornea . . . 112
4.13 A UBM image of corneal structure . . . 112
4.15 OCT images of oedematous cornea with various corneal thicknesses and the presence of lakes . . . 115 4.16 OCT and slit-lamp images of dots, corneal epithelial detachment and splitting
of the corneal epithelial layer in eyes with corneal EBMD. . . 116 4.17 The FF-OCT B-scan image in (a) and the A-scan signal in (b) of the first
cornea sample. . . 118 4.18 The FF-OCT B-scan image in (a) and the A-scan signal in (b) of the second
cornea sample. . . 118 4.19 Cross-sectional schematic of layered structure of general car paint in the
automotive industry. . . 124 4.20 Schematic and photos of paint panels . . . 125 4.21 B-scan images of FF-OCT measurements of the electrocoat, Primer A and
Primer B panels and an averaged A-scan signal of Primer A . . . 127 4.22 B-scan image and A-scan signal of the FF-OCT measurement of Basecoat A
(metallic) . . . 128 4.23 B-scan image and A-scan signal of the FF-OCT measurement of Basecoat B
(pearlescent) . . . 129 4.24 B-scan image and A-scan signal of the FF-OCT measurement of Basecoat C
(plain) . . . 129 4.25 B-scan image and A-scan signal of the FF-OCT measurement of the clearcoat
layer . . . 131 4.26 Thickness maps and histograms of Basecoat B, Basecoat C and the clearcoat 132
5.1 (a) Schematic of the cross-sectional view and (b) photo of the dot-patterned semiconductor sample. . . 139 5.2 AFM image of the measured surface and the height profiles along the marked
lines . . . 140 5.3 FF-OCT map and 3-D image of the measured surface and the height profiles
along the marked lines . . . 141 5.4 A schematic of the OPL relationships when the reference arm was interfering
with the Au surface and the silicon pad surface . . . 142 5.5 Cross-sectional schematic and FF-OCTen-faceimage of the bow-tie antenna 144 5.6 FF-OCT map and 3-D image of the bow-tie antenna and the height profiles
5.7 A schematic of two regions for the collection of surface height data from the electrode and substrate. . . 147 5.8 Schematic diagrams and image revealing the sandwich structure of the MIIM
rectifier . . . 148 5.9 FF-OCT surface map of the rectifier and the height profiles along the marked
lines . . . 150 5.10 Schematics of OPL relationships when the reference was interfering with
surfaces or interfaces of air/Al, insulators/Al and insulators/SiO2configurations151 5.11 Light transmission and reflection inside the layered configuration of Case II
and Case III. . . 152 5.12 (a) Two FF-OCT interference signals separated by 201 nm with a defined
in-tensity ratio close to 7.5 : 2.7, and (b) the combination of the two interference signals, with a maximum peak position identified at a height of 41 nm. . . . 154 5.13 3-D representation of the corrected rectifier surface and cross-sectional
schematic of the sandwich structure . . . 155 5.14 Photo of the laser ablated PMMA models A to E (from left to right). Models
A, B and E are ablated surfaces to correct myopia, astigmatism and hyperopia refractive errors, respectively; models C and D are ablated surfaces for the test of optical homogeneity. . . 156 5.15 3-D surface representation of the ablated surfaces of Model A, B and E . . . 158 5.16 3-D surface representation of the ablated surfaces of Model C and D . . . . 159 5.17 Measured central meridian surface height profiles and best fit circle functions
2.1 Example phase-shift algorithms with uniform phase shift . . . 46
4.1 Refractive Indices of the Coating and Core Materials . . . 98 4.2 Comparison of Analytical Techniques . . . 109 4.3 Characterisation of corneal structure with the state-of-the-art OCT instrument
and the simple FF-OCT system . . . 120 4.4 Optical properties, i.e. refractive index nand extinction coefficientk and
paint thicknesses measured by profilometry and estimated based on the weight gain. . . 126 4.5 Thicknesses (mean ± STD) of Basecoat B, Basecoat C and the clearcoat
measured by the profilometry and the simple FF-OCT system . . . 133 4.6 Capabilities desired in the automotive industry and achievable with the simple
FF-OCT system . . . 134
5.1 Summary of the areal height of the gold electrodes and GaAs substrate surface.147 5.2 Refractive index and thickness of the two dielectric films. . . 149 5.3 Description of the parameters used in each refractive surgery ablation
Introduction
The thesis is dedicated to the development of the simple full-field optical coherence tomography (FF-OCT) system and the evaluation of its potential for the characterisation of biomedical, pharmaceutical and other industrial applications. The overview of this research is introduced firstly in this chapter, followed by the motivation and the objectives of this thesis. The thesis outline is also presented to give a clear view of the entire contents.
1.1
Research Overview
Optical coherence tomography (OCT) is a non-contact, non-invasive technique that uses light waves to take high resolution cross-sectional images from within optical scattering media (e.g. biological tissue) [1]. It features micrometre-scale resolution and millimetre-scale penetration depth, which makes it a perfect analytical tool for the diagnosis of retinal diseases and the examination of coronary arteries [2]. As an interferometry technique, OCT detects interference signals whenever there is a variation of the refractive index. As an imaging technique, OCT acquires a stack of images regarding the visible and invisible aspects of a sample, such as internal or covered parts. Cross-sectional images are analysed to study structural performance and to reveal possible internal defects within a sample.
OCT is a practical technique with high imaging resolution and excellent imaging sensitivity. Because of these superiorities, recent years have seen rapid developments and research into OCT-based imaging techniques in ophthalmology, cardiology, dermatology studies [4] and non-biomedical applications, such as art conservation [5], electronics production [6] and the pharmaceutical industry [7], etc.
One of the derivatives of OCT is the FF-OCT technique, which enables parallel (full-field) illumination of the sample with similar imaging quality [8]. It permits easier experimental operations, while achieving quicker three-dimensional (3-D) structural evaluation, compared to the classic OCT system.
This work is concentrated on the development of a low-cost FF-OCT system and the evaluation of its imaging performance for different applications. The FF-OCT system is assembled with inexpensive systematic elements including optical components and controlling devices, while it features a simple configuration, a fast image acquisition speed, simple experimental operations, and ease of use. The potential of the developed FF-OCT system is explored in terms of both tomographic imaging and surface topography for several applications.
The thesis is going to describe the development of the FF-OCT system, and demonstrate the usefulness of the built system in ophthalmological, pharmaceutical and industrial applications.
1.2
Thesis Motivation and Objectives
1.2.1
Development of the FF-OCT System
OCT is technically versatile for many applications, as it performs non-contact, non-invasive measurements, delivers spatially resolved information about internal structures, and provides images with micrometre-scale resolution.
Measurement with the FF-OCT system should be designed to have fast data acquisition and superior imaging performance, while the system itself is expected to be easy to use, low-cost, experimentally convenient and adaptable. A commercial FF-OCT system could be an option, yet, it is neither economically friendly nor universal for unspecified applications. There could also be some limitations with commercial systems, e.g. the maximum allowed field of view, which could induce problems for large or varied shaped samples to be properly positioned.
1.2.2
Tomographic Imaging
1.2.2.1 Characterisation of Pellet Coatings
Pharmaceutical dosage forms typically contain active drug components for the diagnosis, cure, treatment, or prevention of disease during drug therapy [9]. The use of coatings or shells for many modern solid dosage forms (tablets and nonpareil seeds) enables the extension or control of the drug release, as needed in order to safely achieve the desired therapeutic effect. Ideally, designated coatings are dissolved over a period of time in a controlled manner until the active substances reach the target area of the body. As the drug dissolution profile is closely related to the physical properties of coatings, various techniques are used to assess the coating quality in accordance with manufacturer specifications.
Pharmaceutical manufacturers traditionally determine the coating process endpoint by taking samples in-process, weighing a known sample size and determining the theoretical amount of polymer added. NIR spectroscopy is a more rapid method gaining acceptance in industry and has been used to non-destructively evaluate the coating quality [10]. However, both methods lead to a conservative estimation of the coating thickness, on the basis of gained weight and calibration models, respectively. In addition, the mean coating thickness obtained from these empirical measurements is not likely to provide detailed information about the coating characteristics (e.g. coating layer uniformity, porosity). Their abilities to predict the coating quality and imply the drug release profile are thus limited. These issues also apply to the small-size pellets that are described in this thesis; besides this, the pellet samples are additionally difficult to be measured experimentally due to their small size.
1.2.2.2 Imaging of the Ultra-fine Corneal Layers
The cornea is the transparent front part of the eye that contributes to most of the eye’s focusing power. The diagnosis of the human cornea is of great importance as regards corneal condition, symptoms and treatment [11]. Both the central corneal thickness (CCT) and the properties of corneal layers are essential in the analysis of new corneal transplantation techniques, diagnosis of ocular disorders, observation of surgical incisions, etc. In order to evaluate the extent of corneal disorders, such as corneal oedema and erosion, it is necessary to explore the ultra-fine corneal layer structure.
Prior to corneal surgery, such as the laser-assisted in situ keratomileusis (LASIK) surgery, corneal pachymetry is performed to measure CCT for ensuring sufficient thickness to prevent abnormal bulging of the cornea. It is also considered an important test in the early detection of glaucoma. The established ultrasonic pachymeter can measure single-point CCT when the ultrasound transducer touches the cornea. The non-contact ultrasound biomicroscopy (UBM) creates real-time cross-sectional images in a very cost-effective manner. It uses higher frequency transducers hence a finer resolution (e.g. 25 µm), to identify more superficial structures in the qualitative and quantitative assessment of the cornea [12]. However, the imaging operation requires water immersion of the UBM transducer, leading to discomfort for patients [13].
OCT is the most promising imaging technique used in ophthalmology today [14]. Compared to the UBM technique, OCT offers new diagnostic options with higher definition images upon multiple meridians across the cornea surface. The non-invasive and non-contact properties make OCT a better choice in the pre-surgical and post-surgical evaluation of the cornea. OCT techniques have been used as an analytical tool for the study of the layer structure and diagnosis of corneal disorders. However, the imaging of ultra-fine layer boundaries is always challenging when using commercially available OCT systems. Thus, to reveal the fine structure of the cornea, OCT resolution or precision can be improved by developing OCT systems.
Therefore, the developed FF-OCT system is used to measure cornea samples to determine whether it can detect the fine corneal structure. This could illustrate the potential of the system for the tomographic imaging of ophthalmological applications.
1.2.2.3 Inspection of Paints
vehicles [15]. Inspection of paint films is required during the coating process in order to ensure adequate protective coverage and at the same time to control coating costs. In the field of forensic science, the examination of paint chips can also be of evidential value in a variety of vehicle-related crimes [16].
Non-destructive methods including magnetic gauges, the eddy-current principle and ultrasonic gauges are used upon the completion of each layering work, making it possible to monitor the individual layer thicknesses in accordance with project specifications. However, all these methods require physical contact with the paint surface and only the single-point total paint thickness can be measured at any one time. In addition, the first two gauges only apply to paints on metal substrates.
Although these methods can provide a precise finish thickness, they require complicated monitoring procedures in order to meet industry standards, coating quality, and/or customer requirements. There’s a need for an inspecting system to enable non-contact and direct measurement of all paint layer structures. On the other hand, spatial assessment of the paints is also considered beneficial for the control and verification of paint quality.
Therefore, the supplied panels with paint coated on mirror surfaces are measured by the developed FF-OCT system, in order to determine whether FF-OCT radiation can penetrate the paint material. This could indicate the potential of the system for the tomographic imaging of automotive paint applications.
1.2.3
Surface Measurements
Surface profilometry is significant in determining surface physical characteristics [17], including surface shape, roughness, curvature, etc. It can be used to identify artefacts and estimate the fabrication quality of the sample. It is also a useful predictor for the calibration of instrument performance.
vertical scanning interferometry (VSI), of which the systems have a lower cost and an easier data acquisition for 3-D scans.
For the semiconductor microelectronics and the polymethyl-methacrylate (PMMA) models in this thesis, an optical profilometer is expected to be used for 3-D representation due to its non-contact profiling scheme and the relatively large area of the surface region of interest (ROI). Regarding the specific requirements of both applications, it is needed for the profilometer to be able to differentiate nanometre-scale height difference; 3-D surface topography is also required to be produced for the evaluation of surface variation and curvature.
Therefore, their surfaces are measured by the developed FF-OCT system, in order to determine whether the system can obtain their surface topography to evaluate electrode thickness and refractive power. This could suggest the potential of the system for the surface profiling.
1.2.4
Thesis Objective
As stated in the preceding sections, FF-OCT is an imaging modality that offers a few advantages: performing non-contact measurements, utilising non-invasive radiations, spatially evaluating internal structures, producing cross-sectional images with micrometre-scale resolution, and operating fast data acquisition.
This thesis is devoted to the development of a simple FF-OCT system for the tomographic imaging and surface topography of various applications. The developed FF-OCT system is desired to have a low cost, simple configuration, fast image acquisition speed, simple experimental operations and ease of use. The system is also expected to have good imaging and profiling capabilities, in order to be readily available for a wide range of applications.
1.3
Thesis Outline
The written thesis is composed of six chapters.
Chapter 2 begins by introducing the OCT technique and conventional techniques for the 3-D imaging and surface metrology. Then, the OCT technique is further explored as regards OCT development and major findings described in ophthalmology, cardiology, etc. The principle of OCT is explained and discriminated from similar techniques in terms of tomography and interferometry. Three OCT variants including time-domain OCT, Fourier-domain OCT and FF-OCT are described with respect to their system layout, operational scheme, etc.
Chapter 3 systematically presents the development of the simple FF-OCT system. This chapter first introduces the principle of imaging and surface profiling by using the FF-OCT technique. System development is described in terms of the system setup, experimental procedures and data analysis for both imaging and surface profiling. The robustness of the simple system is demonstrated by the performance parameters including micrometre-scale spatial resolution and system sensitivity. The simple system is compared with the phase-shifting FF-OCT system, which is developed for the purpose of enhanced system sensitivity. Experimental efficiency, system performance, adaptability to different applications, etc. of the simple FF-OCT system is evaluated.
Chapter 4 illustrates tomographic imaging studies by using the simple FF-OCT system.
Section 4.1 delivers the evaluation of pharmaceutical coatings of small-size pellets using the simple FF-OCT system, which detects refractive variations to indicate structural changes. It starts by an overview of analytical techniques for assessing pellet coating quality, such as weight gain and NIR spectroscopy. Then, a brief description of each small-size pellet is given first, followed by the described coating characterisation using the simple system. With the reconstructed cross-sectional images, these pellets are discriminated with different coating structures; the thickness of each coating layer can be measured precisely down to micrometre scale, allowing for the presentation of coating structures and an accurate evaluation of coating quality. The X-ray micro-CT technique is used to validate the simple FF-OCT system for the imaging of pellet coatings.
are introduced. Then, measurements of the cornea using state-of-the-art OCT techniques are reviewed. Subsequently, the characterisation of internal layers of a healthy bovine cornea using the simple FF-OCT system is presented with clear layer boundaries and measurable corneal thickness. Based on the obtained corneal structural results, the potential of the simple FF-OCT system for the diagnosis of mentioned corneal disorders is discussed.
Section 4.3 gives a presentation of the characterisation of paint films coated on a mirror surface by using the simple FF-OCT system. It begins by giving brief background information including the function and configuration of automotive paints. Conventional paint quality assessment methods are described and evaluated. The characterisations of these panels with the simple system are reported in detail, with the paint surface and subsurface identified using FF-OCT images and signals. The measured paint thicknesses are compared with that obtained from the reference method, in order to determine whether the simple FF-OCT system is capable of providing accurate spatial evaluation of paint films. After that, there is a discussion regarding the potential of the FF-OCT technique for the assessment of the actual automotive paint during the manufacturing process.
Chapter 5 reports surface topography studies by using the simple FF-OCT system. The analysis of phase change upon reflections in interferometric profilometry is first briefly introduced, and then the FF-OCT technique for surface topography is validated by the AFM method in the measurement of the surface step of a semiconductor sample. Subsequently, the simple FF-OCT system is used in the surface topography of two microelectronics to determine electrode thickness. PMMA models are also measured with the simple system. The FF-OCT measured surface map is used to compute the refractive power for each PMMA model.
Chapter 6 concludes this thesis by giving a summary of the results obtained.
Appendix A provides a list of symbols and abbreviations appearing in each chapter.
1.4
Contribution of Research
• The development of a low-cost FF-OCT system with apparent simplicity, improved practicality, and retained good imaging performance;
• The structural evaluation of pharmaceutical coatings of small-size pellets using the FF-OCT system.
This thesis describes, for the first time, an original work on the coating characterisation of the pharmaceutical pellet using presented methods, including the quantitative evaluation of coating structures with measurable spatial thicknesses using the simple FF-OCT system, the analysis of coating uniformity with identified structural changes, and the qualitative assessment of the coating’s physical characteristics. It also covers the verification of the FF-OCT measurement utilising the X-rays micro-CT (XµCT) method, which produces consistent coating structures of the pellet.
The simple system has also been used for the identification of ultra-fine corneal structures and the non-contact revealing of paint layer structures. The obtained results confirm that the proposed method provides accurate descriptions of sample subsurface formation, from the layer structures and material uniformity. Agreement with literature or results which are based on reference methods have shown that the simple FF-OCT system is powerful with regard to the structural characterisations of both biomedical and industrial applications.
This thesis also proposes that the FF-OCT technique can be used to spatially assess refractive power based on measured actual surface shape. With the interferometric technique, the surface height can be accurately measured with sub-micrometre-scale precision. Consequently, the simple FF-OCT system is competent to resolve nanostructured surface variations of semiconductor microelectronics, providing comparable surface topography with that of the reference method. Hence, the simple FF-OCT system offers great convenience and precision to evaluate surface characteristics, allowing for further investigations such as the refraction analysis of PMMA models and the electrode thickness of microelectronics.
1.5
Auto-bibliography
List of the publications produced from this work:
2. H. Shen, L. Gan, N. Newman, Y. Dong,C. Li, Y. Huang, and Y. C. Shen, "Spinning disk for compressive imaging," Opt. Lett., 37, 1, 46-48, Jan. 2012.
3. C. Li, Y. Dong, Y. C. Shen, "Characterisation of tablet coatings using infrared optical coherence tomography," Poster session presented at Photon 12 conference, 3-6 Sep. 2012, Durham, United Kingdom.
4. H. Shen, V. Abolghasemi, L. Gan,C. Li, Y. C. Shen, "Compressive three-dimensional (3D) terahertz imaging," Poster session presented at Photon 12 conference, 3-6 Sep. 2012, Durham, United Kingdom.
Overview of Optical Coherence
Tomography
2.1
Introduction
2.2
Background
2.2.1
Imaging
Imaging is a technique of creating a visual representation of an object for diagnostic analysis or performance evaluation. In the biomedical context, analysis of specimen’s internal structures is of great importance for the understanding of the form and functioning of living organisms, as well as studying of the formation and development of possible disease. In the industrial context, structural monitoring is a key procedure for the assessment of the manufactured product to specification and the control of the usage of raw materials. Imaging systems employ electromagnetic (EM) waves to penetrate though the sample surface, while either reflecting or transmitting waves are detected as indications of internal structures covered by media and surface. A set of methods is designated as imaging techniques that seek to noninvasively produce images of internal structures, in order to identify abnormalities, such as diseases and defects.
Medical imaging has long been using X-rays (30 PHz to 30 EHz) for the detection of pathology of the skeletal system [20] and processes of lung disease [21], as the bone exhibits much higher X-rays absorptions than tissue types and trapped gas or lungs. X-rays CT enables the production of volumetric data to demonstrate various bodily structures [22]. Ultrasonography is an ultrasound-based (1 MHz to 18 MHz) diagnostic imaging technique that detects sound echoes for the representation of internal body structures [23]. It has been widely used to examine the fetus inside a pregnant woman’s uterus [24]. In case of nuclear medicine, magnetic resonance imaging (MRI) is a complementary imaging technique to X-rays CT in many applications, e.g. cardiovascular [25], liver [26] and gastrointestinal imaging [27]. It is more sensitive for small tumours [28] and offers better contrast of the central nervous system in neuroimaging [29]. Recent years have seen rapid developments of imaging techniques in the infrared frequency range (0.3 THz to 300 THz). These analytical techniques including NIR spectroscopy and imaging (NIRSI), terahertz pulsed imaging (TPI) and OCT allow more precise measurements of specific parts, such as biomedical tissues [30–32]. Besides biomedical applications, they have been utilised for studies spanning a number of disciplines.
2.2.2
Surface Topography
asperity and structural characterisation. The surface topography is essential to determine the suitability of a surface for a particular function, for example, the nanometre scale electrode thickness has great impact on the efficiency of the solar cells [33]. For a precision fabricated component, the low performance or the component failure is often traced back to a surface that was not manufactured to its specification, either due to an improperly set up machine or use of a process that is not capable of repeatedly producing the quality of surface needed.
To enable quantitative examination of the surface, two parallel branches of instrumen-tation were developed: one follows the contact method (tactile measurement) with a stylus and the other makes use of optical light to perform non-contact measurements. The past few decades have seen rapid development for surface measurement techniques. Both contact and non-contact methods are converging to satisfy linear and areal measurement requirements. The contact instruments have progressed from the conventional stylus profilometer to modern AFM systems, which can operate at sub-nanometre scale along the vertical direction. With the invention of STM, non-contact surface imaging at true atomic-level is available under near real-time scanning. Optical profilometers operate much quicker for an areal measurements as they do not contact the surface. Neither do wears occur to the surface nor are there stylus damages by the rough surface, which could potentially lead to a change in resolution [34]. Commercial non-contact instrument based on white light interferometry (e.g. NT9080, Veeco Instruments, Inc.) can effectively measure vertical distance in sub-nanometre level. Other interferometric techniques including CSI, VSI and OCT are also widely used for the surface topography studies. Despite of the lack of calibration standard for non-contact measurements, optical profilometers are gaining acceptance by standardisation committees.
2.3
Optical Coherence Tomography
the sample in an OCT system, owing to corresponding interference occurrence over a short distance of micrometres.
Since its proposal in ophthalmic studies, OCT has been attracting interest within the medical community because of its non-invasive imaging property. However, OCT’s capability to offer superb characterisation of sample internal structure with micrometre spatial resolution makes it stand out among other medical imaging systems. An overview of the imaging resolution and the penetration depth among the most common imaging techniques is provided in Fig. 2.1. As illustrated in this figure, X-ray CT, MRI and conventional ultrasonography can penetrate through the whole body but have low resolution imaging capability (typically a fraction of a millimetre) [35]. Confocal microscopy is advantageous to deliver micrograph of cells or tissues with sub-cellular imaging resolution. However, it is only able to probe up to 100 µm in depth and usually requires fluorescent staining during specimen preparation [36]. The prevalent NIRSI and TPI techniques provide more balanced spatial resolution (>20 µm) and penetration depths (<10 mm) that are adequate for many applications [37, 38]. Nevertheless, better spatial resolution are still required, e.g. to delineate the internal structures of retina and coronary arteries. OCT is capable of imaging features at a relatively high resolution (better than 10 µm) with millimetre scale probing depth, as shown in Fig. 2.1. It also provides a competitive imaging contrast based on the principle of interferometry. Hence, OCT acts as a complement to those conventional imaging techniques, providing better imaging and more detailed characterisation, especially for ophthalmic applications and biomedical tissues which demands micrometre resolution and millimetre penetration depth.
Axial Resolution (log)
1 mm
0 1 mm 1 cm 10 cm Entire Body
Penetration Depth (log)
Terahertz Pulsed Imaging
Ultrasound
Magnetic Resonance Imaging
Computer Tomography
Confocal Microscopy 100μm
10μm
1μm
[image:35.595.148.463.112.379.2]Optical Coherence Tomography
Fig. 2.1 An overview of the axial resolution and the penetration depth for imaging modalities including X-ray CT, MRI, ultrasonography, TPI, OCT and confocal microscopy.
by the system noise level [43]) on a smooth and reflective surface. However, they record interference waves instead and the surface position is directly measured by the peak position of the corresponding interference wave. In addition, large scale areal measurement is practical by using optical interferometric profilometry as they provide fast profiling. The large scale field of view can be easily acquired by adjusting the bulk-optics system.
Therefore, OCT is a great imaging modality, allowing both high resolution imaging of internal structure and high-precision profiling of superficial features.
2.3.1
Development of OCT
OCT is based on low-coherence interferometry (LCI), which has been used for non-contact depth ranging measurements with micrometre spatial resolution and superb sensitivities [44], such as non-destructively determination of the eye-length [45] and mapping of the surface contour of integrated circuits [46].
reflected signal as small as 10−10 of the incident optical power [1]. With the proposed time-domain OCT, it is possible to synthesise a cross-sectional image from a series of adjacent LCI depth scan signals by a photodetector; hence a 3-D image can be reconstructed by combining a series of adjacent cross-sectional images. Since then, a large amount of research was conducted regarding OCT development and applications covering various areas such as ophthalmology [3], cardiology [47], etc. Low (temporal-) coherent light sources, optical fibres, longitudinal and lateral translation devices are normally used in a standard OCT system. The most popular superluminescent semiconductor diodes (SLDs) and femtosecond lasers light sources have yielded 4.5 µm [48] and approximately 1 µm [49] depth resolution in OCT, respectively.
Fourier-domain (frequency-domain) OCT was proposed in 1995 by Fercheret al [50], following the generation of Fourier-domain OCT images in 1997 and 1998 [51–53]. The frequency-domain method broke the routine of time-domain OCT as the only method of OCT. The time-domain depth scans were replaced by spectroscopic measurements using a spectrometer (spectral-domain OCT) [54, 55] or by scanning the wavelength of a tuneable laser (swept-source OCT) [56, 57]. In terms of the imaging performance, Fourier-domain OCT exhibit same spatial resolution and faster scanning speed [58]. Moreover, it enhances the system sensitivity by, e.g. an improvement of 21.7 dB, over time-domain OCT [59] and is hence able to deal with more turbid sample structures [60].
2.3.2
Applications of OCT
Since the introduction of OCT, the non-invasive technique has been mainly applied for imaging in ophthalmology and optometry [67, 68]. Advances in OCT technology have made it possible to be used in a wide variety of applications during the past decade. The micrometre spatial resolution allows high precision investigations of both interior imaging and surface topography of specimen. The superior interferometric detection sensitivity enables optical radiation to penetrate reasonably deep into biomedical tissues and industrial materials [4, 69]. This section only presents a brief overview of some OCT applications, covering the main biomedical and non-biomedical applications.
a. Biomedical Applications
Ophthalmology is still the dominating field of the biomedical OCT. The ocular media generally exhibit high transmittance and low scattering in the visible and NIR region, which allows effective interferometric sensitivity and precision in the OCT imaging [3]. Furthermore, imaging of the fundus of the eye, especially the retinal structure can be perfectly fulfilled by OCT with high depth resolution at a lower beam NA. [4] (i.e. better penetration depth). Retinal OCT has been reigning in ophthalmology studies for the measurement of details of retinal pathologies [14, 56, 67, 70] and diagnosis of retinal disorders, such as macular degeneration [71–74] and macular oedema [75–79]. The evaluation of retinal nerve fibre layer, optic nerve head and macular thickness using OCT helps the detection and management of glaucoma [80–84]. Recently, the OCT technology is enhanced to be able to penetrate into the choroid [85–88] and measure choroidal thickness in normal eyes [89, 90].
In addition, OCT is helpful to investigate anterior segment [14, 91, 92], i.e. to image and measure corneal pathologies and structural changes of the chamber angle and iris. Anterior segment OCT provides comparable results with the conventional ultrasound biomicroscopy (UBM) method, but OCT is featured with a higher spatial resolution [93, 94]. Furthermore, OCT has also been applied to monitor the corneal laser ablation [95, 96] and cataract surgery [97].
Intracoronary OCT has been demonstrated as a safe and effective modality for characterising coronary atherosclerosis and vulnerable plaques [99–102], which are primary indications of acute coronary events including acute myocardial infarction (AMI) [103] and acute coronary syndromes (ACS) [104]. OCT delivers consistent image features with intravascular ultrasound (IVUS), which is the conventional standard for intracoronary imaging [99, 103]. However, OCT images turn out to have much better depth resolution than high frequency IVUS [105–107].
Likewise, endoscopic OCT with a catheter probe is applied to investigate GI track with several millimetres penetration depth and micrometre-scale spatial resolution. The GI wall structure is of a multiple layer architecture. OCT characterisation of the GI wall permits an accurate evaluation of the mucosa, lamina propria, muscularis mucosae, and part of the submucosa [4, 108, 109]. OCT has been used to predict the presence of many disorders of the GI tract, including dysplasia [110–114], metaplasia [115, 116], Barrett’s esophagus [111, 112, 117, 118], intramucosal carcinoma [112], adenocarcinoma [113, 117], malignancy [114, 119, 120], etc. Furthermore, the pancreatico-biliary ductal system can be explored by a side-view endoscopic OCT catheter probe [113]. The OCT resolution can be 10 times better (about 10 µm) than with the emerging catheter-probe endoscopic ultrasonography (CPEUS), but OCT’s depth of penetration is up to 3 mm [113]. Hence, it is potential that OCT and CPEUS can become complementary techniques for high-resolution endoscopic imaging of the GI tract [121].
Further biomedical applications using OCT techniques are in developmental biology, dermatology, dentistry, laryngology, pulmonary medicine, etc. [122–124]. Their histological architectures are evaluated by OCT, functioning as the optical biopsy to make an instant diagnosis at endoscopy. Previously, this was only possible by using histological or cytological analysis, which requires removal of a tissue specimen and processing for microscopic examination [2, 32, 125, 126].
b. Non-biomedical Applications
OCT enables a non-contact, non-invasive, and high-resolution imaging of subsurface features. It is already a well-established diagnostics technique in biomedical areas. However, OCT has been receiving attention as a non-destructive testing (NDT) tool for non-biomedical applications, with more and more research groups being engaged in further exploring possible applications of OCT [127, 128].
paintings [5, 129, 130]. Second, layer structures (or thicknesses) of moving plastic foils can be monitored with an in-line OCT system along with the foil production [131], which is applicable in the food packaging industry. Third, the potential of OCT has been demonstrated to non-destructively monitor coating structures of pharmaceutical tablets [7, 132, 133]. This helps control the manufacturing procedure and maintain the drug effectiveness in a more precise manner than the conventional ways, such as the weight-gain method.
Besides, OCT has also been used for contactless and faster measurements of textile roughness or surface topography, e.g. in printed electronics products quality [6] and in paper industry [134, 135]. Furthermore, OCT has been introduced for the characterisation of laser-drilled holes and micro-machined devices [136], organic solar cells [137], aerospace materials [138, 139], etc. Hence, OCT techniques help NDT of a wide variety of material systems and processes. The use of faster and more robust OCT devices in industrial environments is desired to enable thein situand real-time monitoring of industrial processes [127].
2.4
Principle of OCT
OCT is one of the optical interferometric techniques, which use superimposed EM waves or light beams to extract information about surface irregularities, subsurface structures [140, 141], and refractive indices [142]. Interferometry makes use of the principle of superposition to combine EM waves with same frequency in a way that the resulting pattern is determined by the phase difference between the two waves; constructive interference occurs when two waves are in phase, while destructive interference occurs if two waves are out of phase.
Conventional interferometry with temporal-coherence light source (e.g. narrow-linewidth laser) tends to have interference occurrence over a distance of meters. OCT and other interferometric techniques such as WLI, VSI (or CSI), PSI can be used in the context of LCI and typically configured in Michelson interferometers. These techniques all essentially apply the time-of-flight measurements [44], which measure the difference in the flight times of signals to travel a distance through a medium. The distance measurements are associated with interference events.
sources (or monochromatic radiation) can be used in PSI and VSI for laser beam wavelength measurements and measurement of the moving speed of an interferometer arm [146]. OCT employs a low (temporal-) coherence light source in a Michelson interferometer, although the linewidth of the radiation does not need to be broadband like WLI. In terms of signal acquisition, VSI moves a sample along the optical axis over the full depth range of the sample and measures the position of maximum fringe contrast (i.e. the fringe centre) to determine the sample surface profile [147]; while PSI performs phase shifts by using a piezoelectric transducer (PT) or modulating the source central frequency, and records multiple interference signals with fixed phase intervals (a precise fraction of the source central wavelength between each exposure) to derive structural information [42].
OCT is also one of the tomographic techniques, which perform optical sectioning of a sample with EM or light waves. Other tomographic techniques like X-rays CT, MRI, positron emission tomography (PET), ultrasound-modulated optical tomography (UMOT), confocal laser scanning microscopy (CLSM) enable frontal plane or transverse plane sectioning in medical diagnosis and industrial inspections. Consequently, volumetric imaging can be realised by combining a series of adjacent optical sections, allowing a 3-D evaluation of internal structures. For single point scanning scheme, a cross-sectional image is synthesised from a series of adjacent depth or transverse profiles. Unlike these mentioned tomographic techniques, OCT features micrometre resolution, millimetre scale penetration depth and high detection sensitivity, allowing more precise characterisation of the fine structures. Hence it is adequate and advantageous for microstructure samples, such as biomedical tissues, small industrial components etc.
2.4.1
Basic OCT Configuration
a. Michelson Interferometer
From the invention of OCT technology, the majority of OCT interferometers are Michelson configurations implemented in fibre-optics or in bulk-optics [1, 69, 148]. The Michelson interferometer is the heart of a typical OCT system.
relative phase or the difference between the optical path lengths (OPL) of the two recombined beams. Here, OPL is the product of the geometric length of the path light follows through the system, and the index of refraction of the medium through which it propagates. If the difference in OPL between the two beams, i.e. optical path difference (OPD), is within half a coherence length, interference between the beams can occur. Under above condition, the output interference beam intensity can be varied along with the changes of the OPD. The variations can thus be measured with a detector as a function of the OPD.
Fig. 2.2 Schematic diagram of a Michelson interferometer. M2: 50 % beam-splitter, M1, M3: dielectric mirrors. Adapted from Luckiet al [149].
b. Basic OCT Components
Fig. 2.3 presents general components integrated with the Michelson configuration in a typical OCT systems. A low-coherence light source is used to illuminate the interferometer. The light beam is divided into two separate arms by the beamsplitter. Reflections or scattering would occur at both arms when beam wavefronts encounter the reference mirror and the sample. The two returned beams are reunited and combine their intensities at the beam-splitter. The resulting beam is typically directed to a photoelectric detector with the instantaneous light intensity recorded. To make measurements of the optical interference event, the returning sample and reference beams are made to interfere on condition that their OPD is within half the coherence length, where the output intensity is recorded by the detector.
source central wavelength and spectral width are crucial to the OCT imaging performance. According to the Beer-Lambert law, optical penetration depth is related to the material absorbance [150], which is strongly wavelength dependent [151]. Hence, OCT employing different spectral ranges leads to various OCT probing depths, for example, OCT applying NIR radiation can penetrate deeper than that with the white light in biomedical tissues. Besides, OCT depth resolution is defined by the temporal coherence of the light source, which is proportional to the central wavelength, and inverse proportional to the spectral width. Popular light sources in OCT include SLD [1], femtosecond Titanium-sapphire laser [49], photonic crystal fibre based light source [152, 153] and thermal source [154], etc. Note that, all optical components including the beam-splitter and detector should have a corresponding spectral range to the chosen light source.
The OCT detector is required to have superior performance characteristics including fast data acquisition speed and excellent sensitivity, noise and homogeneity [4]. Photodetectors equipped with charge coupled device (CCD) sensors and complementary metal-oxide-semiconductor (CMOS) sensors are used for high quality imaging performance [155]. Modern progresses made in CCD and CMOS technologies has led to faster acquisition speed and enable real-time imaging [156, 157].
OCT operating single-point scheme requires to perform depth scanning whilst laterally scanning the beam in either one or two orthogonal directions, in order to obtain a 2-D or 3-D image [158]. A control module should be included to operate all mechanical scans and trigger the data acquisition of the photodetector. A process module is also required to perform on-line or off-line data processing for the purpose of further characterisation, analysis and presentation of the OCT images.
In addition, OCT systems are generally composed of either bulk-optics or fibre-optics or a mixture of both setups. Traditional bulk-optics comprise discrete optical elements, which offers high flexibility and convenience in development, testing and maintenance, as one can easily remove or replace optical components and access optical powers or beam profiles [159]. However, fibre-based OCT systems are particularly adaptable to industrial environments [160]. They can access interiors of hard-to-reach spaces [161], and operate in hostile environments - whether radioactive, cryogenic, or very hot [162].
c. OCT Optics
In time-domain OCT, sample depth structures are recorded as a sequence of partial temporal coherence interference signals [163]. These interference signals are generated by modulating the OPL of either one interferometer beam using optical delay lines, while their signal intensities are based on the complex of the back scattered sample beam and the back reflected reference beam. With this detection scheme, the weak structural signal from the sample is dramatically amplified by interfering with a strong coherent carrier wave [164].
Unlike the time-domain OCT with an OPL modulated beam, Fourier-domain OCT is operated in the frequency domain [50]. It can be implemented either based on a spectrometer detector (spectral-domain OCT) or on a tuneable laser source (swept-source OCT) [4]. While both interferometer arms remain fixed OPLs, the sample depth structural information can be derived by the inverse Fourier transform (FT) of the output spectrum of the interferometer. Both time-domain OCT and Fourier-domain OCT have been shown to be equivalent in terms of depth resolution [165].
Standard A-scan signals are derived from OCT interference signals after a depth scan in time-domain OCT, otherwise, they are obtained from the FT of OCT spectrums in Fourier-domain OCT. For both cases, A-scan signals convey single point structural information along the depth direction. OCT B-scan images are cross-sectional images synthesised from laterally adjacent OCT A-scans, analogous to ultrasound A-scans and B-scan images [4]. B-scan images present depth oriented 2-D structural distributions, which provide important information regarding the layer structure (or thickness) and media distribution, etc. OCT volume image is thus the combination of a series of laterally adjacent B-scan images, offering a straightforward presentation of the spatial or 3-D structural distribution. The spatial structure variations over time are also assessable with OCT.
To obtain A-scan signals and B-scan images, the depth scan is implemented with the linear translation stage in time-domain OCT. Fourier-domain OCT eliminates the needs of depth scanning, but requires inversely Fourier transformed spectrum to derive the A-scan signals. Lateral scans in single-point OCT systems are usually performed by laterally moving the sample under test or moving focus of the probing beam with the help of, e.g. a galvanometer scanner or a laterally scanning mirror [3]. Parallel OCT systems adopt a 2-D detector array, thus avoiding the needs of lateral scanning for the spatial evaluation of the sample, but it still requires OPL modulated depth-scan to record longitudinally distributed OCT signals.
d. Other OCT Configurations
light interferometrically. Other configurations based OCT systems, e.g. Fizeau [166], Mach–Zehnder [155], Fabry-Perot [68], and Linnik interferometers [8], have been proposed to serve performance enhancement and specific requirements. In addition, different beam probes have been incorporated to standard OCT systems for macroscopic, microscopic and endoscopic imaging purposes [69].
Optical coherence microscopy (OCM) aims at tomographic imaging with high transverse resolution [167]. It is generally implemented in a Linnik interferometer [8], which is essentially equipped with high NA lenses (such as microscopy objectives) in both interferometer arms to focus the probe beam at the sample or reference. Extremely high transverse resolution is achievable with the adoption of water / oil immersed objectives. As the depth resolution is decoupled of the transverse resolution, high depth resolution can be achieved simultaneously in OCM by the use of broadband light sources, like femtosecond lasers, photonic crystal fibre based or thermal light sources, etc.. Besides, OCM presents more effective optical sectioning over the conventional confocal scanning microscopy (CSM) in highly scattered samples, by providing improved rejection of scattering light at defocused planes [69]. It is potential to be used for real-time optical biopsy [32].
Endoscopic OCT is proposed for its superior spatial resolution and higher sensitivity compared to CPEUS for diagnosis of intra-abdominal organs [125]. By integrating a catheter with fibre-optic sample probe arm, the OCT instrument can enable imaging of intraluminal disorders and optical biopsy into organs for cancer diagnosis. The technique has been applied for imaging in GI tract and vascular systems clinically, while there remains a wide range of promising clinical applications, such as the respiratory tract, the ovary, the breast duct and the liver, where OCT endoscopes can have significant impact [168].
2.4.2
Time-Domain OCT
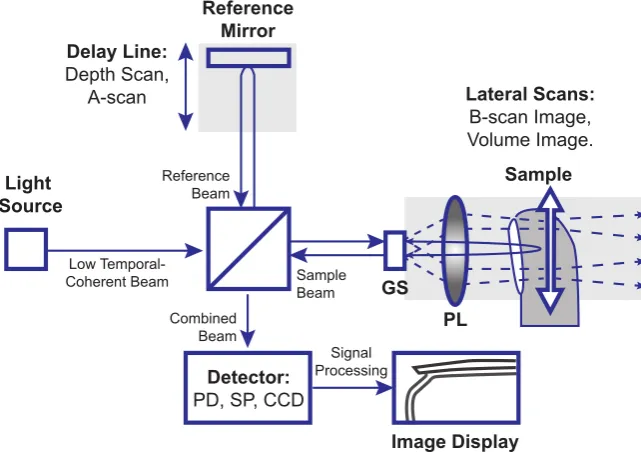
Typical time-domain OCT is based on the reflectometry LCI [1, 169], which is carried out in a Michelson interferometer by moving the reference mirror continuously along the beam axis. This is to perform a depth scanning to detect depth positions of back scattering sites in the sample. However, in addition to the LCI depth scans, time-domain OCT also needs the lateral scans to address laterally adjacent sample positions. Fig. 2.4 shows a time-domain OCT system and its representative outputs.
low-coherent light source, beam-splitter, a reference mirror, bulk optics. The control module is needed to operate the translating stage and the galvano scanner as well as the triggering of the photodetector. The processing module needs to be involved with low-pass filters and band-pass filters to process the recorded interference signals into the A-scan signals and display the resultant B-scan image for further analysis as shown in Fig. 2.4.
OCT Lateral Scanning OCT Depth
Scanning reference
lens
sample lens Reference Mirror
Sample
Photo-detector
Interferogram
A-scan Signal time
depth I
I
depth
B-scan Image rotating
mirror
Fig. 2.4 Schematic diagram of time-domain OCT in free-space optics configuration. An interferogram is generated for each OCT depth scan. The A-scan signal is its real envelope, which can be extracted through a low-pass filter or band-pass filter. B-scan image is the combination of a series of depth scans performed after each OCT lateral scan.
To display a series of cross-section or B-scan images over time, conventional point-scan OCT also performs lateral scans either by laterally moving the sample or by moving the probe beam. It must scan the sample in two lateral dimensions to reconstruct a 3-D image of the sample volume by using depth information obtained by coherence-gating through an axially scanning reference arm. 2-D lateral scanning can be electromechanically implemented by moving the sample using a translation stage, or using a novel micro-electro-mechanical system scanner in a raster scanning style.
a. Theoretical Formulae
ConsideringEs(t)andEr(t,τ)as the time-dependent electric fields from the sample and the reference, the recombined electric fieldEout(t,τ)at the beam-splitter can be given by:
Eout(t,τ) =Es(t) +Er(t,τ) (2.1)
However, the mutual coherence function between the two beams is expressed as:
Γsr(τ) = (Es⋆Er)(τ)
=⟨Es(t)Er(t+τ)⟩ (2.2)
= lim T→∞
1 2T
Z T
−T
Es(t)Er(t+τ)dt (2.3)
In equations 2.1 - 2.3,τ is the time delay between two beams, denoting asτ =∆z/υ, where
∆zis the OPD between the two beams andυ is the speed of light in vacuum;⋆indicates the cross-correlation of two terms; the angled brackets⟨...⟩denote a time-average, suggesting an average amount of the enclosed term integrating over time (see equation 2.3).
The interferogram termGsr(τ)given by twice the real part (indicated byℜ[...]) of the
mutual coherence functionΓsr(τ)can be specifically expanded as [3]:
Gsr(τ) =2ℜ{Γsr(τ)}
=2ℜ{1
2
p
Is(t)Ir(t)|γsr(τ)|eiΦ(τ)}
=pIs(t)Ir(t)|γsr(τ)|cosΦ(τ) (2.4) Here,Is(t)andIr(t)are respective time-average intensities of sample and reference beams; γsr(τ)is the degree of coherence; the instantaneous phaseΦ(τ)is computed byα0−2π ν0τ, where 2π ν0τ is the phase delay between the sample and the reference beam,ν0is the source central frequency andα0is a constant phase.
The photo-detectors of time-domain OCT are square law detection devices, where the recorded intensity is a time-average intensity over the electric field multiplied by its complex conjugate [158]:
IPD(τ) =⟨Iout(τ)⟩
Substituting equations 2.1, 2.2 and 2.4 into Equation 2.5, the photo-detector recorded intensity can be found as the sum of two beam intensities and their interferogram intensity:
IPD(τ) =⟨Es(t)Es∗(t)⟩+⟨Er(t,τ)Er∗(t,τ)⟩+Gsr(τ)
=Is(t) +Ir(t) +Gsr(τ) (2.6)
The time delayτ is the corresponding optical time-of-flight difference, which is proportional to the OPD ∆zinduced by moving reference mirror by a geometric displacement z=τc. Hence, a single point time domain signal can be expressed in a more compact version as a function ofz,
IPD(z) =Is(t) +Ir(t) +Gsr(z)
=IDC(t) +M(z)cos[Φ(z)] (2.7)
where IDC(t) =Is(t) +Ir(t) representing the DC intensity term from two interferometer arms,Gsr(z) =M(z)cosΦ(z)is the displacement dependent interferogram term; andM(z) =
p
Is(t)Ir(t)|γsr(z)|stands for the envelope of the interferogram or the OCT A-scan signal, corresponding to sample structural variations along the depth direction; the instantaneous phaseΦ(z) =α0−2π ν0z/cis also depth dependent. However, the A-scan signalM(z)can also be regarded as the analytical signal of the interferogramGsr(z). Hence, both the A-scan signalM(z)and phase informationΦ(z)can be obtained byGsr(z)and its Hilbert transform (HT) using Equations 2.8 and 2.9:
M(z) =1
2
q
(Gsr(z))2+ (HT{Gsr(z)})2 (2.8)
Φ(z) =arctan
HT{Gsr(z)}
Gsr(z)
(2.9)
b. Depth Scanning with Heterodyne Detection