T E C H N I C A L N O T E
Open Access
A combinatorial approach to the restriction of a
mouse genome
Leonid V Bystrykh
Abstract
Background:A fragmentation of genomic DNA by restriction digestion is a popular step in many applications. Usually attention is paid to the expected average size of the DNA fragments. Another important parameter, randomness of restriction, is regularly implied but rarely verified. This parameter is crucial to the expectation, that either all fragments made by restriction will be suitable for the method of choice, or only a fraction of those will be effectively used by the method. If only a fraction of the fragments are used, we often should know whether the used fragments are representative of the whole genome. With a modern knowledge of mouse, human and many other genomes, frequencies and distributions of restriction sites and sizes of corresponding DNA fragments can be analyzedin silico. In this manuscript, the mouse genome was systematically scanned for frequencies of
complementary 4-base long palindromes.
Findings and conclusions:The study revealed substantial heterogeneity in distribution of those sites genome-wide. Only few palindromes showed close to random pattern of distribution. Overall, the distribution of frequencies for most palindromes is much wider than expected by random occurrence. In practical terms, accessibility of genome upon restriction can be improved by a selective combination of restrictases using a few combinatorial rules. It is
recommended to mix at least 3 restrictases, their recognition sequences (palindrome) should be the least similar to each other. Principles of the optimization and optimal combinations of restrictases are provided.
Keywords:DNA fragmentation, Genome restriction, Randomness of genome
Background
Fragmentation of genomic DNA is very usual step in many protocols aimed at genomic analysis. For instance, studies of DNA methylation employ a genomic restriction protocol with a pair of enzymes, one of which is sensitive to the methyl cytosine in the context of a CG di-nucleotide [1-3]. Telomere length can be measured by use of a combination of for instance two restriction enzymes [4] with the expectation that the longest fragment in the digest will be the telomeric region. A reduced representa-tion approach employs the idea that a randomly selected fraction of DNA fragments adequately represent the whole genome, yet the size of the genomic sample can be substantially reduced [5-8]. A strategy of restriction site associated markers (RAD) for high throughput genotyping is another example of this concept [9]. A few methods aim
for maximal accessibility of the genome fragments for de-tection of some particular genomic elements, for instance retro elements [10-13] or retroviral vectors integrating into the genome [14-16].
In all those kinds of applications it is important to know the cost of deviation from the expected pattern of genomic fragmentation. Issues of genomic bias from randomness can be largely ignored in case of, for in-stance, restriction-based analysis of DNA methylation: they are exclusively aimed at CpG analysis rather than a randomly sampled genome, the restriction schemes used work well with CpG rich loci but miss large parts of CpG poor regions. In the case of reduced representation, biased genome sampling might affect the calculated gen-ome diversity and phylogeny as a consequence [17]. In the case of genome accessibility, the requirements of the genomic restriction are the highest due to a risk of miss-ing the genomic element in question and drawmiss-ing incor-rect conclusions as a consequence. In the search for endogenous retro elements, we deal with hundreds of
Correspondence:[email protected]
Laboratory of Ageing Biology and Stem Cells, European Research Institute for the Biology of Ageing, University Medical Center Groningen, University of Groningen, Antonius Deusinglaan 1, 9700 AD, Groningen, The Netherlands
those elements across the entire genome, therefore miss-ing a fraction of those might be acceptable. In the case of an analysis of retroviral integration sites, a relatively small number of integrations per cell are generally expected. Therefore the risk and the cost of missing those few might be very high. Yet a common practice of using particular restriction schemes is highly empirical. For a long time, only one restriction enzyme was used for the recovery of retroviral integration sites [18]. It wasn’t until 2007 that Harkey et al., [14] confronted this practice and initiated a search for the optimal combin-ation of restriction enzymes, since a single enzyme re-striction was claimed to be ineffective. Ideally all fragments should be as close as possible to the preferred average. An average fragment size should fit the require-ments of the assay. Note that studies performed on the analysis of the endogenous retro elements use combina-tions of 6-base enzyme restrictases [12,13], which are generally very rare cutters falling below 1 cut per 1 kb. Those authors claim a rather broad window of detection, namely up to 4 kb long fragments, therefore the restric-tion they used would serve the purpose. In a retroviral integration site analysis, the distance of the integrated vector to the restriction site is recommended to be in a range of 20–200 bp [15]. In practice this means that re-striction with an enzyme which has an average frequency in the range 5–50 cuts per 1 kb will serve the purpose. Frequent 4-base cutters formally suit those requirements on average. However, it is equally important to ensure that restriction is positionally close to random, as de-fined for instance in [19]. Until now, this point was rarely expressed or taken in consideration. Since DNA is highly non-random and variable in local frequencies of particular nucleotides is highly unlikely to expect ran-dom distribution of restriction sites for any particular restrictase across genome. In the field of retroviral in-tegration site analysis, authors have attempted to circum-vent the genome accessibility problem by combining 4-base recognizing restriction enzymes either empir-ically [16,20], or using a combination of the most fre-quent cutters [15]. Those combinations are claimed to reach >95% of the whole mouse genome. Although increasing the average restriction frequency might be helpful, this alone is not sufficient to ensure improve-ment along the entire genomic sequence. It is import-ant to verify that genomic loci void of some particular restriction site will be cut by another enzyme added to the combination and eventually reduce the vari-ation of restricted fragment sizes to the minimum. Al-ternatively, if the added enzyme would cut at the same loci as another enzyme from the selected en-zyme mixture, such a combination will probably be rather counter-effective. It is important therefore to check whether the spectrum of restriction fragments
used fits the requirements of the analysis. This inevit-ably leads to the question how close the distribution of any enzyme or a combination of enzymes is to the random distribution (since an option of making equal fragments is not realistic). If it is too wide, how can it be reduced in practical terms? To illustrate this, all possible complementary palindromes were scanned along the mouse genome, those sites were analyzed for frequencies and randomness of distribution both for each site separately and in combinations. The ana-lysis revealed that distribution of all 4-base long re-striction sites is wider than expected by random. A few simple rules can be followed to achieve combina-tions of restriction sites which fit to a random model. None of the combinations could create a narrower distribution of restriction sites than expected by random.
Findings
Fitness to the Poisson distribution
At present detailed description of mouse and other ge-nomes can be found at several WEB sites, such as NCBI (http://www.ncbi.nlm.nih.gov/genome), Ensembl (http:// www.ensembl.org/index.html), or UCSC (http://genome. ucsc.edu). Since the mouse genome is almost completely assembled, frequencies of all possible restriction sites can be mapped with a high precision. This work is mainly focused on an analysis of 4-base long
palin-dromic sequences. Naturally 24= 16 combinations of
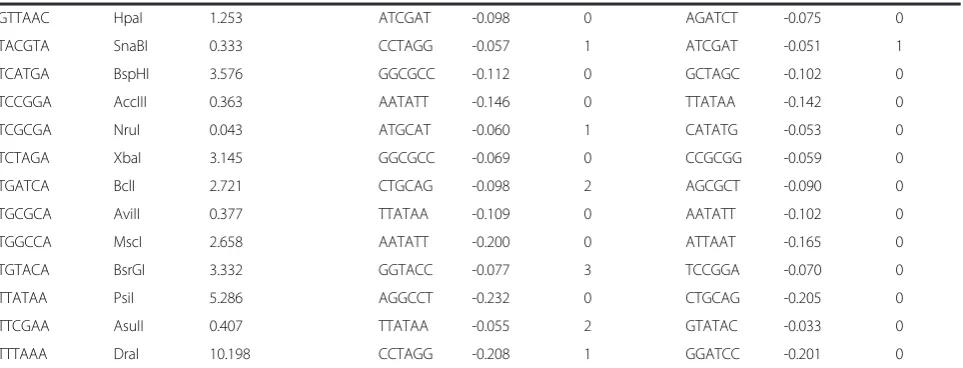
complementary palindromes are possible since the last two bases always depend on the combination of the 1st two bases. All chromosomes were scanned for each pal-indrome, and frequencies of all palindromes per 1 kb non-overlapping windows along the entire chromosome were recorded and further analyzed. Each restriction site showed a rather variable average, varying from 8.25 sites/kb for ATAT on chromosome X to 0.06 sites/kb for CGCG on chromosome Y. For each palindrome, esti-mated frequencies of cuts were compared with the ran-dom hypothesis (Poisson distribution). From the results shown on a Figure 1A is clear that AT-rich palindromes are the most frequent cutters and they deviate the most from the random distribution. Balanced palindromes (those which contain all 4 bases) tend to fit the best to the random test across all frequencies of restrictions, CG-rich palindromes show reasonable randomness but low fre-quencies of occurrence. The way experimentally found frequencies deviate from the Poisson model is very uni-form: Poisson systematically underestimates both low and high frequencies of the distribution (Figure 2A), in other words: the real distribution is systematically wider than expected by random. This deviation can be better
visual-ized in a kind of a “lasso” plot: by plotting observed
A
B
Figure 1Frequencies of occurrence and randomness of 4-base palindromes across mouse genome.2D plot of randomness, measured as an F-test P value versus average frequencies of tetra-palindromes on all mouse chromosomes(A)and trends of randomness for non-AT rich palindromes upon changing bin size and average frequencies per bin therefore(B). Note that GATC, CTAG, TGCA remain quite stable, whereas CG-containing palindromes are moving towards the area of AT-rich palindromes.
A
B
[image:3.595.56.540.329.698.2](Figure 2B). Ideally if observed and predicted frequen-cies are equal, such a plot should generate a straight line. Instead, it shows a“lasso”-like curve. Importantly, in the case of low cutters, the shoulders of the distri-bution are smaller, which can cause a better fit to the Poisson when low efficiency cutters are compared to high efficiency enzymes (Figure 1A). To test this, the bin size was varied from 1 kb to 2, 5, 10, 25 kb respect-ively and the fitness of the lower frequency palin-dromes to the random model was repeatedly measured (Figure 1B). By increasing bin size from 1 kb to 8 kb (and consequently increasing the average frequency per bin), P values from an F-test became slightly worse for balanced, non-CG containing palindromes (GATC, CTAG, TGCA). Among unbalanced palindromes, a profound change in F-test P value was recorded. In fact the difference between AT and GC rich sites appeared to be due to the differences in frequencies only. When the bin size was increased, CG rich palin-dromes showed very comparable frequencies per bin and randomness values as found for AT-rich dromes. To conclude: CG-rich and AT-rich palin-dromes, although different in frequencies, are not different in their randomness, rather the F-test is sen-sitive to the frequencies instead.
Similarity metric by di-nucleotide count
In addition to classification of palindromes as AT-rich, GC-rich and balanced, it is useful to introduce more a precise measure of similarity or difference between
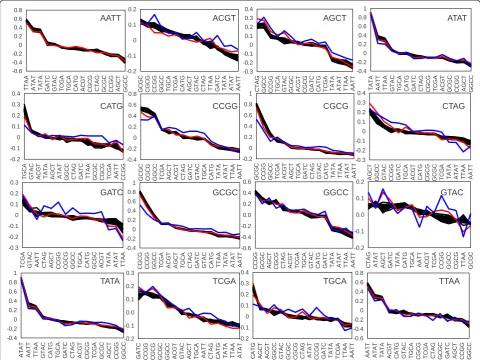
palindromes. Since all of them are composed of comple-mentary pairs of bases, a comparison of di-nucleotide composition in each palindrome is a naturally suitable metric. Each palindrome can contain up to 3 different di-nucleotides, for instance the AGCT palindrome con-tains AG, GC, and CT di-nucleotides. As is shown in Figure 3A, many palindromes have variable similarity to others by having 2 to 3 di-nucleotides in common. For each of 16 possible palindromes, there is at least one highly similar palindrome with 2 di-nucleotides in common.
The same metric was applied for a list of currently known 6-base restriction sites (Table 1). Important dif-ference between 4-base cutters and 6-base cutters is that whereas tetra-palindromes fall naturally in 3 different categories, AT-rich, CG- rich and balanced, hexa-palindromes cannot be fully balanced. Instead, all variety of 6-base sites (totally 55 known restriction sites) falls into 4 groups: AT-rich (e.g. TTTAAA), CG-rich (like CGGCCG), but also AT-enriched (CTTAAG) and GC enriched (CTCGAG).
Correlations between palindrome frequencies along the chromosome
Cross correlation of all tetramer palindromes across mouse chromosome 1 revealed that an average of those correlations slightly shifted into negative region (Figure 3B), the positive shoulder is longer than the negative one. Note that a correlation is analyzed through tens of thousands data points and even small
A
B
[image:4.595.60.539.461.686.2]C
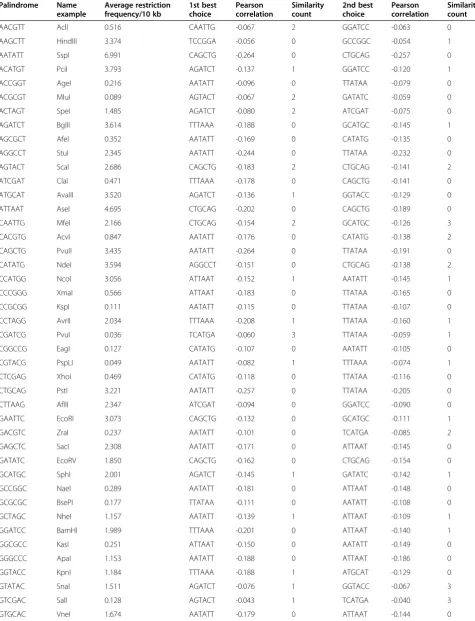
Table 1 Pearson-based combinations of known 6-mer restriction enzymes
Palindrome Name
example
Average restriction frequency/10 kb
1st best choice
Pearson correlation
Similarity count
2nd best choice
Pearson correlation
Similarity count
AACGTT AclI 0.516 CAATTG -0.067 2 GGATCC -0.063 0
AAGCTT HindIII 3.374 TCCGGA -0.056 0 GCCGGC -0.054 1
AATATT SspI 6.991 CAGCTG -0.264 0 CTGCAG -0.257 0
ACATGT PciI 3.793 AGATCT -0.137 1 GGATCC -0.120 1
ACCGGT AgeI 0.216 AATATT -0.096 0 TTATAA -0.079 0
ACGCGT MluI 0.089 AGTACT -0.067 2 GATATC -0.059 0
ACTAGT SpeI 1.485 AGATCT -0.080 2 ATCGAT -0.075 0
AGATCT BglII 3.614 TTTAAA -0.188 0 GCATGC -0.145 1
AGCGCT AfeI 0.352 AATATT -0.169 0 CATATG -0.135 0
AGGCCT StuI 2.345 AATATT -0.244 0 TTATAA -0.232 0
AGTACT ScaI 2.686 CAGCTG -0.183 2 CTGCAG -0.141 2
ATCGAT ClaI 0.471 TTTAAA -0.178 0 CAGCTG -0.141 0
ATGCAT AvaIII 3.520 AGATCT -0.136 1 GGTACC -0.129 0
ATTAAT AseI 4.695 CTGCAG -0.202 0 CAGCTG -0.189 0
CAATTG MfeI 2.166 CTGCAG -0.154 2 GCATGC -0.126 3
CACGTG AcvI 0.847 AATATT -0.176 0 CATATG -0.138 2
CAGCTG PvuII 3.435 AATATT -0.264 0 TTATAA -0.191 0
CATATG NdeI 3.594 AGGCCT -0.151 0 CTGCAG -0.138 2
CCATGG NcoI 3.056 ATTAAT -0.152 1 AATATT -0.145 1
CCCGGG XmaI 0.566 ATTAAT -0.183 0 TTATAA -0.165 0
CCGCGG KspI 0.111 AATATT -0.115 0 TTATAA -0.107 0
CCTAGG AvrII 2.034 TTTAAA -0.208 1 TTATAA -0.160 1
CGATCG PvuI 0.036 TCATGA -0.060 3 TTATAA -0.059 1
CGGCCG EagI 0.127 CATATG -0.107 0 AATATT -0.105 0
CGTACG PspLI 0.049 AATATT -0.082 1 TTTAAA -0.074 1
CTCGAG XhoI 0.469 CATATG -0.118 0 TTATAA -0.116 0
CTGCAG PstI 3.221 AATATT -0.257 0 TTATAA -0.205 0
CTTAAG AflII 2.347 ATCGAT -0.094 0 GGATCC -0.090 0
GAATTC EcoRI 3.073 CAGCTG -0.132 0 GCATGC -0.111 1
GACGTC ZraI 0.237 AATATT -0.101 0 TCATGA -0.085 2
GAGCTC SacI 2.308 AATATT -0.171 0 ATTAAT -0.145 0
GATATC EcoRV 1.850 CAGCTG -0.162 0 CTGCAG -0.154 0
GCATGC SphI 2.001 AGATCT -0.145 1 GATATC -0.142 1
GCCGGC NaeI 0.289 AATATT -0.181 0 ATTAAT -0.148 0
GCGCGC BsePI 0.177 TTATAA -0.111 0 AATATT -0.108 0
GCTAGC NheI 1.157 AATATT -0.139 1 ATTAAT -0.109 1
GGATCC BamHI 1.989 TTTAAA -0.201 0 ATTAAT -0.140 1
GGCGCC KasI 0.251 ATTAAT -0.150 0 AATATT -0.149 0
GGGCCC ApaI 1.153 AATATT -0.188 0 ATTAAT -0.186 0
GGTACC KpnI 1.184 TTTAAA -0.188 1 ATGCAT -0.129 0
GTATAC SnaI 1.511 AGATCT -0.076 1 GGTACC -0.067 3
GTCGAC SalI 0.128 AGTACT -0.043 1 TCATGA -0.040 3
correlation values are highly significant. For instance, a correlation of 0.05 along one of the smallest chromo-some 19 collects approximately 60000 data points and a corresponding p-value < 0.0001. A selection of the lowest 10 and the highest 10 correlations (Figure 3C), which constitutes 19% of all correlated pairs, appeared to be enriched with unbalanced palindromes (note that the number of balanced and unbalanced palindromes is equal). Of those, palindromes similar in their di-nucleotide composition and type of enrichment (GC or AT) show significant positive correlations. The com-plementary palindromes from opposite enrichment groups tend to show negative correlation. Analysis of correlations was repeated for all chromosomes. Similar results were obtained for the same palindrome along the whole mouse genome (Figure 4, Additional file 1: Table S1). Note that only X and Y chromosomes devi-ated most drastically from the common trend whereas all autosomes showed highly similar results. In prac-tical terms, this finding ensures that analysis of one autosome is already well representative of the whole mouse genome. It saves computational time as well as simplifying visualization of the data. The trends found by di-nucleotide context and palindrome enrichment type could be further followed and analyzed in more detail during the selection of a series of best anti-correlating palindromes. Obviously, the purpose of such selection is to test the possibility of finding com-binations of various restriction sites where a desired aver-age frequency is achieved together with minimal bias and maximally possible randomness of distribution.
A negative correlation strategy
We can try to begin with each of the 14 palindromes for which restriction enzymes are available and follow the
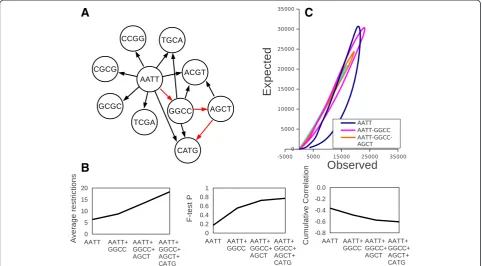
most negatively correlating site as the best candidate for a mixture. At this stage ATAT and TATA palindromes were excluded from analysis since they do not represent any known restriction enzyme. An algorithm will step-wise select for the most negatively correlating palin-drome and consecutive count of combined frequencies of already selected palindromes. An example of such a strategy is shown in Figure 5 for the selected sequences AATT, GGCC, AGCT, and CATG. A network graph shows that the total number of negatively correlating palindromes gradually decreases upon addition of the next palindrome to the mixture. Whereas AATT is negatively correlating with 8 different palindromes, addition of the third palindrome, AGCT shows only two candidates, ACGT and CATG. Upon addition of the last palindrome, CATG, no more candidates to the mixture were revealed (in a threshold <−0.05). Note that the cor-relation value between the selected group and every sub-sequently added palindrome is decreasing (and the cumulative correlation value is decreasing as well, Figure 5B). At the same time, randomness (fitness to the Poisson distribution) of the combined palindrome frequencies is asymptotically increasing, as shown in the“lasso”plot (Figure 5C), namely a plot of observed frequencies versus expected gradually became linear. A full screen of all possible starting palindromes re-vealed that, in fact, good randomness is already achieved in a mixture of 3 palindromes. Further addi-tions are useful mainly to satisfy average restriction frequency.
[image:6.595.58.540.101.285.2]When starting with different palindromes, out of 14 trials (with all possible palindromes as the 1st choice) only 10 unique combinations were found (for details see Additional file 1: Table S2). In this series there is a strong effect of the most frequent and most biased
Table 1 Pearson-based combinations of known 6-mer restriction enzymes(Continued)
GTTAAC HpaI 1.253 ATCGAT -0.098 0 AGATCT -0.075 0
TACGTA SnaBI 0.333 CCTAGG -0.057 1 ATCGAT -0.051 1
TCATGA BspHI 3.576 GGCGCC -0.112 0 GCTAGC -0.102 0
TCCGGA AccIII 0.363 AATATT -0.146 0 TTATAA -0.142 0
TCGCGA NruI 0.043 ATGCAT -0.060 1 CATATG -0.053 0
TCTAGA XbaI 3.145 GGCGCC -0.069 0 CCGCGG -0.059 0
TGATCA BclI 2.721 CTGCAG -0.098 2 AGCGCT -0.090 0
TGCGCA AviII 0.377 TTATAA -0.109 0 AATATT -0.102 0
TGGCCA MscI 2.658 AATATT -0.200 0 ATTAAT -0.165 0
TGTACA BsrGI 3.332 GGTACC -0.077 3 TCCGGA -0.070 0
TTATAA PsiI 5.286 AGGCCT -0.232 0 CTGCAG -0.205 0
TTCGAA AsuII 0.407 TTATAA -0.055 2 GTATAC -0.033 0
TTTAAA DraI 10.198 CCTAGG -0.208 1 GGATCC -0.201 0
palindromes, like TTAA, AATT, which always require CG rich palindromes for compensation, the most frequent compensating palindrome was found to be GGCC. A network of 1st 2 choices made by the negative correlation strategy illustrates this trend (Figure 6A) and summarizes
a “popularity contest” among different palindromes.
Figure 6B shows the total frequency of palindromes in a complete series of 5 out of 14. Similarly, AATT, AGCT, CATG and GGCC appeared to be the most fre-quent choices for a Pearson-based strategy.
During this analysis, it was found that there is an ap-proximate solution for the laborious recalculation of cor-relation coefficients upon addition of a new palindrome to the mixture (it was actually done for all discussed ex-amples). In fact the next best palindrome can be found using the primary paired correlation table by estimating the weighted (by restriction frequency) average between two previously added components (group or single palindrome, more details in Additional file 1: Table S1, page example), the palindrome with the most negative
correlation to the group can be selected as the next best candidate to the mixture.
Use of an F-test for finding palindrome combinations
[image:7.595.57.538.90.450.2]the F-test value became worse, which hinders the search for the optimal randomization. This approach is inferior to the selection by negative correlation and can be recommended for balanced and frequent palin-dromes only.
Comparison with combinatorial model
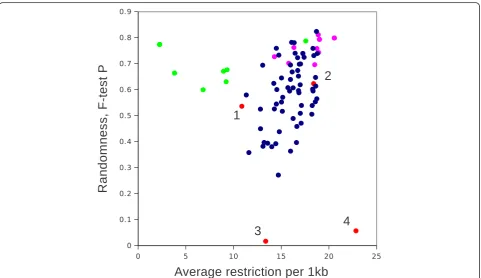
It was already mentioned above (Figure 3C) that the resulting combinations based on a Pearson correlation revealed interesting combinatorial rules: similar palin-dromes will be naturally excluded and the most dissimilar palindromes will be selected (as they are negatively correl-ating). We can follow this trend in more detail by counting cumulative frequencies of all possible di-nucleotides within previously found combinations of palindromes (Additional file 1: Table S2). Note that since each palindrome can contain 3 different di-nucleotides at maximum the non-redundant set of restriction sites (no repeated use of di-nucleotides is allowed) should not be higher than 5. Al-though a maximum of 15 di-nucleotide combinations out of 16 possible could be reached, the results show that maximal coverage of possible di-nucleotides in a set of 15 palindromes is 14. Out of 8568 combinations screened, a list of 60 combinations containing 14 different di-nucleotides was generated. A variation of total restriction frequencies varied from 1 to 19 per 1 kb bin size. Selective testing for randomness with the F-test demonstrated that
these are quite credible combinations quite closely resem-bling the sets generated by the negative correlation strat-egy (Figure 7). Overall, the cloud of all combinations found is broad in terms of an average frequency and fitness to the random distribution. Out of 60 total combinations, all except CGCG and GCGC were equally represented in these series (Figure 6B). A selec-tion by Pearson correlaselec-tion is localized with few more examples found by combinatorial approach. Both of them are substantially better than combinations found using F-test fitness to Poisson distribution. Only one alter-native combination with high total frequency of restriction was found in a set of F-test generated series, the same combination was the best regarding randomization of di-nucleotides.
Previously suggested combinations
As already mentioned before, a use of a single cut for studies of retro elements is problematic, since neither frequency nor accessibility of fragments are at their optimum. In the case of retroviral integration site analysis, one restriction enzyme, cutting at TTAA was used for quite some time. It is only since 2007 [14], when a mixture of enzymes was suggested in order to maximize genome accessibility. Figure 7 and Additional file 1: Table S2 dem-onstrate average frequencies and randomness of a few published combinations. A mix by Wang et al. [16] is
A
C
[image:8.595.57.540.90.356.2]B
unnecessarily redundant. After removing redundancy it became identical to a mix suggested by Gabriel et al. [15], who were aiming on the maximal restriction frequency ig-noring a di-nucleotide bias in selecting two AT-rich en-zymes, one balanced (also AT containing) and no GC rich enzymes. As a consequence, such a mixture is highly non-random and the spread of the cut fragment size will be
unnecessarily broad: it will systematically undercut GC-rich regions, many of which are situated in promoter regions, which are potential targets for integration of retroviral vectors. Similarly, an empirical set by Biasco et al. [20] is almost the same in average frequency as given by Harkey et al., (2007). However, the difference in randomness of those mixtures is dramatic. Extensive
[image:9.595.59.539.89.255.2]A
B
Figure 6Typical choices and total numbers of unique sets in different strategies of combining restriction enzymes. A, a network representation of the first two choices made by the most negative correlation strategy when using all possible palindromes. Note that AATT and GGCC are the most frequent choices.B, a histogram count of all used palindromes using different strategies. Note that Pearson and Poisson strategies used 14 trials in total, the combinatorial approach used 60 trials (total unique combinations).
[image:9.595.58.540.416.694.2]restriction of AT rich regions by mixing the most fre-quent restrictases faces a risk of generating too small fragments (primarily in AT rich regions) to be used for site identification. On the contrary, the addition of GC-rich restrictases, albeit with a minimal increment in average frequency, will substantially improve ran-domness of the cut and therefore will improve the overall chances of detecting integrated vectors. Note that a mixture suggested in our recent review [21] was purely based on the combinatorial principle before the current analysis was done.
Use of 6-base restrictases
Whereas 4-base restrictases show frequencies of restric-tions in a range from 0.05 to 8 cuts per 1 kb, 6- base cutters are approximately 10 times less frequent (see data for chr1 in Additional file 1: Table S3 for details). Therefore their use must be justified after critical evaluation of the method of choice. General trends among 6-base cutters are similar to those found and described above for tetra-palindromes. AT-rich restric-tion sites are the most frequent, balanced 6-cutters do not exist. Instead AT- or GC- enriched palindromes show intermediate frequencies, and GC-rich sites are the least frequent along the genome. If two restrictases would be combined, the combinatorial rule still stands: AT-rich palindromes a best matching to GC-rich (as can be revealed by negative correlations). All other palin-dromes, however, behave less predictable (regarding com-binatorial rule) and more elaborate concepts should be developed. For practical purpose, if any selected combina-tions will be implemented, names of known 4- and 6-base restriction endonucleases and corresponding palindromes are provided in a Additional file 1: Table S4.
Discussion
Fragmentation of genomic DNA by restriction remains a routine element in modern genomic studies. Unfortu-nately, the selection of particular restriction enzymes for the application is often empirical and not subjected to any optimization or validation. An issue of prediction and distribution of nucleotide dimers, restriction sites and small words was previously discussed in the litera-ture. Originally prediction of restriction sites was based on a single-base probabilistic rule [22]. In the case of mi-crobial genomes, near to random distributions were sug-gested for restriction sites [19] or small words [23]. However, a bias in di-nucleotide frequencies [24] and genomic k-mers [25] were also documented in large ge-nomes. Therefore the assumption of randomness should be made carefully for analysis of short DNA sequences, including restriction sites. The concern that restriction with a particular enzyme or mixture of enzymes might substantially deviate from random did not spread far
outside the field of theoretical genome biology. For in-stance, in studies of genomic retro elements, restriction of DNA is performed with empirical combinations of 6-base restrictases [12,13], and no issue of randomness is addressed. Note that 6-base cutters show considerably lower frequencies compared to 4-cutters (see some exam-ples in [21]) and therefore inferior in frequencies to the ex-amples of combinations given in this paper. In fact use of 6-base cutters for fragmentation of large genomes should be theoretically justified, otherwise not recommended. In the field of population genetics, the problem of biased sampling and its possible drawbacks is already introduced [17]. In a recent publication it was anticipated that the performance of genome sequencing itself depends on representative and random fragmentation [26]. An issue of non-optimal fragment size is one of many problems recognized in chromosome conformation capture protocols [27,28]. Yet, in many of those publi-cations authors have used 1 or 2 empirically selected 6- or 4-base cutters to create genomic fragments. In similar studies [6,7] only a single 4-base restriction en-zyme was used for genome digestion. Van Tassel et al., [6] selected their 4-base cutter by computer analysis to minimize the appearance of repeated elements in their virtual fragments. This selection makes sense to im-prove efficiency of mapping. However, as was already mentioned here, a single cut strategy is always inferior to the combination of restrictases regarding its random-ness. Some genome restriction based protocols have already reached clinical studies, for instance gene therapy treated patients. In those studies, the problem of accessi-bility has been already identified and discussed [14,15]. However authors still focus their attention on an average restriction frequency without much consideration of the randomness. As a result, authors almost empirically sug-gested mixtures of enzymes with low to medium random-ness (examples are shown in Figure 7). Note that those few suggested combinations are further replicated in more recent clinical studies. To conclude, the problem of a proper fragmentation of genomic DNA and its verification for randomness remains an unexplored op-tion for further improvement. As it is demonstrated here, none of the restriction sites are fully random. However, some restrictases are more random than others. Combinations of restrictases presented in this paper provide the best random distribution across the mouse genome.
enzymes could improve the randomness of genomic restriction.
Although the combinatorial principles revealed might look puzzling and unexpected, the explanation is quite simple. The reason similar palindromes correlate is be-cause they correlate to the regions enriched in subse-quences which they contain. If they contain similar subsequences, for instance similar di-nucleotides, they will tend to be positively correlating. For the same rea-son, complementary di-nucleotides (AT vs GC, AA vs GG etc.) will tend to show negative correlation. This combinatorial rule is essentially based on Markov chains models, it is well reproducible in a different genomic context (see consistency of correlations across auto-somes), it is also resistant to SNP variations and other minor mutations in a population of considered species. In the case of balanced palindromes, this rule will be more problematic, because 4 bases cannot be enriched all at the same time: any enrichment also means loss of complementary bases or di-nucleotides. Consequently it will hamper enrichment of corresponding subsequences. Although the combinatorial principle was found to be useful as a guideline, some deviations from it were also evident. For instance, CG-containing palindromes tend to correlate with each other more than would be expected from similarity measurements. Mutually ex-clusive pairwise palindromes with relatively low fre-quency might co-occur in a bigger set of palindromes due to the dominating effect of more frequent and biased palindrome.
There can be many factors indirectly causing non-randomness of restriction sites along the genome. It might reflect an evolutionary expansion of DNA by self-duplication, selective pressure in coding regions and in CpG islands for CG- rich palindromes. Some evolution-ary pressure can be expected for ATAT and TATA se-quences due to their similarities to TATA boxes. It is, however, difficult to expect direct selective pressure on the distribution of restriction sites themselves (unless a clear functional demonstration of those sequences will be provided). Instead, an effect of local enrichment for sub-words, for instance di-nucleotides, presented in GC or AT rich palindromes is most likely. This selectivity of genomic landscape fundamentally breaks the principle of equal chance along the genome and this might be a pri-mary cause of deviation from the Poisson model. Analyt-ically, the Poisson model (see also Methods) can be adjusted to such situations, ifλ is the average frequency
of an event and k is the expected exact frequency, we
can considerλas being a function of k(equation can be found in the Methods). The notion that the genomic landscape is primarily responsible for non-randomness of restriction sites is an important example how genomic non-randomness in general can be interpreted beside
other existing explanations. As an example, Falconer et al. [30] found a wider distribution of segregating DNA template strands than predicted by a random distribu-tion (very similar to the case of non-randomness found in this paper). Such non-randomness was interpreted as selective process, disregarding the alternative option of having non-random (selective) genomic background for the fairly random process of template segregation. Those two options, not one, should be considered for further experimental verifications.
During preparation of our recent review [21] on a sub-ject of clonal analysis of hematopoietic cells, we briefly sug-gested the combinatorial principle of mixing restrictases for optimal genome fragmentation, which was hypothetical at that time. This paper provides the necessary background to this concept in sufficient detail and demonstrates how this principle helps in analysis and finding the best combi-nations of restrictases. Although mainly tetra-nucleotide palindromes were studied here, the strategy described can be applied to restrictases of any length.
Conclusions
Enzymatic restriction is a very frequent step in fragmen-tation of genomic DNA. A question of the randomness of restriction is often expected or implied, but rarely verified. A genome-wide restriction analysis of 4-base cutters revealed significant deviation from randomness for practically all tested restriction enzymes. The random-ness can be improved by combining separate restrictases in the mixture. A combinatorial approach is probably the simplest but most effective principle to achieve such improvement.
Methods
For the mouse genome, the Bioconductor (version 2.9) metadata package Bsgenome.Mmusculus.UCSC.mm10 for R version 2.15 was used which consists of the mmu10 as-sembly from UCSC (based on C57BL/6 J mouse strain). This package was used in conjunction with R (version 2.14.1) to scan the genome for the presence of all 16 pos-sible complement palindromes in non-overlapping bins of 1 kb in size. All bins with N < 500 were included in the resulting table. For each complement palindrome, fitness to the Poisson distribution per chromosome was calcu-lated using a custom Python script and Gnumeric spread-sheet (in Linux). For a random model, a Poisson distribution was used as following:
f kð ;λÞ ¼λke−λ=k!
Where λ is observed average, k is exact number of
Randomness of restriction was tested by comparing for observed and Poisson predicted data sets using the F-test as commonly described [27]. A p-value for the two-tailed hypothesis test comparing the variances of two popula-tions, in our case palindrome frequencies and Poisson dis-tribution, was calculated using the built in F-test function in the Gnumeric spreadsheet program. When used in the text, this is referred as an F-test P value or F-test P on the plot. Pearson correlation was calculated along the entire chromosome of choice using a custom script in python, using a double-pass strategy and the equation;
r¼∑ðXi−XÞðYi−YÞ=
ffiffiffiffiffiffiffiffiffiffiffiffiffiffiffiffiffiffiffiffi
∑ðXi−XÞ2
q ffiffiffiffiffiffiffiffiffiffiffiffiffiffiffiffiffiffiffiffi
∑ðYi−YÞ2
q
The probability of correlation was assessed using the t-test transformation.
t¼rpffiffiffiffiffiffiffiffiffiffiffiffiðn−2Þ=1−r2
and an online probability calculator http://www.
statstodo.com/TTest_Pgm.php.
Through the text all palindromes are mentioned by their DNA sequence. Names of the corresponding re-striction endonucleases are provided in the Additional file 1: Table S4.
Additional file
[image:12.595.303.537.107.732.2]Additional file 1: Table S1.Pearson correlation data for all tetra palindromes all mouse chromosomes.Table S2: Selection of all palindromic combinations using 3 different approaches.Table S3: Pearson correlation data for all tetra palindromes mouse chromosome 1.
Table S4: Commercial names for all 4- and 6- base restriction
endonucleases. Additional files. The Supplementary files S1, S2, S3, S4 are deposited in an open access repository https://easy.dans.knaw.nl/ui/ datasets/id/easy-dataset:53177. http://www.persistent-identifier.nl? identifier=urn:nbn:nl:ui:13-d9zq-rm.
Competing interests
Author declares no competing interests.
Acknowledgments
Author thank Erik Zwart for help in downloading of mouse genome and its virtual restriction, Rupert Overall for reading the manuscript and useful remarks. The project was partially supported by HEM-ID grant (http://www. hemid.eu) and NIRM grant (http://www.nirm.nl).
Received: 10 September 2012 Accepted: 16 July 2013 Published: 22 July 2013
References
1. Yegnasubramanian S, Lin X, Haffner MC, DeMarzo AM, Nelson WG: Combination of methylated-DNA precipitation and methylation-sensitive restriction enzymes (COMPARE-MS) for the rapid, sensitive and quantitative detection of DNA methylation.Nucleic Acids Res2006,34(3):e19.
2. Khulan B, Thompson RF, Ye K, Fazzari MJ, Suzuki M, Stasiek E, Figueroa ME, Glass JL, Chen Q, Montagna C, Hatchwell E, Selzer RR, Richmond TA, Green RD, Melnick A, Greally JM:Comparative isoschizomer profiling of cytosine methylation: the HELP assay.Genome Res2006,16(8):1046–55.
3. Kitamura E, Igarashi J, Morohashi A, Hida N, Oinuma T, Nemoto N, Song F, Ghosh S, Held WA, Yoshida-Noro C, Nagase H:Analysis of tissue-specific differentially methylated regions (TDMs) in humans.Genomics2007, 89(3):326–37.
4. Aviv A, Hunt SC, Lin J, Cao X, Kimura M, Blackburn E:Impartial comparative analysis of measurement of leukocyte telomere length/DNA content by Southern blots and qPCR.Nucleic Acids Res2011,39(20):e134.
5. Baird NA, Etter PD, Atwood TS, Currey MC, Shiver AL, Lewis ZA, Selker EU, Cresko WA, Johnson EA:Rapid SNP discovery and genetic mapping using sequenced RAD markers.PLoS One2008,3(10):e3376.
6. Van Tassell CP, Smith TP, Matukumalli LK, Taylor JF, Schnabel RD, Lawley CT, Haudenschild CD, Moore SS, Warren WC, Sonstegard TS:SNP discovery and allele frequency estimation by deep sequencing of reduced
representation libraries.Nat Methods2008,5(3):247–52.
7. Luca F, Hudson RR, Witonsky DB, Di Rienzo A:A reduced representation approach to population genetic analyses and applications to human evolution.Genome Res2011,21(7):1087–98.
8. Monson-Miller J, Sanchez-Mendez DC, Fass J, Henry IM, Tai TH, Comai L: Reference genome-independent assessment of mutation density using restriction enzyme-phased sequencing.BMC Genomics2012,13:72. 9. Miller MR, Dunham JP, Amores A, Cresko WA, Johnson EA:Rapid and
cost-effective polymorphism identification and genotyping using restriction site associated DNA (RAD) markers.Genome Res2007,17(2):240–8. 10. Ishihara H, Tanaka I:Detection and cloning of unique integration sites of
retrotransposon, intracisternal A-particle element in the genome of acute myeloid leukemia cells in mice.FEBS Lett1997,418(1–2):205–9. 11. Ribet D, Dewannieux M, Heidmann T:An active murine transposon family
pair: retrotransposition of "master" MusD copies and ETn trans-mobilization.Genome Res2004,14(11):2261–7.
12. Takabatake T, Ishihara H, Ohmachi Y, Tanaka I, Nakamura MM, Fujikawa K, Hirouchi T, Kakinuma S, Shimada Y, Oghiso Y, Tanaka K:Microarray-based global mapping of integration sites for the retrotransposon, intracisternal A-particle, in the mouse genome.Nucleic Acids Res2008, 36(10):e59.
13. An W, Davis ES, Thompson TL, O'Donnell KA, Lee CY, Boeke JD:Plug and play modular strategies for synthetic retrotransposons.Methods2009, 49(3):227–35.
14. Harkey MA, Kaul R, Jacobs MA, Kurre P, Bovee D, Levy R, Blau CA:Multiarm high-throughput integration site detection: limitations of LAM-PCR technology and optimization for clonal analysis.Stem Cells Dev2007, 16(3):381–92.
15. Gabriel R, Eckenberg R, Paruzynski A, Bartholomae CC, Nowrouzi A, Arens A, Howe SJ, Recchia A, Cattoglio C, Wang W, Faber K, Schwarzwaelder K, Kirsten R, Deichmann A, Ball CR, Balaggan KS, Yáñez-Muñoz RJ, Ali RR, Gaspar HB, Biasco L, Aiuti A, Cesana D, Montini E, Naldini L, Cohen-Haguenauer O, Mavilio F, Thrasher AJ, Glimm H, Von Kalle C, Saurin W, Schmidt M:Comprehensive genomic access to vector integration in clinical gene therapy.Nat Med2009,15(12):1431–6.
16. Wang GP, Berry CC, Malani N, Leboulch P, Fischer A, Hacein-Bey-Abina S, Cavazzana-Calvo M, Bushman FD:Dynamics of gene-modified progenitor cells analyzed by tracking retroviral integration sites in a human SCID-X1 gene therapy trial.Blood2010,115(22):4356–66.
17. Pérez-Enciso M, Ferretti L:Massive parallel sequencing in animal genetics: wherefroms and wheretos.Anim Genet2010,41(6):561–9.
18. Schmidt M, Glimm H, Lemke N, Muessig A, Speckmann C, Haas S, Zickler P, Hoffmann G, Von Kalle C:A model for the detection of clonality in marked hematopoietic stem cells.Ann N Y Acad Sci2001,938:146–55. 19. Churchill GA, Daniels DL, Waterman MS:The distribution of restriction enzyme sites in Escherichia coli.Nucleic Acids Res1990,18(3):589–97. 20. Biasco L, Ambrosi A, Pellin D, Bartholomae C, Brigida I, Roncarolo MG, Di
Serio C, Von Kalle C, Schmidt M, Aiuti A:Integration profile of retroviral vector in gene therapy treated patients is cell-specific according to gene expression and chromatin conformation of target cell.EMBO Mol Med2011, 3(2):89–101.
21. Bystrykh LV, Verovskaya E, Zwart E, Broekhuis M, De Haan G:Counting stem cells: methodological constraints.Nat Methods2012,9(6):567–74. 22. Wijsman EM:Optimizing selection of restriction enzymes in the search
for DNA variants.Nucleic Acids Res1984,12(23):9209–26.
23. Fofanov Y, Luo Y, Katili C, Wang J, Belosludtsev Y, Powdrill T, Belapurkar C, Fofanov V, Li TB, Chumakov S, Pettitt BM:How independent are the appearances of n-mers in different genomes?Bioinformatics2004,20(15):2421–8. 24. Karlin S, Mrázek J:Compositional differences within and between
eukaryotic genomes.Proc Natl Acad Sci USA1997,94(19):10227–32. 25. Chor B, Horn D, Goldman N, Levy Y, Massingham T:Genomic DNA k-mer
26. Young AL, Abaan HO, Zerbino D, Mullikin JC, Birney E, Margulies EH:A new strategy for genome assembly using short sequence reads and reduced representation libraries.Genome Res2010,20(2):249–56.
27. Dekker J:The three‘C’s of chromosome conformation capture: controls, controls, controls.Nat Methods2006,3(1):17–21.
28. Cournac A, Marie-Nelly H, Marbouty M, Koszul R, Mozziconacci J: Normalizatio An issue of not optimal fragment An issue of not optimal fragment n of a chromosomal contact map.BMC Genomics2012,13:436. 29. Altman DG:Practical statistics for medical research.Boca Raton: Chapman &
Hall/CRC; 1999.
30. Falconer E, Chavez EA, Henderson A, Poon SS, McKinney S, Brown L, Huntsman DG, Lansdorp PM:Identification of sister chromatids by DNA template strand sequences.Nature2010,463(7277):93–7.
doi:10.1186/1756-0500-6-284
Cite this article as:Bystrykh:A combinatorial approach to the restriction
of a mouse genome.BMC Research Notes20136:284.
Submit your next manuscript to BioMed Central and take full advantage of:
• Convenient online submission
• Thorough peer review
• No space constraints or color figure charges
• Immediate publication on acceptance
• Inclusion in PubMed, CAS, Scopus and Google Scholar
• Research which is freely available for redistribution