R E S E A R C H A R T I C L E
Open Access
Exploring variation in low-value care: a
multilevel modelling study
Tim Badgery-Parker
1*, Yingyu Feng
1, Sallie-Anne Pearson
2, Jean-Frederic Levesque
3, Susan Dunn
4and
Adam G. Elshaug
1Abstract
Background:Whether patients receive low-value hospital care (care that is not expected to provide a net benefit) may be influenced by unmeasured factors at the hospital they attend or the hospital’s Local Health District (LHD), or the patients’areas of residence. Multilevel modelling presents a method to examine the effects of these different levels simultaneously and assess their relative importance to the outcome. Knowing which of these levels has the greatest contextual effects can help target further investigation or initiatives to reduce low-value care.
Methods:We conducted multilevel logistic regression modelling for nine low-value hospital procedures. We fit a series of six models for each procedure. The baseline model included only episode-level variables with no multilevel structure. We then added each level (hospital, LHD, Statistical Local Area [SLA] of residence) separately and used the change in thecstatistic from the baseline model as a measure of the contribution of the level to the outcome. We then examined the variance partition coefficients (VPCs) and median odds ratios for a model
including all three levels. Finally, we added level-specific covariates to examine if they were associated with the outcome.
Results:Analysis of thecstatistics showed that hospital was more important than LHD or SLA in explaining whether patients receive low-value care. The greatest increases were 0.16 for endoscopy for dyspepsia, 0.13 for colonoscopy for constipation, and 0.14 for sentinel lymph node biopsy for early melanoma. SLA gave a small increase inccompared with the baseline model, but no increase over the model with hospital. The VPCs indicated that hospital accounted for most of the variation not explained by the episode-level variables, reaching 36.8% (95% CI, 31.9–39.0) for knee arthroscopy. ERCP (8.5%; 95% CI, 3.9–14.7) and EVAR (7.8%; 95% CI, 2.9–15.8) had the lowest residual variation at the hospital level. The variables at the hospital, LHD and SLA levels that were available for this study generally showed no significant effect.
Conclusions:Investigations into the causes of low-value care and initiatives to reduce low-value care might best be targeted at the hospital level, as the high variation at this level suggests the greatest potential to reduce low-value care.
Keywords:Low-value care, Multilevel logistic regression, Choosing wisely, Disinvestment
© The Author(s). 2019Open AccessThis article is distributed under the terms of the Creative Commons Attribution 4.0 International License (http://creativecommons.org/licenses/by/4.0/), which permits unrestricted use, distribution, and reproduction in any medium, provided you give appropriate credit to the original author(s) and the source, provide a link to the Creative Commons license, and indicate if changes were made. The Creative Commons Public Domain Dedication waiver (http://creativecommons.org/publicdomain/zero/1.0/) applies to the data made available in this article, unless otherwise stated.
* Correspondence:[email protected]
1Faculty of Medicine and Health, School of Public Health, Menzies Centre for
Health Policy, Charles Perkins Centre, The University of Sydney, Level 2, Charles Perkins Centre D17, Sydney, NSW 2006, Australia
Background
Knowing where low-value care (tests and interventions for which the benefit is not expected to outweigh the harm and/or costs [1]) occurs and factors associated with low-value care is important in planning to reduce low -value care. Factors at various levels can affect whether a patient receives low-value care. For example, hospitals vary in their rates of low-value care [2,3], so the risk of a patient receiving low-value care may be affected by which hospital they attend. In New South Wales (NSW, the most populous state of Australia), hospitals belong to Local Health Districts (LHDs), which govern funding and can make policy for all hospitals in the LHD. Thus, the LHD in which a patient is treated could influence the care re-ceived. Geographic variation analysis has shown that rates of selected services vary by patients’area of residence [4], and rates of low-value care might also show such geo-graphic variation. Furthermore, whether patients receive appropriate care for lung cancer depends on the distance from the patient’s residence to a specialist hospital [5], and it is similarly possible that whether patients receive low-value care depends on where they live. Understanding the relative importance of hospital, LHD, and area of resi-dence will be useful for guiding programs to reduce low-value care. This information might also provide indir-ect information about possible pathways that lead to low-value care. For example, variation between hospitals may reflect the treatment preferences of surgeons who operate in the different hospitals, whereas variation be-tween areas of residence may reflect the decisions of gen-eral practitioners (GPs) and their referral pathways (in Australia GPs are ‘gate-keepers’ who must refer patients to specialists, including surgeons).
Multilevel modelling presents a statistical method that can model the effects of different levels simultaneously [6, 7]. Such models can estimate the variation between units at different levels (e.g. hospital, LHD, area of resi-dence) and partition the total unexplained variation to the different levels, reflecting their relative importance to the outcome variable. To date, this method has not been used to examine low-value care. Variation in rates of low-value care between hospitals has been reported in Canada [2] and Australia [3], and geographic variation across hospital referral regions has been examined in the United States [8], but no analysis to date has considered all these levels simultaneously to reveal their relative importance.
We have developed measures for low-value inpatient procedures in public hospitals based on administrative data [3,9]. In this study, we used multilevel modelling for nine of these measures to explore the contributions of hospital, LHD of hospital, and Statistical Local Area (SLA) of patient’s residence in explaining variation in rates of low-value care.
Methods Setting and data
NSW is the most populous state of Australia. Inpatient care is provided at 225 public hospitals in 15 LHDs. We used public hospital admitted patient data from the NSW Health Information Exchange data warehouse for the period 1 July 2010 to 30 June 2017. The data include pa-tient demographic information (e.g. age, sex, area of resi-dence), clinical information (e.g. procedures performed and diagnoses assigned), and administrative information (e.g. private or public patient, emergency or elective care) for every inpatient episode at a public hospital in NSW. The data is organised into hospital‘stays’which comprise one or more‘episodes’. An episode ends when the type of care changes (e.g. from acute to rehabilitation) or the pa-tient is transferred or discharged.
We used the Australian Bureau of Statistics Statistical Local Areas (2011) to define the patients’ areas of resi-dence [10]. In NSW, there are 199 SLAs, with estimated residential populations ranging from about 400 to about 155,000 (median, approximately 23,000).
We downloaded Index of Relative Socioeconomic Ad-vantage and DisadAd-vantage (IRSAD) [11], Remoteness Categories [12], and Estimated Residential Populations from the Australian Bureau of Statistics [13].
Analysis
We used multilevel logistic regression analysis to explore the contribution of hospital and LHD of treatment, and SLA of residence to variation in nine low-value procedures used in adults in NSW (Table1). The low-value procedures were selected from Choosing Wisely, RACP EVOLVE, and National Institute of Health and Care Excellence (NICE)
‘do not do’recommendations as described previously [3,9]. We analysed each of the procedures separately, as they cover a range of conditions, medical specialties, and popu-lations, and there is no reason to expect effects would be the same across the low-value procedures.
For each of the procedures, denominator cohorts com-prised all patients in NSW public hospitals that provide the procedure and for whom the procedure would be low value according to our definitions. The binary out-come variable was whether the procedure was provided. We developed both narrower and broader definitions of low-value care to account for uncertainty in whether episodes are truly low value [3]. Here, we present results for the narrower definitions; results for the broader defi-nitions lead to similar conclusions.
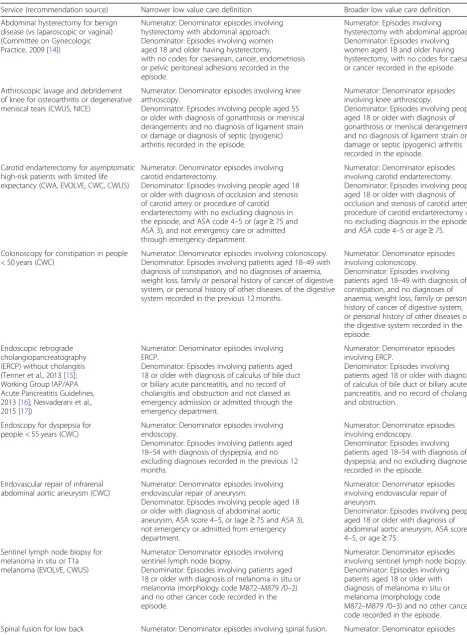
Table 1Definitions of the nine low value services
Service (recommendation source) Narrower low value care definition Broader low value care definition
Abdominal hysterectomy for benign disease (vs laparoscopic or vaginal) (Committee on Gynecologic Practice, 2009 [14])
Numerator: Denominator episodes involving hysterectomy with abdominal approach. Denominator: Episodes involving women aged 18 and older having hysterectomy,
with no codes for caesarean, cancer, endometriosis or pelvic peritoneal adhesions recorded in the episode.
Numerator: Episodes involving hysterectomy with abdominal approach. Denominator: Episodes involving women aged 18 and older having hysterectomy, with no codes for caesarean or cancer recorded in the episode.
Arthroscopic lavage and debridement of knee for osteoarthritis or degenerative meniscal tears (CWUS, NICE)
Numerator: Denominator episodes involving knee arthroscopy.
Denominator: Episodes involving people aged 55 or older with diagnosis of gonarthrosis or meniscal derangements and no diagnosis of ligament strain or damage or diagnosis of septic (pyogenic) arthritis recorded in the episode.
Numerator: Denominator episodes involving knee arthroscopy.
Denominator: Episodes involving people aged 18 or older with diagnosis of gonarthrosis or meniscal derangements and no diagnosis of ligament strain or damage or septic (pyogenic) arthritis recorded in the episode.
Carotid endarterectomy for asymptomatic high-risk patients with limited life expectancy (CWA, EVOLVE, CWC, CWUS)
Numerator: Denominator episodes involving carotid endarterectomy.
Denominator: Episodes involving people aged 18 or older with diagnosis of occlusion and stenosis of carotid artery or procedure of carotid endarterectomy with no excluding diagnosis in the episode, and ASA code 4–5 or (age≥75 and ASA 3), and not emergency care or admitted through emergency department.
Numerator: Denominator episodes involving carotid endarterectomy. Denominator: Episodes involving people aged 18 or older with diagnosis of occlusion and stenosis of carotid artery or procedure of carotid endarterectomy with no excluding diagnosis in the episode, and ASA code 4–5 or age≥75.
Colonoscopy for constipation in people < 50 years (CWC)
Numerator: Denominator episodes involving colonoscopy. Denominator: Episodes involving patients aged 18–49 with diagnosis of constipation, and no diagnoses of anaemia, weight loss, family or personal history of cancer of digestive system, or personal history of other diseases of the digestive system recorded in the previous 12 months.
Numerator: Denominator episodes involving colonoscopy.
Denominator: Episodes involving patients aged 18–49 with diagnosis of constipation, and no diagnoses of anaemia, weight loss, family or personal history of cancer of digestive system, or personal history of other diseases of the digestive system recorded in the episode.
Endoscopic retrograde cholangiopancreatography (ERCP) without cholangitis (Tenner et al., 2013 [15]; Working Group IAP/APA Acute Pancreatitis Guidelines, 2013 [16]; Nesvaderani et al., 2015 [17])
Numerator: Denominator episodes involving ERCP.
Denominator: Episodes involving patients aged 18 or older with diagnosis of calculus of bile duct or biliary acute pancreatitis, and no record of cholangitis and obstruction and not classed as emergency admission or admitted through the emergency department.
Numerator: Denominator episodes involving ERCP.
Denominator: Episodes involving patients aged 18 or older with diagnosis of calculus of bile duct or biliary acute pancreatitis, and no record of cholangitis and obstruction.
Endoscopy for dyspepsia for people < 55 years (CWC)
Numerator: Denominator episodes involving endoscopy.
Denominator: Episodes involving patients aged 18–54 with diagnosis of dyspepsia, and no excluding diagnoses recorded in the previous 12 months.
Numerator: Denominator episodes involving endoscopy.
Denominator: Episodes involving patients aged 18–54 with diagnosis of dyspepsia, and no excluding diagnoses recorded in the episode.
Endovascular repair of infrarenal abdominal aortic aneurysm (CWC)
Numerator: Denominator episodes involving endovascular repair of aneurysm.
Denominator: Episodes involving people aged 18 or older with diagnosis of abdominal aortic aneurysm, ASA score 4–5, or (age≥75 and ASA 3), not emergency or admitted from emergency department.
Numerator: Denominator episodes involving endovascular repair of aneurysm.
Denominator: Episodes involving people aged 18 or older with diagnosis of abdominal aortic aneurysm, ASA score 4–5, or age≥75.
Sentinel lymph node biopsy for melanoma in situ or T1a melanoma (EVOLVE, CWUS)
Numerator: Denominator episodes involving sentinel lymph node biopsy.
Denominator: Episodes involving patients aged 18 or older with diagnosis of melanoma in situ or melanoma (morphology code M872–M879 /0–2) and no other cancer code recorded in the episode.
Numerator: Denominator episodes involving sentinel lymph node biopsy. Denominator: Episodes involving patients aged 18 or older with diagnosis of melanoma in situ or melanoma (morphology code M872–M879 /0–3) and no other cancer code recorded in the episode.
treated in different hospitals and LHDs. Although it was possible for patients to have multiple episodes recorded in the data, less than 10% of records involved repeated admissions of the same patient. Furthermore, there was very little variation at the patient level and including this level led to problems with model convergence. There-fore, the models did not account for multiple episodes involving the same patient. Two procedures (spinal fusion and endovascular repair of abdominal aortic aneurysm [EVAR]) occurred at only one hospital in each LHD. In these cases, it is not reasonable to try to separate variation into the LHD or hospital contribution, so LHD was not included in the models for these two procedures.
For each procedure, we fit a series of models to examine the relative contributions of each level in explaining the rates of low-value care (Table 2) [18]. Model 1 included only variables at the episode level with no higher levels. This provided a baseline for assessing the contribution of hospital, LHD, and SLA. Models 2–4 separately added
hospital, LHD, or SLA to Model 1, and Model 5 included all levels. These models were intended to explore the rela-tive contributions of the different levels to explaining whether patients received low-value care. Finally, in Model 6 we added specific hospital-, LHD-, and SLA-level vari-ables (Box 1) to Model 5, to assess whether any of these available variables explained the effect of hospital, LHD, or SLA. For the analysis, continuous variables were centred at the mean value for the cohort. There were no missing data for any of the variables used in the analysis.
We first compared Models 2–4 with Model 1 using thecstatistic (equivalent to the area under the receiver– operator characteristic curve) [18,19]. Thecstatistic is a measure of how well a model predicts which patients re-ceive low-value care, and can range from 0.5 (indicating the model has no predictive skill) to 1 (indicating the model perfectly predicts which patients receive low-value care). For Models 2–4, the increase in c statistic from Model 1 is a measure of the additional information on whether an episode was low value provided by know-ing the hospital, LHD, or SLA. The greater the change, the more important is knowing the hospital, LHD, or SLA for predicting if a patient did or did not receive the procedure. The increase in c statistic from Models 2–4 to Model 5 was also examined to assess the additional value of including all three levels.
We next assessed the relative contributions of the dif-ferent levels in Model 5 using the variance partition co-efficient (VPC) and the median odds ratio (MOR) [19]. The VPC is the percentage of residual variation attribut-able to a specific level. We calculated the VPC using the latent response approach, setting the level 1 variance to π2
[image:4.595.57.539.97.181.2]/3 [19, 20]. The higher the VPC, the greater the con-tribution of the level to the variation in the latent re-sponse at the individual level. The MOR converts the level variation to the odds ratio scale, allowing direct comparison with the odds ratios for other variables. The hospital MOR can be interpreted as the average increase in odds of receiving low-value care if a patient went to a different hospital (in the same LHD and while living in the same area) with higher low-value care rate. Similarly, the SLA MOR is the average increase in odds if a patient (attending the same hospital in the same LHD) lived in a different SLA with higher rate of low-value care. As it is Table 1Definitions of the nine low value services(Continued)
Service (recommendation source) Narrower low value care definition Broader low value care definition
pain (CWC) Denominator: Episodes involving patients aged
18 or older with diagnosis of low back pain with no mention of sciatica, spondylolisthesis or spinal deformity, or pain in legs recorded in the previous 12 months.
involving spinal fusion. Denominator: Episodes involving patients aged 18 or older with diagnosis of low back pain or spinal stenosis with no mention of sciatica, spondylolisthesis or spinal deformity, or pain in legs recorded in the episode.
Adapted from Badgery-Parker et al. (2018) Additional file2: Table S1 [3].
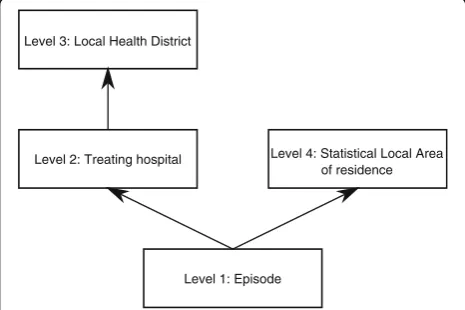
Level 1: Episode Level 3: Local Health District
Level 2: Treating hospital Level 4: Statistical Local Area of residence
[image:4.595.57.290.449.604.2]not possible for a patient to attend the same hospital in a different LHD, we present the MOR for LHD + hos-pital, which indicates the average increase in odds if a patient went to a different hospital in a different LHD (while living in the same SLA).
Finally, for Model 6 we examined the effects of hos-pital, LHD, and SLA covariates. While the earlier models assessed if the different levels are important in explain-ing low-value care, Model 6 sought to identify variables through which the level effect occurs. We assessed the variables using the 80% interval odds ratio (IOR80) [19]. The IOR80 is required because, although the odds ratios
[image:5.595.59.538.100.521.2]are conditional on the hospital, LHD, and SLA in these multilevel models, the covariates are constant within any unit to which they apply (e.g. it is not possible to change from a peer group A1 hospital to a peer group B hospital while remaining at the same hospital). The IOR80 covers the middle 80% of odds ratios that would be observed when changing from one value of a level-specific covari-ate to another, accounting for the required change in the hospital, LHD, or SLA. When the IOR80 includes the value 1, the interval is “wide” and indicates that the co-variate effect is minor compared with the residual vari-ation at that model level [21].
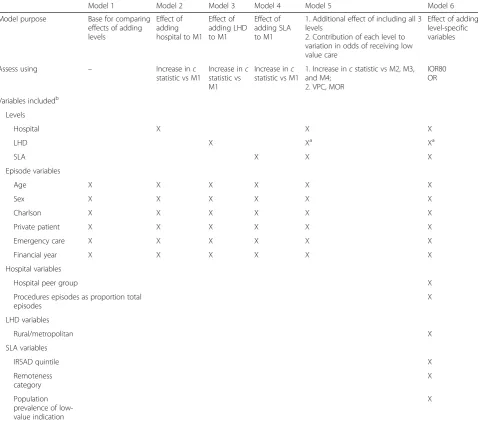
Table 2The six models fit for each procedure
Model 1 Model 2 Model 3 Model 4 Model 5 Model 6
Model purpose Base for comparing
effects of adding levels
Effect of adding hospital to M1
Effect of adding LHD to M1
Effect of adding SLA to M1
1. Additional effect of including all 3 levels
2. Contribution of each level to variation in odds of receiving low value care
Effect of adding level-specific variables
Assess using – Increase inc
statistic vs M1
Increase inc statistic vs M1
Increase inc statistic vs M1
1. Increase incstatistic vs M2, M3, and M4;
2. VPC, MOR
IOR80 OR
Variables includedb
Levels
Hospital X X X
LHD X Xa Xa
SLA X X X
Episode variables
Age X X X X X X
Sex X X X X X X
Charlson X X X X X X
Private patient X X X X X X
Emergency care X X X X X X
Financial year X X X X X X
Hospital variables
Hospital peer group X
Procedures episodes as proportion total episodes
X
LHD variables
Rural/metropolitan X
SLA variables
IRSAD quintile X
Remoteness category
X
Population prevalence of low-value indication
X
a
LHD was not included in Models 5 and 6 for spinal fusion and EVAR because each LHD had only one hospital that performed the procedure.b
Additional file1
contains more details about the variables
Software
We fit the models using RStan, accessed through the brms package in R 3.4.0, with weakly informative priors for the covariate parameters and brms default priors for the variance components.
Ethics
This study was approved by the New South Wales Popula-tion and Health Services Research Ethics Committee.
Results
Additional file 2 summarises the cohorts for the nine services. Sample sizes ranged from 1181 episodes for EVAR to 58,459 episodes for knee arthroscopy (Additional file 2: Table S1A).
Here we present results using our narrower defini-tions of low-value care. Additional file 3 includes re-sults for the broader definitions, which lead to similar conclusions.
Magnitude of level effects
For knee arthroscopy, ERCP, and spinal fusion, Model 1 (no multilevel structure) had a c statistic of ≥0.7, con-ventionally taken to indicate acceptable discrimination (Table 3) [22]. The other procedures all had c statistics between 0.6 and 0.7 for Model 1.
[image:6.595.60.538.348.715.2]Comparing Model 1 with Models 2–4 shows that add-ing information on the hospital provides a greater im-provement to the model than adding LHD (without hospital) or SLA (Table 3; Fig.2). That is, knowing the hospital improves prediction of whether a patient re-ceives low-value care more than knowing the LHD or SLA. The increase in c statistic when adding hospital was greatest for endoscopy, colonoscopy, and sentinel lymph node biopsy. Models 3 and 4 show that LHD and SLA provide some information beyond the episode vari-ables, but the increase incstatistic was smaller than for Model 2 (hospital). Model 5 shows that including all three levels provides no improvement in discrimination compared with just including hospital, except for spinal
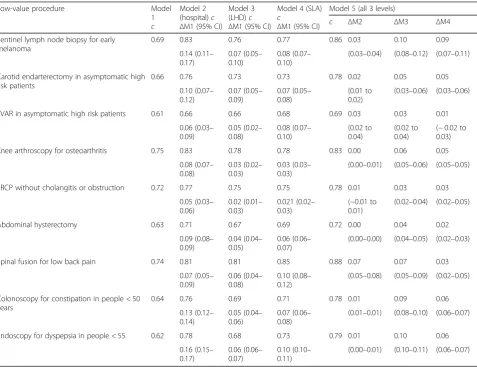
Table 3cstatistics for Models 1 to 5, and change between models
Low-value procedure Model
1 c
Model 2 (hospital)c
ΔM1 (95% CI) Model 3 (LHD)c
ΔM1 (95% CI)
Model 4 (SLA) c
ΔM1 (95% CI)
Model 5 (all 3 levels)
c ΔM2 ΔM3 ΔM4
Sentinel lymph node biopsy for early melanoma
0.69 0.83 0.76 0.77 0.86 0.03 0.10 0.09
0.14 (0.11– 0.17)
0.07 (0.05– 0.10)
0.08 (0.07– 0.10)
(0.03–0.04) (0.08–0.12) (0.07–0.11)
Carotid endarterectomy in asymptomatic high risk patients
0.66 0.76 0.73 0.73 0.78 0.02 0.05 0.05
0.10 (0.07– 0.12)
0.07 (0.05– 0.09)
0.07 (0.05– 0.08)
(0.01 to 0.02)
(0.03–0.06) (0.03–0.06)
EVAR in asymptomatic high risk patients 0.61 0.66 0.66 0.68 0.69 0.03 0.03 0.01
0.06 (0.03– 0.09)
0.05 (0.02– 0.08)
0.08 (0.07– 0.10)
(0.02 to 0.04)
(0.02 to 0.04)
(−0.02 to 0.03)
Knee arthroscopy for osteoarthritis 0.75 0.83 0.78 0.78 0.83 0.00 0.06 0.05
0.08 (0.07– 0.08)
0.03 (0.02– 0.03)
0.03 (0.03– 0.03)
(0.00–0.01) (0.05–0.06) (0.05–0.05)
ERCP without cholangitis or obstruction 0.72 0.77 0.75 0.75 0.78 0.01 0.03 0.03
0.05 (0.03– 0.06)
0.02 (0.01– 0.03)
0.021 (0.02– 0.03)
(−0.01 to 0.01)
(0.02–0.04) (0.02–0.05)
Abdominal hysterectomy 0.63 0.71 0.67 0.69 0.72 0.00 0.04 0.02
0.09 (0.08– 0.09)
0.04 (0.04– 0.05)
0.06 (0.06– 0.07)
(0.00–0.00) (0.04–0.05) (0.02–0.03)
Spinal fusion for low back pain 0.74 0.81 0.81 0.85 0.88 0.07 0.07 0.03
0.07 (0.05– 0.09)
0.06 (0.04– 0.08)
0.10 (0.08– 0.12)
(0.05–0.08) (0.05–0.09) (0.02–0.05)
Colonoscopy for constipation in people < 50 years
0.64 0.76 0.69 0.71 0.78 0.01 0.09 0.06
0.13 (0.12– 0.14)
0.05 (0.04– 0.06)
0.07 (0.06– 0.08)
(0.01–0.01) (0.08–0.10) (0.06–0.07)
Endoscopy for dyspepsia in people < 55 0.62 0.78 0.68 0.73 0.79 0.01 0.10 0.06
0.16 (0.15– 0.17)
0.06 (0.06– 0.07)
0.10 (0.10– 0.11)
(0.00–0.01) (0.10–0.11) (0.06–0.07)
fusion, where including SLA provides a small additional increase inccompared with including only hospital.
Overall, these results indicate that each level provides information about whether patients will receive low-value care, but the hospital level is the most useful.
Relative importance of the levels
The VPCs from Model 5 for each procedure show that most of the residual variation after including the available episode-level variables is at the hospital level (Fig. 3; Table4). EVAR had the lowest residual variation at the hos-pital level (7.8%; 95% CI, 2.9–15.8). The LHD accounted for more residual variation than the SLA for most procedures, although the VPCs for LHD and SLA were small and the uncertainty in the estimates was high (Table4).
For knee arthroscopy, the hospital, LHD, and SLA to-gether accounted for 47.7% of the variation. At the other extreme, for EVAR these levels accounted for only 9.4% of the residual variation, and for ERCP, only 12.2% of the residual variation (Fig.3).
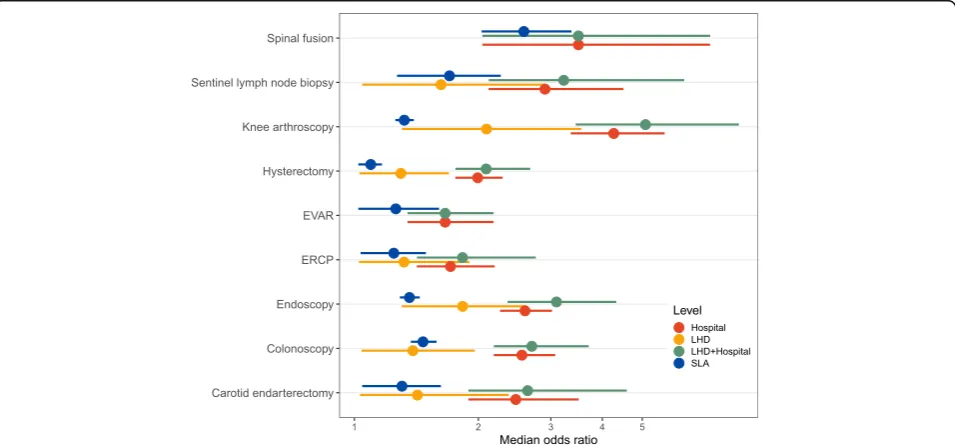
For knee arthroscopy, the hospital MOR was 4.3 (95% CI, 3.3–5.7), indicating that the odds of a patient for whom the procedure is low value actually receiving the procedure would be 4.3 times higher on average if the pa-tient attended a different hospital in the same LHD with a higher low-value rate (Table4; Fig.4). Hospital MORs for the other services were generally lower (most < 2.5). The MORs for SLA were between 1 and 2 for most proce-dures, but reached 2.6 (95% CI, 2.0–3.4) for spinal fusion.
Level-specific variables
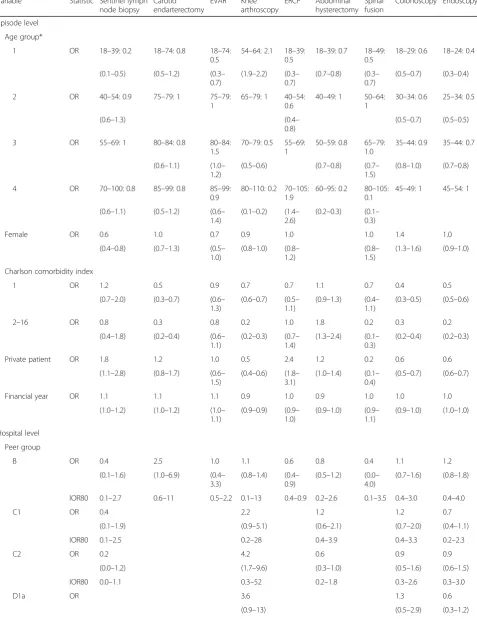
Patient age was associated with use of low-value care for all the procedures in Model 6, with the specific patterns depending on the service (Table 5). Higher Charlson co-morbidity score was associated with lower odds of
EVAR Knee arthroscopy Sentinel lymph node biopsy
Hysterectomy Spinal fusion Carotid endarterectomy
Colonoscopy Endoscopy ERCP
0.00 0.25 0.50 0.75 1.00 0.00 0.25 0.50 0.75 1.00 0.00 0.25 0.50 0.75 1.00
0.00 0.25 0.50 0.75 1.00
0.00 0.25 0.50 0.75 1.00
0.00 0.25 0.50 0.75 1.00
1 − Specificity
Sensitivity
base model base + hospital base + LHD base + SLA all levels
Fig. 2ROC curves for Models 1–5 for each service. ERCP, endoscopic retrograde cholangiopancreatography. EVAR, endovascular repair of abdominal aortic aneurysm. LHD, Local Health District. SLA, Statistical Local Area
EVAR ERCP Abdominal hysterectomy Carotid endarterectomy Colonoscopy Endoscopy Sentinel lymph node biopsy Spinal fusion Knee arthroscopy
0% 10% 20% 30% 40% 50% 60%
Variance partition coefficients Statistical Local Area Local Health District Hospital
[image:7.595.55.540.88.340.2] [image:7.595.306.538.461.624.2]Table 4Variance parameters for Model 5 for each of the nine procedures
Parameter Sentinel lymph node biopsy for early melanoma
Carotid endarterectomy in asymptomatic high risk patients
EVAR in asymptomatic high risk patients
Knee arthroscopy for osteoarthritis
ERCP without cholangitis or obstruction
Abdominal hysterectomy
Spinal fusion for low back pain
Colonoscopy for constipation in people < 50
Endoscopy for dyspepsia for people < 55
Hospital level
Variance 1.2 (0.6–2.5) 0.9 (0.4–1.7) 0.3 (0.1–0.7) 2.3 (1.6–3.3) 0.3 (0.1–0.7) 0.5 (0.3–0.8) 1.7 (0.6– 4.3)
1.0 (0.7–1.4) 1.0 (0.7–1.3)
VPC 24.4 (15.6– 32.1)
20.3 (11.9–28.4) 7.8 (2.9–15.8) 36.8 (31.9– 39.0)
8.5 (3.9– 14.7)
13.4 (9.6– 17.3)
28.7 (12.8– 47.0)
21.3 (16.4– 25.6)
20.9 (17.5– 23.2)
MOR 2.9 (2.1–4.5) 2.5 (1.9–3.5) 1.7 (1.3–2.2) 4.3 (3.3–5.7) 1.7 (1.4–2.2) 2.0 (1.8–2.3) 3.5 (2.0– 7.3)
2.6 (2.2–3.1) 2.6 (2.3–3.0)
LHD level
Variance 0.3 (0.0–1.2) 0.1 (0.0–0.8) 0.6 (0.1–1.8) 0.1 (0.0–0.5) 0.1 (0.0–0.3) 0.1 (0.0–0.5) 0.4 (0.1–1.0)
VPC 5.0 (0.1–16.1) 3.1 (0.0–13.4) 9.5 (1.5–
20.8)
2.3 (0.0–9.9) 1.9 (0.0–7.0) 2.6 (0.0–9.2) 8.4 (1.8– 17.5)
MOR 1.6 (1.0–2.9) 1.4 (1.0–2.4) 2.1 (1.3–3.6) 1.3 (1.0–1.9) 1.3 (1.0–1.7) 1.4 (1.0–2.0) 1.8 (1.4–2.6)
MOR (LHD + hospital)
3.2 (2.1–6.3) 2.6 (1.9–4.6) 1.7 (1.3–2.2) 5.1 (3.4–8.6) 1.8 (1.4–2.8) 2.1 (1.8–2.7) 3.5 (2.0– 7.3)
2.7 (2.2–3.7) 3.1 (2.4–4.3)
SLA level
Variance 0.3 (0.1–0.7) 0.1 (0.0–0.3) 0.1 (0.0–0.2) 0.1 (0.1–0.1) 0.1 (0.0–0.2) 0.0 (0.0–0.0) 1.0 (0.6– 1.6)
0.2 (0.1–0.2) 0.1 (0.1–0.1)
VPC 6.1 (1.6–9.5) 1.8 (0.1–4.2) 1.6 (0.0–5.9) 1.4 (1.1–1.4) 1.4 (0.0–3.8) 0.2 (0.0–0.6) 16.4 (12.6– 17.5)
3.6 (2.7–4.3) 2.2 (1.7–2.5)
MOR 1.7 (1.3–2.3) 1.3 (1.0–1.6) 1.3 (1.0–1.6) 1.3 (1.3–1.4) 1.2 (1.0–1.5) 1.1 (1.0–1.2) 2.6 (2.0– 3.4)
1.5 (1.4–1.6) 1.4 (1.3–1.4)
[image:8.595.60.538.481.704.2]low-value care except in the case of hysterectomy, where they were associated with higher odds of abdominal ra-ther than vaginal or laparoscopic hysterectomy. Private patients (in these public hospitals, as opposed to public patients in these public hospitals) had lower odds of low-value knee arthroscopy, colonoscopy, endoscopy, and spinal fusion, but higher odds of low-value ERCP, sentinel lymph node biopsy, and hysterectomy.
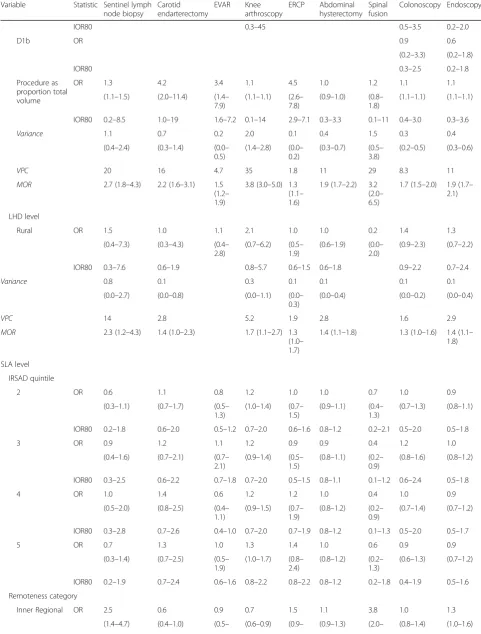
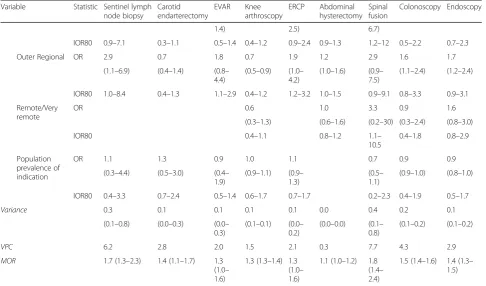
Variables at the hospital, LHD, and SLA levels in-cluded in Model 6 generally showed no significant effect (Table 5). The proportion of total episodes at a hospital that involved the relevant procedure had ORs > 1 for all the services, but this was only supported by the IOR80 for ERCP (IOR80, 2.9–7.1) and EVAR (IOR80, 1.6–7.2). For both these procedures, hospitals that do more of the procedure are more likely to perform the service in-appropriately. Osteoarthritis patients from regional areas were less likely to have knee arthroscopy than those from Major Cities, but the IOR80s indicated this effect was not consistent across SLAs within the remoteness categories.
Discussion
This multilevel analysis allowed us to partition the re-sidual variation in low-value care between hospital, LHD, and SLA of residence. For all nine services we ex-amined, hospital accounted for substantially more vari-ation than LHD or SLA. Where a patient is treated appears more important than where they live in explain-ing their odds of receivexplain-ing low-value care. The LHD to which a hospital belongs also showed little influence. These results have implications for future research and initiatives to reduce low-value care.
Geographic variation analysis is a common approach to investigating clinical variation and inappropriate care [1]. Projects such as the Australian Atlas of Healthcare
Variationhighlight areas where service utilisation is par-ticularly high or low [4, 23]. This provides valuable in-sights into patterns of care across regions. However, our results suggest that this area-based approach will not be helpful for studying low-value care. In assessments of clinical variation for low-value care, area may be just a proxy for the hospitals where the residents are treated. Patients living in the same area may be more likely to at-tend the same few specialists, resulting in admission to the same few hospitals. Research effort to explain and reduce low-value care should focus more on factors within the hospital, rather than the areas where patients live.
Variation at the LHD level was also low compared with the hospital level. This could be interpreted as indi-cating LHDs have little influence at the level of clinical decision-making that governs low-value care. The main levers available to LHDs are funding allocation and
development of policy and procedures for hospitals in the district. Unless a procedure is completely defunded or banned by policy, clinicians still have the authority to decide whether to provide it. Less restrictive policies and procedures aimed at reducing low-value care may be interpreted and implemented differently at different hos-pitals, diluting their effect.
Alternatively, lack of variation at the LHD level could indicate no LHD-wide initiatives have been tried. For knee arthroscopy, LHD-level variation was higher, and this procedure is one for which an LHD-based initiative has been documented [24]. A simple clinical governance process implemented at four hospitals in one LHD was associated with greater decrease in knee arthroscopy in that LHD compared with others. Thus, LHD-based ini-tiatives can work, at least in some cases. However, it is important to note that actual implementation of the pol-icy was at the hospital level, and another hospital in the LHD refused to participate, reportedly because staff at that hospital believed the procedure to be effective [24].
The hospital-, LHD-, and SLA-level variables we ex-amined mostly showed little association with whether a patient receives low-value care. This implies the hospital effect occurs through other unmeasured or unobservable variables at the hospital level. These may include difficult-to-measure concepts such as ‘hospital culture’, local policies, and access to technological infrastructure. We included one variable, the procedure volume as pro-portion of total hospital volume, on the basis that hospi-tals that do more of the procedure overall may be more likely to do more low-value care for that procedure. The ORs were > 1 for all the procedures, tending to support this hypothesis. However, the IOR80s usually included 1, indicating that variation between hospitals overwhelms this effect — individual hospitals with a higher propor-tion of the procedure may still have lower low-value rates than other hospitals with a lower proportion. The exceptions were EVAR and ERCP — hospitals that do more of these procedures (in relation to their total vol-ume) are substantially more likely to perform these pro-cedures when they are not appropriate according to our definitions of low-value care.
Table 5Parameter estimates for Model 6 (full model) for the nine low-value procedures
Variable Statistic Sentinel lymph
node biopsy
Carotid endarterectomy
EVAR Knee
arthroscopy
ERCP Abdominal
hysterectomy Spinal fusion
Colonoscopy Endoscopy
Episode level
Age group*
1 OR 18–39: 0.2 18–74: 0.8 18–74:
0.5
54–64: 2.1 18–39: 0.5
18–39: 0.7 18–49: 0.5
18–29: 0.6 18–24: 0.4
(0.1–0.5) (0.5–1.2) (0.3– 0.7)
(1.9–2.2) (0.3– 0.7)
(0.7–0.8) (0.3– 0.7)
(0.5–0.7) (0.3–0.4)
2 OR 40–54: 0.9 75–79: 1 75–79:
1
65–79: 1 40–54: 0.6
40–49: 1 50–64: 1
30–34: 0.6 25–34: 0.5
(0.6–1.3) (0.4–
0.8)
(0.5–0.7) (0.5–0.5)
3 OR 55–69: 1 80–84: 0.8 80–84:
1.5
70–79: 0.5 55–69: 1
50–59: 0.8 65–79: 1.0
35–44: 0.9 35–44: 0.7
(0.6–1.1) (1.0– 1.2)
(0.5–0.6) (0.7–0.8) (0.7–
1.5)
(0.8–1.0) (0.7–0.8)
4 OR 70–100: 0.8 85–99: 0.8 85–99:
0.9
80–110: 0.2 70–105: 1.9
60–95: 0.2 80–105: 0.1
45–49: 1 45–54: 1
(0.6–1.1) (0.5–1.2) (0.6– 1.4)
(0.1–0.2) (1.4– 2.6)
(0.2–0.3) (0.1– 0.3)
Female OR 0.6 1.0 0.7 0.9 1.0 1.0 1.4 1.0
(0.4–0.8) (0.7–1.3) (0.5– 1.0)
(0.8–1.0) (0.8– 1.2)
(0.8– 1.5)
(1.3–1.6) (0.9–1.0)
Charlson comorbidity index
1 OR 1.2 0.5 0.9 0.7 0.7 1.1 0.7 0.4 0.5
(0.7–2.0) (0.3–0.7) (0.6– 1.3)
(0.6–0.7) (0.5– 1.1)
(0.9–1.3) (0.4– 1.1)
(0.3–0.5) (0.5–0.6)
2–16 OR 0.8 0.3 0.8 0.2 1.0 1.8 0.2 0.3 0.2
(0.4–1.8) (0.2–0.4) (0.6– 1.1)
(0.2–0.3) (0.7– 1.4)
(1.3–2.4) (0.1– 0.3)
(0.2–0.4) (0.2–0.3)
Private patient OR 1.8 1.2 1.0 0.5 2.4 1.2 0.2 0.6 0.6
(1.1–2.8) (0.8–1.7) (0.6– 1.5)
(0.4–0.6) (1.8– 3.1)
(1.0–1.4) (0.1– 0.4)
(0.5–0.7) (0.6–0.7)
Financial year OR 1.1 1.1 1.1 0.9 1.0 0.9 1.0 1.0 1.0
(1.0–1.2) (1.0–1.2) (1.0– 1.1)
(0.9–0.9) (0.9– 1.0)
(0.9–1.0) (0.9– 1.1)
(0.9–1.0) (1.0–1.0)
Hospital level
Peer group
B OR 0.4 2.5 1.0 1.1 0.6 0.8 0.4 1.1 1.2
(0.1–1.6) (1.0–6.9) (0.4– 3.3)
(0.8–1.4) (0.4– 0.9)
(0.5–1.2) (0.0– 4.0)
(0.7–1.6) (0.8–1.8)
IOR80 0.1–2.7 0.6–11 0.5–2.2 0.1–13 0.4–0.9 0.2–2.6 0.1–3.5 0.4–3.0 0.4–4.0
C1 OR 0.4 2.2 1.2 1.2 0.7
(0.1–1.9) (0.9–5.1) (0.6–2.1) (0.7–2.0) (0.4–1.1)
IOR80 0.1–2.5 0.2–28 0.4–3.9 0.4–3.3 0.2–2.3
C2 OR 0.2 4.2 0.6 0.9 0.9
(0.0–1.2) (1.7–9.6) (0.3–1.0) (0.5–1.6) (0.6–1.5)
IOR80 0.0–1.1 0.3–52 0.2–1.8 0.3–2.6 0.3–3.0
D1a OR 3.6 1.3 0.6
Table 5Parameter estimates for Model 6 (full model) for the nine low-value procedures(Continued)
Variable Statistic Sentinel lymph
node biopsy
Carotid endarterectomy
EVAR Knee
arthroscopy
ERCP Abdominal
hysterectomy Spinal fusion
Colonoscopy Endoscopy
IOR80 0.3–45 0.5–3.5 0.2–2.0
D1b OR 0.9 0.6
(0.2–3.3) (0.2–1.8)
IOR80 0.3–2.5 0.2–1.8
Procedure as proportion total volume
OR 1.3 4.2 3.4 1.1 4.5 1.0 1.2 1.1 1.1
(1.1–1.5) (2.0–11.4) (1.4– 7.9)
(1.1–1.1) (2.6– 7.8)
(0.9–1.0) (0.8– 1.8)
(1.1–1.1) (1.1–1.1)
IOR80 0.2–8.5 1.0–19 1.6–7.2 0.1–14 2.9–7.1 0.3–3.3 0.1–11 0.4–3.0 0.3–3.6
Variance 1.1 0.7 0.2 2.0 0.1 0.4 1.5 0.3 0.4
(0.4–2.4) (0.3–1.4) (0.0– 0.5)
(1.4–2.8) (0.0– 0.2)
(0.3–0.7) (0.5– 3.8)
(0.2–0.5) (0.3–0.6)
VPC 20 16 4.7 35 1.8 11 29 8.3 11
MOR 2.7 (1.8–4.3) 2.2 (1.6–3.1) 1.5
(1.2– 1.9)
3.8 (3.0–5.0) 1.3 (1.1– 1.6)
1.9 (1.7–2.2) 3.2 (2.0– 6.5)
1.7 (1.5–2.0) 1.9 (1.7– 2.1)
LHD level
Rural OR 1.5 1.0 1.1 2.1 1.0 1.0 0.2 1.4 1.3
(0.4–7.3) (0.3–4.3) (0.4– 2.8)
(0.7–6.2) (0.5– 1.9)
(0.6–1.9) (0.0– 2.0)
(0.9–2.3) (0.7–2.2)
IOR80 0.3–7.6 0.6–1.9 0.8–5.7 0.6–1.5 0.6–1.8 0.9–2.2 0.7–2.4
Variance 0.8 0.1 0.3 0.1 0.1 0.1 0.1
(0.0–2.7) (0.0–0.8) (0.0–1.1) (0.0–
0.3)
(0.0–0.4) (0.0–0.2) (0.0–0.4)
VPC 14 2.8 5.2 1.9 2.8 1.6 2.9
MOR 2.3 (1.2–4.3) 1.4 (1.0–2.3) 1.7 (1.1–2.7) 1.3
(1.0– 1.7)
1.4 (1.1–1.8) 1.3 (1.0–1.6) 1.4 (1.1– 1.8)
SLA level
IRSAD quintile
2 OR 0.6 1.1 0.8 1.2 1.0 1.0 0.7 1.0 0.9
(0.3–1.1) (0.7–1.7) (0.5– 1.3)
(1.0–1.4) (0.7– 1.5)
(0.9–1.1) (0.4– 1.3)
(0.7–1.3) (0.8–1.1)
IOR80 0.2–1.8 0.6–2.0 0.5–1.2 0.7–2.0 0.6–1.6 0.8–1.2 0.2–2.1 0.5–2.0 0.5–1.8
3 OR 0.9 1.2 1.1 1.2 0.9 0.9 0.4 1.2 1.0
(0.4–1.6) (0.7–2.1) (0.7– 2.1)
(0.9–1.4) (0.5– 1.5)
(0.8–1.1) (0.2– 0.9)
(0.8–1.6) (0.8–1.2)
IOR80 0.3–2.5 0.6–2.2 0.7–1.8 0.7–2.0 0.5–1.5 0.8–1.1 0.1–1.2 0.6–2.4 0.5–1.8
4 OR 1.0 1.4 0.6 1.2 1.2 1.0 0.4 1.0 0.9
(0.5–2.0) (0.8–2.5) (0.4– 1.1)
(0.9–1.5) (0.7– 1.9)
(0.8–1.2) (0.2– 0.9)
(0.7–1.4) (0.7–1.2)
IOR80 0.3–2.8 0.7–2.6 0.4–1.0 0.7–2.0 0.7–1.9 0.8–1.2 0.1–1.3 0.5–2.0 0.5–1.7
5 OR 0.7 1.3 1.0 1.3 1.4 1.0 0.6 0.9 0.9
(0.3–1.4) (0.7–2.5) (0.5– 1.9)
(1.0–1.7) (0.8– 2.4)
(0.8–1.2) (0.2– 1.3)
(0.6–1.3) (0.7–1.2)
IOR80 0.2–1.9 0.7–2.4 0.6–1.6 0.8–2.2 0.8–2.2 0.8–1.2 0.2–1.8 0.4–1.9 0.5–1.6
Remoteness category
Inner Regional OR 2.5 0.6 0.9 0.7 1.5 1.1 3.8 1.0 1.3
Limitations
Our results must be influenced by using only hospital data. Although our analysis showed hospital has the greatest impact, SLA may have a greater impact overall when the possibility that some patients with the relevant conditions are managed in the community instead of hospital is considered. Patients who receive appropriate non-hospital care will not appear in our hospitalised co-horts. This is unlikely to make much practical difference
—initiatives to reduce low-value care can still be targeted at the hospital level, and should ultimately increase appro-priate care in the approappro-priate setting.
Another limitation is that patients are not necessarily in hospital for treatment of the indication that makes a procedure low value. For example, many older patients may have knee osteoarthritis recorded but be in hospital for treatment of another condition. We would still count them in our knee arthroscopy cohort as patients for whom arthroscopy is low value, even though there may never have been any possibility they would be offered this procedure because the treatment focus is on another condition. Thus, SLAs or hospitals with more patients with osteoarthritis would show lower rates of low-value knee arthroscopy. Coding rules specify that only diagnoses
relevant to management of the patient should be re-corded, and this should mitigate this issue. However, if osteoarthritis limited mobility and increased risk of falls, it could be relevant to the management of any condition for which the patient was being treated.
We focused this analysis on the variation at the differ-ent model levels. Nevertheless, the episode-level vari-ables often had strong associations with low-value care. These associations may indicate limitations of our mea-sures or areas where there is genuine clinical uncer-tainty. For example, colonoscopy for constipation in people younger than 50 years showed a steady increase as age increased towards 50. This recommendation is from Canada, and while it does not conflict with any Australian guidelines it simply may not be a recognised recommendation so not routinely followed in Australia. The age trend may indicate that clinicians recognise the investigation is not appropriate in younger people, but have differing ideas on what an appropriate age limit should be.
Conclusion
[image:12.595.56.543.99.385.2]Low-value care shows substantial variation by hospital, and with little variation by LHD of the treating hospital Table 5Parameter estimates for Model 6 (full model) for the nine low-value procedures(Continued)
Variable Statistic Sentinel lymph
node biopsy
Carotid endarterectomy
EVAR Knee
arthroscopy
ERCP Abdominal
hysterectomy Spinal fusion
Colonoscopy Endoscopy
1.4) 2.5) 6.7)
IOR80 0.9–7.1 0.3–1.1 0.5–1.4 0.4–1.2 0.9–2.4 0.9–1.3 1.2–12 0.5–2.2 0.7–2.3
Outer Regional OR 2.9 0.7 1.8 0.7 1.9 1.2 2.9 1.6 1.7
(1.1–6.9) (0.4–1.4) (0.8– 4.4)
(0.5–0.9) (1.0– 4.2)
(1.0–1.6) (0.9– 7.5)
(1.1–2.4) (1.2–2.4)
IOR80 1.0–8.4 0.4–1.3 1.1–2.9 0.4–1.2 1.2–3.2 1.0–1.5 0.9–9.1 0.8–3.3 0.9–3.1
Remote/Very remote
OR 0.6 1.0 3.3 0.9 1.6
(0.3–1.3) (0.6–1.6) (0.2–30) (0.3–2.4) (0.8–3.0)
IOR80 0.4–1.1 0.8–1.2 1.1–
10.5
0.4–1.8 0.8–2.9
Population prevalence of indication
OR 1.1 1.3 0.9 1.0 1.1 0.7 0.9 0.9
(0.3–4.4) (0.5–3.0) (0.4– 1.9)
(0.9–1.1) (0.9– 1.3)
(0.5– 1.1)
(0.9–1.0) (0.8–1.0)
IOR80 0.4–3.3 0.7–2.4 0.5–1.4 0.6–1.7 0.7–1.7 0.2–2.3 0.4–1.9 0.5–1.7
Variance 0.3 0.1 0.1 0.1 0.1 0.0 0.4 0.2 0.1
(0.1–0.8) (0.0–0.3) (0.0– 0.3)
(0.1–0.1) (0.0– 0.2)
(0.0–0.0) (0.1– 0.8)
(0.1–0.2) (0.1–0.2)
VPC 6.2 2.8 2.0 1.5 2.1 0.3 7.7 4.3 2.9
MOR 1.7 (1.3–2.3) 1.4 (1.1–1.7) 1.3
(1.0– 1.6)
1.3 (1.3–1.4) 1.3 (1.0– 1.6)
1.1 (1.0–1.2) 1.8 (1.4– 2.4)
1.5 (1.4–1.6) 1.4 (1.3– 1.5)
*Age groups differ between services and are set at approximate quartiles for the cohort for each service. Individual age groups are specified before the parameter estimates. Reference categories were selected according to what seemed most appropriate for each procedure
or SLA of patient’s residence. Investigations into the drivers of low-value care and initiatives to reduce low-value care might best be targeted at the hospital level. For a proper assessment of clinical variation in low-value care, we need to measure factors at the hospital level, such as culture, local policies, and access to techno-logical infrastructure. In particular, we should investigate the practices, knowledge, and attitudes of individual clini-cians. Our systems do not currently allow this on a broad scale, but it is likely to be key to truly understanding the factors that drive low-value care. While the geographic ap-proach of measuring procedures within areas has provided
some insights, future studies should adopt a
service-delivery perspective. Measurement at the service-provider level (rather than the geographic region) is more likely to enable action to reduce clinical variation and low-value care.
Additional files
Additional file 1:Descriptions of the model levels and variables used at each level. (PDF 22 kb)
Additional file 2:Table S1: Summary of cohorts for the 9 low-value ser-vices. (XLSX 22 kb)
Additional file 3:Results for analyses using the broader definitions of low-value care. (PDF 472 kb)
Abbreviations
ERCP:Endoscopic retrograde cholangiopancreatography; EVAR: Endovascular repair of abdominal aortic aneurysm; IOR80: 80% interval odds ratio; IRSAD: Index of Relative Socioeconomic Advantage and Disadvantage; LHD: Local Health District; MOR: Median odds ratio; NSW: New South Wales; SLA: Statistical Local Area; VPC: Variance partition coefficient
Acknowledgements Not applicable.
Funding
This project was funded through a partnership agreement between the Capital Markets Cooperative Research Centre, the NSW Ministry of Health, and the University of Sydney, with additional funding from the HCF Research Foundation and the National Health and Medical Research Council (NHMRC) (project grant ID 1109626). The funding bodies had no role in the design of the study, collection, analysis and interpretation of data, or writing the manuscript.
Availability of data and materials
The data that support the findings of this study are held by the NSW Ministry of Health and restrictions apply to the use of these data under the Health Records and Information Privacy Act 2002(NSW). On reasonable request, the authors will assist in preparing a data request and ethics application to the NSW Population and Health Services Research Ethics Committee.
Authors’contributions
TBP planned and conducted the analysis and wrote the manuscript. YF provided advice on modelling and assisted with drafting the paper. JFL assisted in interpreting the models and their implications and in drafting the paper. SAP, SD, and AGE provided overall supervision and direction to the project and assisted with drafting the paper. All authors read and approved the final manuscript.
Ethics approval and consent to participate
This study was approved by the New South Wales Population and Health Services Research Ethics Committee (CI 2015/09/607).
Consent for publication Not applicable.
Competing interests
AGE receives salary support as the HCF Research Foundation Professorial Fellow, is a Ministerial appointee to the (Australian) Medicare Benefits Schedule (MBS) Review Taskforce, a Board Member of the NSW Bureau of Health Information (BHI) and is an advisor to Cancer Australia. He has received consulting fees from the Queensland and Victoria state government health departments and Private Healthcare Australia. TBP receives salary support via a doctoral scholarship from the Capital Markets Cooperative Research Centre-Health Market Quality Program, and a University Postgradu-ate Award from the University of Sydney. TBP is a member of the Editorial Board ofBMC Health Services Research. He had no editorial role in the hand-ling and review of this manuscript.
Publisher’s Note
Springer Nature remains neutral with regard to jurisdictional claims in published maps and institutional affiliations.
Author details 1
Faculty of Medicine and Health, School of Public Health, Menzies Centre for Health Policy, Charles Perkins Centre, The University of Sydney, Level 2, Charles Perkins Centre D17, Sydney, NSW 2006, Australia.2Centre for Big Data Research in Health, University of New South Wales, Sydney, Australia. 3
Agency for Clinical Innovation, Sydney, NSW, Australia.4NSW Ministry of Health, Sydney, Australia.
Received: 19 October 2018 Accepted: 10 May 2019
References
1. Scott IA, Duckett SJ. In search of professional consensus in defining and reducing low-value care. Med J Aust. 2015;203:179–81 e1.
2. Kirkham KR, Wijeysundera DN, Pendrith C, Ng R, Tu JV, Laupacis A, et al. Preoperative testing before low-risk surgical procedures. CMAJ. 2015;187: E349–58.
3. Badgery-Parker T, Pearson S-A, Chalmers K, Brett J, Scott IA, Dunn S, et al. Low-value care in Australian public hospitals: prevalence and trends over time. BMJ Qual Saf. 2019;28:205–14.
4. Australian Commission on Safety and Quality in Health Care, National Health Performance Authority. The Australian atlas of healthcare variation. Sydney: ACSQHC; 2015. https://www.safetyandquality.gov.au/atlas/atlas-2015/
5. Tracey EA, Mccaughan B, Badgery-Parker T, Young JM, Armstrong BK. Patients with localized non-small cell lung cancer miss out on curative surgery with distance from specialist care. ANZ J Surg. 2015;85:658–63. 6. Dundas R, Leyland AH, MacIntyre S. Early-life school, neighborhood, and
family influences on adult health: a multilevel cross-classified analysis of the Aberdeen children of the 1950s study. Am J Epidemiol. 2014;180:197–207. 7. Merlo J, Yang M, Chaix B, Lynch J, Råstam L. A brief conceptual tutorial on
multilevel analysis in social epidemiology: investigating contextual phenomena in different groups of people. J Epidemiol Community Health. 2005;59:729–36.
8. Colla CH, Morden NE, Sequist TD, Schpero WL, Rosenthal MB. Choosing wisely: prevalence and correlates of low-value health care services in the United States. J Gen Intern Med. 2014;30:221–8.
9. Chalmers K, Badgery-Parker T, Pearson S-A, Brett J, Scott IA, Elshaug AG. Developing indicators for measuring low-value care: mapping choosing wisely recommendations to hospital data. BMC Res Notes. 2018;11:163. 10. Australian Bureau of Statistics. Australian standard geographical classification
(ASGC), July 2011. Canberra; 2011.
11. Australian Bureau of Statistics. Socio-Economic Indexes for Areas (SEIFA), Australia, 2011. Canberra; 2013.
13. Australian Bureau of Statistics. ABS.Stat.http://stat.data.abs.gov.au. Accessed 20 Jun 2017.
14. American College of Obstetricians and Gynecologists Committee on Gynecologic Practice. Choosing the route of hysterectomy for benign disease. Obstet Gynecol. 2009;114:1156–8.
15. Tenner S, Baillie J, Dewitt J, Vege SS. American College of Gastroenterology guideline: management of acute pancreatitis. Am J Gastroenterol. 2013;108: 1400–15.https://doi.org/10.1038/ajg.2013.218.
16. Working Group IAP/APA Acute Pancreatitis Guidelines. IAP/APA evidence-based guidelines for the management of acute pancreatitis. Pancreatology. 2013;13:e1–15.
17. Nesvaderani M, Eslick GD, Cox MR. Acute pancreatitis: update on management. Med J Aust. 2015;202:420–3.
18. Merlo J, Wagner P, Ghith N, Leckie G. An original stepwise multilevel logistic regression analysis of discriminatory accuracy: the case of neighbourhoods and health. PLoS One. 2016;11:1–31.
19. Austin PC, Merlo J. Intermediate and advanced topics in multilevel logistic regression analysis. Stat Med. 2017;36:3257–77.
20. Forbes C, Evans M, Hastings N, Peacock B. Statistical Distributions. 4th ed. Hoboen NJ: Wiley; 2010.
21. Larsen K, Merlo J. Appropriate assessment of neighborhood effects on individual health: integrating random and fixed effects in multilevel logistic regression. Am J Epidemiol. 2005;161:81–8.
22. Hosmer DW, Lemeshow S. Applied logistic regression. 2nd ed. New York: Wiley; 2000.
23. Australian Commission on Safety and Quality in Health Care. The second Australian atlas of healthcare variation. Sydney: ACSQHC; 2017.https://www. safetyandquality.gov.au/atlas/atlas-2017/