S H O R T R E P O R T
Open Access
Machine learning on normalized protein
sequences
Dominik Heider
1*, Jens Verheyen
2and Daniel Hoffmann
1Abstract
Background:Machine learning techniques have been widely applied to biological sequences, e.g. to predict drug resistance in HIV-1 from sequences of drug target proteins and protein functional classes. As deletions and insertions are frequent in biological sequences, a major limitation of current methods is the inability to handle varying sequence lengths.
Findings:We propose to normalize sequences to uniform length. To this end, we tested one linear and four different non-linear interpolation methods for the normalization of sequence lengths of 19 classification datasets. Classification tasks included prediction of HIV-1 drug resistance from drug target sequences and sequence-based prediction of protein function. We applied random forests to the classification of sequences into“positive”and “negative”samples. Statistical tests showed that the linear interpolation outperforms the non-linear interpolation methods in most of the analyzed datasets, while in a few cases non-linear methods had a small but significant advantage. Compared to other published methods, our prediction scheme leads to an improvement in prediction accuracy by up to 14%.
Conclusions:We found that machine learning on sequences normalized by simple linear interpolation gave better or at least competitive results compared to state-of-the-art procedures, and thus, is a promising alternative to existing methods, especially for protein sequences of variable length.
Background
Statistical methods and machine learning techniques, such as linear regression (LR) [1], decision trees (DTs) [2], artificial neural networks (ANNs) [3], support vector machines (SVMs) [4], and random forests (RFs) [5] have been widely applied in biomedical pattern classification, for instance in the prediction of HIV drug resistance and protein function. In several studies, the amino acid or DNA sequences were encoded by descriptors, which substitute each nucleotide or amino acid with a numeri-cal value [6]. Some examples of descriptors are hydro-phobicity, molecular weight or isoelectric point. Other studies represent a sequence by its mutations compared to the wild type sequence [7]. Yet another possible representation is the use of the standard orthonormal representation [8] or sparse encoding [9], a vector con-taining twenty indicator variables (one for each amino
acid) for each sequence position, resulting in a matrix containing the amino acid distributions for each position within the input sequence [10].
A drawback of conventional machine learning algo-rithms is that they need a fixed input length, and, conse-quently, cannot be easily applied to data which varies in its dimension/length, as is often the case for protein sequences. One possible remedy are SVMs with string kernels [11,12]. Kernel functions return the inner pro-duct between the mapped data points in a higher dimensional space, and the special class of string kernels tries to match alignments of subsequences to build a higher dimensional feature space in which the sequences can be separated [13]. Another possible solution is the application of multiple sequence alignments [14] or multiple pairwise alignments to a reference sequence [15]. In these approaches, missing values are either filled by a specifically defined value, or by the most common value. However, this introduces some artificial informa-tion that can bias predicinforma-tions.
* Correspondence: [email protected]
1
Department of Bioinformatics, Center of Medical Biotechnology, University of Duisburg-Essen, Universitaetsstr. 2, 45117 Essen, Germany
Full list of author information is available at the end of the article
We developed another effective, though conceptionally more simple solution, that is to linearly normalize the data to a fixed length as a preprocessing step and to subsequently apply machine learning methods to classify the data [16]. This interpolation procedure has already been successfully applied to coreceptor usage prediction in HIV-1 [17] and functional protein classification [18]. A particularly relevant application is in the prediction of HIV-1 drug resistance. Anti-retroviral treatment regi-mens can sufficiently suppress viral replication in HIV infected patients and prevent the progression of the dis-ease. One of the factors contributing to the progression of the disease despite ongoing antiretroviral treatment is the emergence of drug resistance: The high mutation rate of HIV can lead to a fast adaptation of the virus under drug pressure, thus to the evolution of drug-resistant variants and failure of antiretroviral treatment. Some of the resistant strains show insertions in the drug targets HIV-1 protease and reverse transcriptase [19,20].
The focus of the current study is to compare the sim-ple linear interpolation [16] with non-linear normaliza-tion procedures in order to evaluate the performance in subsequent classification. To this end, we tested seven HIV protease inhibitors (PIs), six HIV nucleoside reverse transcriptase inhibitors (NRTIs), three HIV nonnucleo-side reverse transcriptase inhibitors (NNRTIs) and one HIV maturation inhibitor (MI) datasets. PIs prevent viral replication by inhibiting the activity of HIV-1 pro-tease, an enzyme used by the viruses to cleave nascent polypeptides into functional proteins. They are designed to have a high affinity to the catalytic center of the HIV protease, thereby hampering its enzymatic activity. NRTIs and NNRTIs inhibit the activity of the reverse transcriptase (RT). NRTIs are nucleoside analogs, and thus, compete for the RT with the natural nucleosides. An incorporation of a NRTI leads to a premature termi-nation of the viral genome replication. In contrast, NNRTIs are non-competitive inhibitors of the RT. They inhibit the movement of protein domains of the RT that is needed to carry out the process of DNA synthesis. MIs, such as Bevirimat, inhibit maturation of virus parti-cles by preventing cleavage of precursor polyprotein gag by the HIV-1 protease.
Besides the comparison between the linear and non-linear methods, we also compare our classification results with results obtained from state-of-the-art meth-ods. We focus on the comparison between our method and other methods that employed exactly the same pub-licly available datasets, namely Rheeet al. [7], Houet al. [21], Kierczaket al. [22] and Heideret al. [23].
Rheeet al. used five different statistical and machine learning methods (DTs, ANNs, SVMs, least-squares regression and least angle regression) to predict drug resistance in HIV-1 [7] for 16 drugs. A sequence was
represented by its set of mutations compared to the wild type sequence. Hou et al. developed a machine learning approach for the prediction of PI resistance based on SVMs [21], but in contrast to Rheeet al., they used structure-derived descriptors. Kierczaket al. [22] developed a set-based model considering physico-chemical changes of mutated sequences compared to the wildtype strain to predict NRTI and NNRTI resis-tance. Heideret al. [23] used a multiple sequence align-ment of the p2 sequences as an input for a RF to predict Bevirimat resistance. Other published methods, e.g. [24-26] employed other datasets, and hence, their results cannot be easily compared with our method.
To check whether normalization is also advantageous in other applications, we tested two datasets dealing with protein functional class prediction [16,18], namely the classification of small GTPases and the classification of the major intrinsic protein family (MIP). Small GTPases are small monomeric proteins that can act as
“molecular switches” due to their ability to bind and hydrolyze GTP. In its GTP-bound form a small GTPase is active, whereas a hydrolysis of GTP to GDP converts the protein into its inactive conformation [27]. Small GTPases are involved in many cellular processes includ-ing differentiation, cell division, vesicular transport, nuclear assembly, and control of the cytoskeleton. The involvement of a variety of Ras superfamily proteins in human tumorigenesis makes these proteins interesting subjects in cancer research, and hence, the identification and functional characterization of novel GTPases is an important topic in molecular cell biology [28]. The MIPs are a large family of different types of membrane channels, e.g. aquaporines [29].
Results and discussion
The workflow applied in the current study is shown in Figure 1. The sequences are encoded with the hydropa-thy descriptor [30] and subsequently normalized to a fixed length with the mentioned interpolation methods. The normalized sequences are used to train the RF model. We also tested thenet charge, molecular weight and isoelectric point as descriptors to encode the sequences. The relative performance of each normaliza-tion procedure in comparison to each other is quite similar for all descriptors. However, the hydropathy descriptor works best with regard to the prediction per-formance, and thus we only show the results of the hydropathy descriptor in the following.
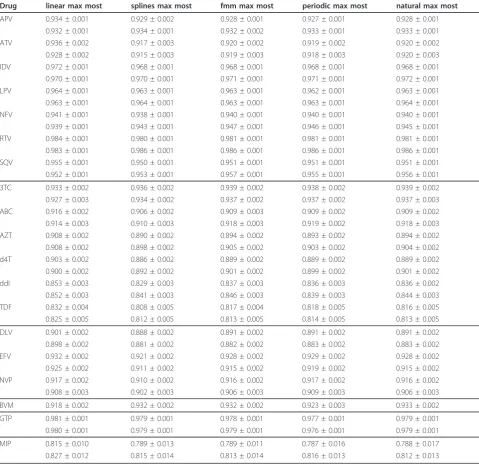
Table 2 shows AUC values of the predictions, Table 3 the results of the Wilcoxon Signed-Rank tests (significance level a = 0.05). In the case of a maximal (max) interpolation factor, the linear interpolation method outperforms the other interpolation methods in most of the datasets, except for 3TC, NVP and BVM. Using the most frequent sequence length as interpolation factor (most), the picture is less clear. The linear interpolation works best for the datasets ATV, AZT, ddI, TDF, DLV, EFV, GTP and MIP and the fmm interpolation for the datasets NFV, RTV and SQV. In most of the datasetsmax and most interpola-tion do not perform significantly different according to the Wilcoxon Signed-Rank tests.
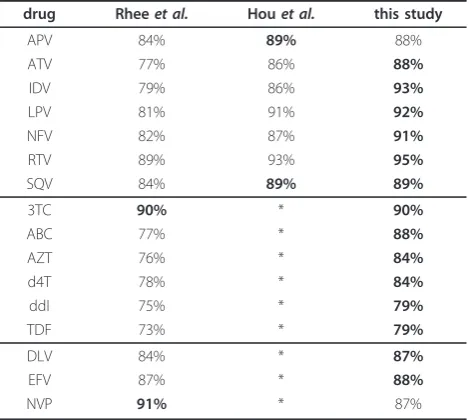
Rheeet al. used five different statistical and machine learning methods (DTs, ANNs, SVMs, least-squares regression and least angle regression) to predict drug resistance in HIV-1 [7]. In contrast to our encoding pro-cedure, a sequence was represented by its set of muta-tions compared to the wild type sequence. Hou et al. developed a machine learning approach for the predic-tion of PI resistance (APV, ATV, IDV, LPV, NFV, RTV and SQV) based on SVMs [21], but in contrast to Rhee et al., they used structure-derived descriptors. Their method had a higher accuracy compared to the results of Rheeet al. Table 4 shows a comparison of the pre-diction accuracy for the best models of Rheeet al., Hou et al. and the best model based on the methods used in
[image:3.595.59.539.85.503.2]
the current study. Judged from the comparison of the results, normalization of sequences seems in general to improve classification performance, except for APV (89% vs. 88% accuracy) and SQV (89% vs. 89% accu-racy). However, we used the complete datasets whereas the results of Rhee et al. and Hou et al. are based on the best models for specific subsets, e.g. for APV they report the results of the TSM subset (the best model of Rheeet al. for the complete APV dataset reached only an accuracy of 82%). For the NRTI and NNRTI datasets, our procedure yielded higher accuracy compared to the results from Rheeet al. for all datasets, except for 3TC (90% vs. 90% accuracy) and for NVP (91% vs. 87% accu-racy). As neither Rhee et al. nor Hou et al. provided standard deviations for the prediction accuracy, we can-not perform a statistical comparison to warrant that our results are significantly better for all datasets. To assess the relative impact of normalization and actual machine learning method, we also applied artificial neural net-works in accordance to Rhee et al. The results are worse compared to the results obtained with the RF classification, but still better than the results of Rhee et al., thus justifying sequence normalization as a pre-processing step.
Kierczaket al. [22] provide AUC values with standard deviations, so their results are directly comparable to our results (see Table 5). Our results led to substantially
better results for the drugs ABC, d4T, DLV, NVP, slighty better results for the drugs AZT and ddI and slightly worse results for the drugs 3TC and TDF. Kierc-zaket al. do not provide results for the drug EFV. Our results show smaller standard deviations compared to the results of Kierczak et al., which are based on a rough set-based model [22]. For BVM resistance classifi-cation, we obtained an AUC of 0.933 ± 0.002 with machine learning on normalized sequences, which is slightly, but significantly higher (according to Wilcoxon Signed-Rank test ata = 0.05) than that (0.927 ± 0.001) obtained with aligned sequences of the HIV-1 p2 sequences as input [23], thus again justifying sequence normalization as a preprocessing step. The best AUCs for the protein functional class prediction of the small GTPases and the MIPs are 0.981 ± 0.001 and 0.827 ± 0.012, respectively, which are in accordance with our recently published results [16,18].
As mentioned before, RFs are able to identify the most important positions for the classification process [31]. We studied importance of sequence positions for each of our datasets. Five positions (L10, K20, I54, V82, L90) in the HIV-1 protease are found in the top ten list of most important mutations for the correct classification of each protease inhibitor and two further known mutations (M46, A71) are found in almost all datasets (see Figure 2). Mutations at three positions -L10, K20 and A71 - are known as compensatory, i.e. compensating for the loss of enzyme activity due to major protease mutations. These findings might be explained by the origin of data from patients having experienced multitherapy failures and thus developed highly adapted viral strains. This would be in line with the findings that protease inhibitor specific protease mutations belong to the twenty most important posi-tions for the classification process (APV: 32, 76; SQV: 48 and LPV: 76).
The ten most important resistance mutations of each protease inhibitor (involving protease positions (50, 63, 73, 74, 76, 85 and 88)) are also in accordance with pre-viousin vitro andin vivofindings (APV: 74 [32], LPV: 63 [33], ATV: 50 [34], NFV: 88 [35]).
[image:4.595.57.290.100.359.2]The scoring of protease position 76 in terms of pre-dicted ATV resistance is interesting, since it is well known that protease mutation 76V, which confers resis-tance to LPV and APV, re-sensitizes these HIV isolates to the protease inhibitors SQV and ATV. Indeed, HIV isolates carrying protease mutation 76 V accumulate in the group of susceptible to ATV therapy regimens, which therefore explains the prediction of susceptible rather than resistant. This effect of re-sensitization has been considered mainly in rule-based HIV drug resis-tance interpretation tools, but has failed so far to reach statistical significance in machine learning approaches. Table 1 Summary of the datasets
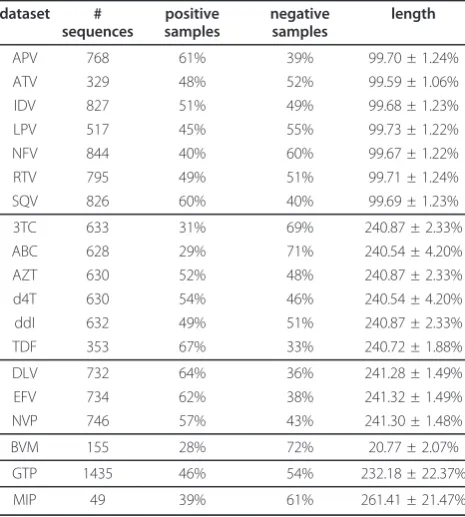
dataset #
sequences
positive samples
negative samples
length
APV 768 61% 39% 99.70 ± 1.24%
ATV 329 48% 52% 99.59 ± 1.06%
IDV 827 51% 49% 99.68 ± 1.23%
LPV 517 45% 55% 99.73 ± 1.22%
NFV 844 40% 60% 99.67 ± 1.22%
RTV 795 49% 51% 99.71 ± 1.24%
SQV 826 60% 40% 99.69 ± 1.23%
3TC 633 31% 69% 240.87 ± 2.33%
ABC 628 29% 71% 240.54 ± 4.20%
AZT 630 52% 48% 240.87 ± 2.33%
d4T 630 54% 46% 240.54 ± 4.20%
ddI 632 49% 51% 240.87 ± 2.33%
TDF 353 67% 33% 240.72 ± 1.88%
DLV 732 64% 36% 241.28 ± 1.49%
EFV 734 62% 38% 241.32 ± 1.49%
NVP 746 57% 43% 241.30 ± 1.48%
BVM 155 28% 72% 20.77 ± 2.07%
GTP 1435 46% 54% 232.18 ± 22.37%
MIP 49 39% 61% 261.41 ± 21.47%
For the NRTIs and NNRTIs the RFs also identified major known resistant mutations such as M41, L74, M184, L210 and K219 [36].
The normalization of the sequence length for the pre-diction of drug resistance allows to analyze HIV pro-tease sequences carrying insertions/deletions. Insertions in the protease are sometimes observed in HIV isolates failing PI therapies. It has been shown in a recent study [20] that the prevalence of insertions has increased sig-nificantly in the last years. Furthermore, it has been shown in an earlier study [19] that RT insertions are
frequently found in heavily-treated patients, which can enhance NRTI resistance and may improve viral fitness. Our classification procedure is able to classify these recently published protease and reverse transcriptase insertions in terms of resistance correctly.
Conclusions
[image:5.595.57.537.101.566.2]In most of the cases studied here, linear interpolation gave superior AUC values in comparison with non-lin-ear schemes. In some cases, other interpolation methods lead to slightly, but significantly higher AUCs, e.g. for Table 2 Prediction results
Drug linear max most splines max most fmm max most periodic max most natural max most
APV 0.934 ± 0.001 0.929 ± 0.002 0.928 ± 0.001 0.927 ± 0.001 0.928 ± 0.001
0.932 ± 0.001 0.934 ± 0.001 0.932 ± 0.002 0.933 ± 0.001 0.933 ± 0.001
ATV 0.936 ± 0.002 0.917 ± 0.003 0.920 ± 0.002 0.919 ± 0.002 0.920 ± 0.002
0.928 ± 0.002 0.915 ± 0.003 0.919 ± 0.003 0.918 ± 0.003 0.920 ± 0.003
IDV 0.972 ± 0.001 0.968 ± 0.001 0.968 ± 0.001 0.968 ± 0.001 0.968 ± 0.001
0.970 ± 0.001 0.970 ± 0.001 0.971 ± 0.001 0.971 ± 0.001 0.972 ± 0.001
LPV 0.964 ± 0.001 0.963 ± 0.001 0.963 ± 0.001 0.962 ± 0.001 0.963 ± 0.001
0.963 ± 0.001 0.964 ± 0.001 0.963 ± 0.001 0.963 ± 0.001 0.964 ± 0.001
NFV 0.941 ± 0.001 0.938 ± 0.001 0.940 ± 0.001 0.940 ± 0.001 0.940 ± 0.001
0.939 ± 0.001 0.943 ± 0.001 0.947 ± 0.001 0.946 ± 0.001 0.945 ± 0.001
RTV 0.984 ± 0.001 0.980 ± 0.001 0.981 ± 0.001 0.981 ± 0.001 0.981 ± 0.001
0.983 ± 0.001 0.986 ± 0.001 0.986 ± 0.001 0.986 ± 0.001 0.986 ± 0.001
SQV 0.955 ± 0.001 0.950 ± 0.001 0.951 ± 0.001 0.951 ± 0.001 0.951 ± 0.001
0.952 ± 0.001 0.953 ± 0.001 0.957 ± 0.001 0.955 ± 0.001 0.956 ± 0.001
3TC 0.933 ± 0.002 0.936 ± 0.002 0.939 ± 0.002 0.938 ± 0.002 0.939 ± 0.002
0.927 ± 0.003 0.934 ± 0.002 0.937 ± 0.002 0.937 ± 0.002 0.937 ± 0.003
ABC 0.916 ± 0.002 0.906 ± 0.002 0.909 ± 0.003 0.909 ± 0.002 0.909 ± 0.002
0.914 ± 0.003 0.910 ± 0.003 0.918 ± 0.003 0.919 ± 0.002 0.918 ± 0.003
AZT 0.908 ± 0.002 0.890 ± 0.002 0.894 ± 0.002 0.893 ± 0.002 0.894 ± 0.002
0.908 ± 0.002 0.898 ± 0.002 0.905 ± 0.002 0.903 ± 0.002 0.904 ± 0.002
d4T 0.903 ± 0.002 0.886 ± 0.002 0.889 ± 0.002 0.889 ± 0.002 0.889 ± 0.002
0.900 ± 0.002 0.892 ± 0.002 0.901 ± 0.002 0.899 ± 0.002 0.901 ± 0.002
ddI 0.853 ± 0.003 0.829 ± 0.003 0.837 ± 0.003 0.836 ± 0.003 0.836 ± 0.002
0.852 ± 0.003 0.841 ± 0.003 0.846 ± 0.003 0.839 ± 0.003 0.844 ± 0.003
TDF 0.832 ± 0.004 0.808 ± 0.005 0.817 ± 0.004 0.818 ± 0.005 0.816 ± 0.005
0.825 ± 0.005 0.812 ± 0.005 0.813 ± 0.005 0.814 ± 0.005 0.813 ± 0.005
DLV 0.901 ± 0.002 0.888 ± 0.002 0.891 ± 0.002 0.891 ± 0.002 0.891 ± 0.002
0.898 ± 0.002 0.881 ± 0.002 0.882 ± 0.002 0.883 ± 0.002 0.883 ± 0.002
EFV 0.932 ± 0.002 0.921 ± 0.002 0.928 ± 0.002 0.929 ± 0.002 0.928 ± 0.002
0.925 ± 0.002 0.911 ± 0.002 0.915 ± 0.002 0.919 ± 0.002 0.915 ± 0.002
NVP 0.917 ± 0.002 0.910 ± 0.002 0.916 ± 0.002 0.917 ± 0.002 0.916 ± 0.002
0.908 ± 0.003 0.902 ± 0.003 0.906 ± 0.003 0.909 ± 0.003 0.906 ± 0.003
BVM 0.918 ± 0.002 0.932 ± 0.002 0.932 ± 0.002 0.923 ± 0.003 0.933 ± 0.002
GTP 0.981 ± 0.001 0.979 ± 0.001 0.978 ± 0.001 0.977 ± 0.001 0.979 ± 0.001
0.980 ± 0.001 0.979 ± 0.001 0.979 ± 0.001 0.976 ± 0.001 0.979 ± 0.001
MIP 0.815 ± 0.010 0.789 ± 0.013 0.789 ± 0.011 0.787 ± 0.016 0.788 ± 0.017
0.827 ± 0.012 0.815 ± 0.014 0.813 ± 0.014 0.816 ± 0.013 0.812 ± 0.013
NFV, RTV, SQV, 3TC, ABC and BVM. Interpolating sequence lengths in combination with hydropathy as a descriptor and RFs led to at least competitive results compared to other methods [7,21-23]. Although sequence length variations are rare in the case of HIV-1 protease and reverse transcriptase, there are some inser-tions and deleinser-tions known, and these can be handled consistently with the proposed procedure. Our method is able to correctly predict drug resistance in HIV-1 iso-lates carrying insertions in the protease [20]. Moreover, the GTPases and the MIP datasets show a high sequence variability, which can be easily handled with our proposed scheme. As demonstrated, there is no sig-nificant performance difference between themost and themaxinterpolation. Finally, the proposed normaliza-tion procedure based on a simple linear interpolanormaliza-tion is not limited to studies dealing with HIV-1 drug
resistance or classification of small GTPases. Other applications may address e.g. protein-protein interaction prediction [37,38], prediction of protein cellular attri-butes [39], protein localization prediction [40] and pro-tein remote homology detection [41]. The current study provides evidence for the reliability of the simple linear interpolation for handling varying protein sequence lengths in a broader range of biomedical classification studies.
Methods
Data
[image:6.595.53.563.99.236.2]The data was gathered from two classification studies of HIV-1 drug resistance and two protein functional class prediction studies [7,16,23]. We analyzed the drug target protein sequences for resistance (= negative) or suscept-ibility (= positive) to the corresponding drugs. These drugs include seven protease inhibitors (PIs) Amprena-vir (APV), AtazanaAmprena-vir (ATV), IndinaAmprena-vir (IDV), LopinaAmprena-vir (LPV), Nelfinavir (NFV), Ritonavir (RTV), Saquinavir (SQV), the six nucleoside reverse transcriptase inhibitors (NRTIs) Lamivudine (3TC), Abacavir (ABC), Zidovudine (AZT), Stavudine (d4T), Didanosine (ddI), Tenofovir Table 3 Wilcoxon Signed-Rank tests
method APV ATV IDV LPV NFV RTV SQV 3TC ABC AZT D4T DDI TDF DLV EFV NVP BVM GTP MIP
linear * * * * * * * * * * * * * * * * * *
splines
fmm * *
periodic * *
natural * *
linear * * * * * * * * * * *
splines
fmm * * * * * * *
periodic * * *
natural * * * * * *
[image:6.595.57.292.512.722.2]Wilcoxon Signed-Rank tests on the AUC distributions. The method performing best and having significantly higher AUC values (a= 0.05) is marked with *. When a test is not significant more than one method is marked. The upper part shows the result of the max-interpolation, the lower part the results of the most-interpolation.
Table 4 Comparison of the prediction accuracy
drug Rheeet al. Houet al. this study
APV 84% 89% 88%
ATV 77% 86% 88%
IDV 79% 86% 93%
LPV 81% 91% 92%
NFV 82% 87% 91%
RTV 89% 93% 95%
SQV 84% 89% 89%
3TC 90% * 90%
ABC 77% * 88%
AZT 76% * 84%
d4T 78% * 84%
ddI 75% * 79%
TDF 73% * 79%
DLV 84% * 87%
EFV 87% * 88%
NVP 91% * 87%
*: Houet al. used only the PI datasets [21].
Table 5 AUC comparison
drug Kierczaket al. this study
3TC 0.95 ± 0.03 0.94 ± 0.00
ABC 0.83 ± 0.05 0.92 ± 0.00
AZT 0.89 ± 0.05 0.91 ± 0.00
d4T 0.85 ± 0.06 0.90 ± 0.00
ddI 0.82 ± 0.08 0.85 ± 0.00
TDF 0.85 ± 0.05 0.83 ± 0.00
DLV 0.76 ± 0.06 0.90 ± 0.00
EFV * 0.93 ± 0.00
NVP 0.85 ± 0.05 0.92 ± 0.00
AUC ± standard deviations.
[image:6.595.305.540.587.713.2](TDF), the three nonnucleoside reverse transcriptase inhibitors (NNRTIs) Delavirdine (DLV), Efavirenz (EFV), Nevirapine (NVP) and the maturation inhibitor Beviri-mat (BVM). Furthermore, we analyzed protein sequences for membership or non-membership in the functional class of small GTPases and MIP, respectively. These datasets contained protein sequences belonging to the specific family (= positive) and proteins that do not belong to the family (= negative) [16]. Table 1 shows a summary of the datasets used in the current study. The ratio of the positive to the negative class is at least 1:3 (except for ABC, 3TC and BVM). The cut-offs of the IC50 values between susceptible and resistant
sequences are in accordance with Rhee et al. [7] and Heideret al. [23].
Descriptor set
It has been shown to be helpful to associate with each amino acid a numerical“descriptor”value, for instance a value that captures a physico-chemical property of this amino acid, instead of treating sequences of amino acids as strings of characters. The selection of the descriptor set is the most critical part in classification [6,42], and, in general, physico-chemical descriptors outperform simpler descriptors [43]. In particular the hydropathy index of Kyte and Doolittle [30] has proven in several studies to be a powerful descriptor [44-48]. Therefore, we used this index to encode the amino acids in the protein sequences. Moreover, we also testednet charge, molecular weight and isoelectric point as descriptors for encoding of the amino acids.
Normalization procedures
The HIV-1 protease (PR) sequences, the HIV-1 reverse transcriptase (RT) sequences, the HIV-1 p2 sequences and the protein sequences for functional classification were normalized to the maximally (max) occurring sequence lengths as well as to the most frequent sequence lengths (most). We used five different normali-zation procedures, the simple linear interpolation and four spline interpolations implemented in different
R-packages (http://www.r-project.org/):
•simple linear interpolation (linear)
•cubic spline interpolation (splines)
•spline interpolation of Forsythe [49] (fmm)
•periodic spline interpolation (periodic)
•natural spline interpolation (natural)
The linear interpolation connects two known data points, (x0, y0) and (x1, y1), with a straight line. xi
indi-cates the sequence position andyi indicates the
corre-sponding value of the amino acid at positionxi. The y
value of a value × in the interval [x0,x1] is given by
y=y0+(x−x0)
y1−y0
x1−x0
. (1)
Linear interpolation on a set of data points (x0, y0),
(x1,y1),..., (xn, yn) is defined as the concatenation of
lin-ear interpolants between each pair of successive data points. The cubic spline interpolation uses piecewise cubic polynomials between the data points. The spline interpolation of Forsythe [49] is a variant of cubic spline interpolation with the cubic passing exactly through the four points at each end of a sample (here: the four encoded amino acids at each end of a protein). The per-iodic spline interpolation fits a curve that fulfills peri-odic boundary conditions, i.e. the spline curve has the same first and second derivative at its endpoints. For the natural spline interpolation, the natural boundary conditions are fulfilled. All interpolation methods result in continuous curves connecting all known data points. However, the progressions of the curves differ from each other.
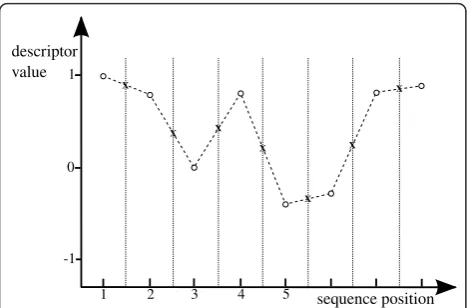
Thenormalization factoris defined as the number of samples taken (by equal interval) from the aforemen-tioned curves to generate an input for the subsequent classification. In Figure 3 the application of the simple linear interpolation from 8 to 15 values is demonstrated with a fictitious descriptor mapping the twenty amino acids to numerical values between -1 and 1. Starting with sequence s=PLAIRNIQthe descriptor encodes s
1 10 20 30 40 50 60 70 80 90
APV: PQITLWQRPLVTIKIGGQLKEALLDTGADDTVLEEMNLPGRWKPKMIGGIGGFIKVRQYDQILIEICGHKAIGTVLVGPTPVNIIGRNLLTQIGCTLNF ATV: PQITLWQRPLVTIKIGGQLKEALLDTGADDTVLEEMNLPGRWKPKMIGGIGGFIKVRQYDQILIEICGHKAIGTVLVGPTPVNIIGRNLLTQIGCTLNF IDV: PQITLWQRPLVTIKIGGQLKEALLDTGADDTVLEEMNLPGRWKPKMIGGIGGFIKVRQYDQILIEICGHKAIGTVLVGPTPVNIIGRNLLTQIGCTLNF LPV: PQITLWQRPLVTIKIGGQLKEALLDTGADDTVLEEMNLPGRWKPKMIGGIGGFIKVRQYDQILIEICGHKAIGTVLVGPTPVNIIGRNLLTQIGCTLNF NFV: PQITLWQRPLVTIKIGGQLKEALLDTGADDTVLEEMNLPGRWKPKMIGGIGGFIKVRQYDQILIEICGHKAIGTVLVGPTPVNIIGRNLLTQIGCTLNF RTV: PQITLWQRPLVTIKIGGQLKEALLDTGADDTVLEEMNLPGRWKPKMIGGIGGFIKVRQYDQILIEICGHKAIGTVLVGPTPVNIIGRNLLTQIGCTLNF SQV: PQITLWQRPLVTIKIGGQLKEALLDTGADDTVLEEMNLPGRWKPKMIGGIGGFIKVRQYDQILIEICGHKAIGTVLVGPTPVNIIGRNLLTQIGCTLNF
into the vector ˜s=(1.00, 0.81, 0.00, 0.82, - 0.37, - 0.28, 0.82, 0.9). Apply-ing the simple linear interpolation with a normalization factor n = 15 results in the interpolated vector ˜
s15=(1.00, 0.91, 0.81, 0.41, 0.00, 0.41, 0.82, 0.23, - 0.37, - 0.33, - 0.28, 0.27, 0.82, 0.86, 0.9).
A fragment of the R-code for creating a Forsythe inter-polation is shown here:
# for all samples in the data set for(i in 1:number_of_samples) {
y = data[i,] # pick
sequence i
x = seq(1:length(y))
f = splinefun(x,y, method="fmm”) #
create interpolation function f
stepsize =
length(y)/normalization_-factor # new stepsize
x.new = c() # new
resulting × values
for(n in 1:normalization_factor){ x.new = c(x.new, n*stepsize) }
y.new = f(x.new) #
calcu-lation of new y values
data.new = cbind(data.new, y.new) #
adding new sample to the new dataset }
Classification
We trained random forests (RF) [31] as implemented in the R package randomForest (http://www.r-project.org/) for the classification. Earlier studies have shown that RFs are excellent non-linear classifier, which are highly stable and robust in comparison to other classifiers [50]. They consist of a set of independent decision trees whose outputs are combined to generate a final deci-sion. In our application, each RF consisted of 2000 ran-domly and independently grown decision trees. When
using the trained RF for prediction, an unseen sequence was assigned to the class voted for by at least 50% of the trees.
RFs provide an importance analysis, which can be used to identify the most important positions for the classification process. The importance measures the decrease in prediction accuracy, when the corresponding variable is permuted [31]. As the importance measure might be affected by correlated positions [51], we calcu-lated the pairwise correlation of each sequence position with each other position. It turned out that the impor-tance measurement is not affected by correlation.
Cross-validation
The RFs were validated using 100-fold leave-one-out [52] validation to evaluate the average prediction sensi-tivity, specificity, and accuracy (see formulas below) and the ability to generalize to unseen sequences. The sensi-tivity, specificity, and accuracy were calculated according to:
sensitivity = TP
TP+FN (2)
specificity = TN
TN+FP (3)
accuracy = TP+TN
TP+TN+FP+FN (4)
with true positivesTP, false positivesFP, false nega-tivesFN and true negativesTN. Furthermore, we calcu-lated the Receiver Operating Characteristics (ROC) curve [53] and the corresponding area under the curve (AUC) with ROCR [54]. The ROC curve is built by plot-ting sensitivity and specificity against each other for every possible cut-off between the two classes.
Statistical comparison
All interpolation procedures were compared by applying Wilcoxon Signed-Rank tests [55] on the AUC distributions from the 100-fold leave-one-out cross-validation runs according to Demsar [56]. The null hypothesis was that there are no differences between the compared classifiers.
Acknowledgements
The authors thank Oliver Kuhn and J. Nikolaj Dybowski for the fruitful suggestions and Sascha Hauke for critically reading the manuscript. We also thank Soo-Yon Rhee for making the HIV-1 data publicly available. This work was supported by the Deutsche Forschungsgemeinschaft (SFB/ Transregio 60) and a young investigator grant to Dominik Heider by the University of Duisburg-Essen, Germany.
Author details
1
[image:8.595.57.291.88.242.2]Department of Bioinformatics, Center of Medical Biotechnology, University of Duisburg-Essen, Universitaetsstr. 2, 45117 Essen, Germany.2Institute of Figure 3Simple linear interpolation. Circles mark descriptor
Virology, University of Cologne, Fuerst-Pueckler-Str. 56, 50935 Cologne, Germany.
Authors’contributions
DH* has developed the research concept, carried out computational analyses and drafted the manuscript.
JV and DH have interpreted results and revised the manuscript. All authors read and approved the final manuscript.
Competing interests
The authors declare no competing interests.
Received: 7 December 2010 Accepted: 31 March 2011 Published: 31 March 2011
References
1. Wang K, Jenwitheesuk E, Samudrala R, Mittler JE:Simple linear model provides highly accurate genotypic predictions of HIV-1 drug resistance. Antivir Ther2004,9(3):343-352.
2. Beerenwinkel N, Schmidt B, Walter H, Kaiser R, Lengauer T, Hoffmann D, Korn K, Selbig J:Diversity and complexity of HIV-1 drug resistance: a bioinformatics approach to predicting phenotype from genotype.Proc Natl Acad Sci USA2002,99(12):8271-8276.
3. Wang D, Larder B:Enhanced prediction of lopinavir resistance from genotype by use of artificial neural networks.J Infect Dis2003, 188(5):653-660.
4. Beerenwinkel N, Däumer M, Oette M, Korn K, Hoffmann D, Kaiser R, Lengauer T, Selbig J, Walter H:Geno2pheno: Estimating phenotypic drug resistance from HIV-1 genotypes.Nucleic Acids Res2003,31(13):3850-3855. 5. Xu S, Huang X, Xu H, Zhang C:Improved Prediction of Coreceptor Usage
and Phenotype of HIV-1 Based on Combined Features of V3 Loop Sequence Using Random Forest.Journal of Microbiology2007,45:441-446. 6. Ong S, Lin H, Chen Y, Li Z, Cao Z:Efficacy of different protein descriptors in predicting protein functional families.BMC Bioinformatics2007,8:300. 7. Rhee SY, Taylor J, Wadhera G, Ben-Hur A, Brutlag DL, Shafer RW:Genotypic
predictors of human immunodeficiency virus type 1 drug resistance. Proc Natl Acad Sci USA2006,103(46):17355-17360.
8. Qian N, Sejnowski TJ:Predicting the secondary structure of globular proteins using neural network models.Journal of molecular biology1988, 202(4):865-84.
9. Punta M, Rost B:Neural networks predict protein structure and function Humana Press, Berlin, Germany 2008 chap. Artificial Neural Networks: Methods and Protocols.
10. Beerenwinkel N, Schmidt B, Walter H, Kaiser R, Lengauer T, Hoffmann D, Korn K, Selbig J:Geno2pheno: Interpreting Genotypic HIV Drug Resistance Tests.IEEE Intelligent Systems2001,16:35-41.
11. Boisvert S, Marchand M, Laviolette F, Corbeil J:HIV-1 coreceptor usage prediction without multiple alignments: an application of string kernels. Retrovirology2008,5:110.
12. Sonnenburg S, Zien A, Philips P, Rätsch G:POIMs: positional oligomer importance matrices-understanding support vector machine-based signal detectors.Bioinformatics2008,24(13):i6-14.
13. Lodhi H, Saunders C, Shawe-Taylor J, Cristianini N, Watkins C:Text Classification using String Kernels.Journal of Machine Learning Research 2002,2:419-444.
14. Jensen MA, Li FS, van Wout AB, Nickle DC, Shriner D, He HX, McLaughlin S, Shankarappa R, Margolick JB, Mullins JI:Improved Coreceptor Usage Prediction and Genotypic Monitoring of R5-to-X4 Transition by Motif Analysis of Human Immunodeficiency Virus Type 1 env V3 Loop Sequences.Journal of Virology2003,77:13376-13388.
15. Resch W, Hoffman N, Swanstrom R:Improved success of phenotype prediction of the human immunodeficiency virus type 1 from envelope variable loop 3 sequence using neural networks.Virology2001,288:51-62. 16. Heider D, Appelmann J, Bayro T, Dreckmann W, Held A, Winkler J,
Barnekow A, Borschbach M:A computational approach for the identification of small GTPases based on preprocessed amino acid sequences.Technology in Cancer Research and Treatment2009, 8(5):333-342.
17. Dybowski JN, Heider D, Hoffmann D:Prediction of co-receptor usage of HIV-1 from genotype.PLoS Comput Biol2010,6(4):e1000743.
18. Heider D, Hauke S, Pyka M, Kessler D:Insights into the classification of small GTPases.Advances and Applications in Bioinformatics and Chemistry 2010,3:15-24.
19. Quinones-Mateu ME, Tadele M, Parera M, Mas A, Weber J, Rangel HR, Chakraborty B, Clotet B, Domingo E, Menéndez-Arias L, Martínez MA: Insertions in the reverse transcriptase increase both drug resistance and viral fitness in a human immunodeficiency virus type 1 isolate harboring the multi-nucleoside reverse transcriptase inhibitor resistance 69 insertion complex mutation.J Virol2002,76(20):10546-10552.
20. Kozisek M, Saskova KG, Rezacova P, Brynda J, van Maarseveen NM, Jong DD, Boucher CA, Kagan RM, Nijhuis M, Konvalinka J:Ninety-nine is not enough: molecular characterization of inhibitor-resistant human
immunodeficiency virus type 1 protease mutants with insertions in the flap region.J Virol2008,82(12):5869-5878.
21. Hou T, Zhang W, Wang J, Wang W:Predicting drug resistance of the HIV-1 protease using molecular interaction energy components.Proteins 2009,74(4):837-846.
22. Kierczak M, Ginalski K, Dramiński M, Koronacki J, Rudnicki W, Komorowski J: A Rough Set-Based Model of HIV-1 Reverse Transcriptase Resistome. Bioinform Biol Insights2009,3:109-127.
23. Heider D, Verheyen J, Hoffmann D:Predicting Bevirimat resistance of HIV-1 from genotype.BMC Bioinformatics2010,11:37.
24. Altmann A, Rosen-Zvi M, Prosperi M, Aharoni E, Neuvirth H, Schülter E, Büch J, Struck D, Peres Y, Incardona F, Sönnerborg A, Kaiser R, Zazzi M, Lengauer T:Comparison of classifier fusion methods for predicting response to anti HIV-1 therapy.PloS one2008,3(10):e3470.
25. Kjaer J, Høj L, Fox Z, Lundgren JD:Prediction of phenotypic susceptibility to antiretroviral drugs using physiochemical properties of the primary enzymatic structure combined with artificial neural networks.HIV medicine2008,9(8):642-52.
26. Haq O, Levy RM, Morozov AV, Andrec M:Pairwise and higher-order correlations among drug-resistance mutations in HIV-1 subtype B protease.BMC bioinformatics2009,10(Suppl 8):S10.
27. Vetter IR, Wittinghofer A:The guanine nucleotide-binding switch in three dimensions.Science2001,294(5545):1299-1304.
28. Karnoub AE, Weinberg RA:Ras oncogenes: split personalities.Nat Rev Mol Cell Biol2008,9(7):517-531.
29. Pao GM, Wu LF, Johnson KD, Höfte H, Chrispeels MJ, Sweet G, Sandal NN, Saier MH:Evolution of the MIP family of integral membrane transport proteins.Mol Microbiol1991,5:33-37.
30. Kyte J, Doolittle R:A simple method for displaying the hydropathic character of a protein.J Mol Biol1982,157:105-132.
31. Breiman L:Random Forests.Machine Learning2001,45:5-32. 32. Torti C, Quiros-Roldan E, Monno L, Patroni A, Saracino A, Angarano G,
Tinelli C, Caputo SL, Tirelli V, Mazzotta F, Carosi G, Group MASTERCGS, Group MASTERCPS:Drug resistance mutations and newly recognized treatment-related substitutions in the HIV-1 protease gene: prevalence and associations with drug exposure and real or virtual phenotypic resistance to protease inhibitors in two clinical cohorts of antiretroviral experienced patients.J Med Virol2004,74:29-33.
33. Kempf DJ, Isaacson JD, King MS, Brun SC, Xu Y, Real K, Bernstein BM, Japour AJ, Sun E, Rode RA:Identification of genotypic changes in human immunodeficiency virus protease that correlate with reduced susceptibility to the protease inhibitor lopinavir among viral isolates from protease inhibitor-experienced patients.J Virol2001,
75(16):7462-7469.
34. Colonno R, Rose R, McLaren C, Thiry A, Parkin N, Friborg J:Identification of I50L as the signature atazanavir (ATV)-resistance mutation in treatment-naive HIV-1-infected patients receiving ATV-containing regimens.J Infect Dis2004,189(10):1802-1810.
35. Patick AK, Duran M, Cao Y, Shugarts D, Keller MR, Mazabel E, Knowles M, Chapman S, Kuritzkes DR, Markowitz M:Genotypic and phenotypic characterization of human immunodeficiency virus type 1 variants isolated from patients treated with the protease inhibitor nelfinavir. Antimicrob Agents Chemother1998,42(10):2637-2644.
36. Shulman NS, Bosch RJ, Mellors JW, Albrecht MA, Katzenstein DA:Genetic correlates of efavirenz hypersusceptibility.AIDS2004,18(13):1781-1785. 37. Guo Y, Yu L, Wen Z, Li M:Using support vector machine combined with
38. Liu B, Wang X, Lin L, Tang B, Dong Q, Wang X:Prediction of protein binding sites in protein structures using hidden Markov support vector machine.BMC Bioinformatics2009,10:381.
39. Chou KC:Prediction of protein cellular attributes using pseudo-amino acid composition.Proteins2001,43(3):246-255.
40. Mundra P, Kumar M, Kumar KK, Jayaraman VK, Kulkarni BD:Using pseudo amino acid composition to predict protein subnuclear localization: Approached with PSSM.Pattern Recognition Letters2007,28:1610-1615. 41. Liu B, Wang X, Lin L, Dong Q, Wang X:A discriminative method for
protein remote homology detection and fold recognition combining Top-n-grams and latent semantic analysis.BMC Bioinformatics2008,9:510. 42. Kernytsky A, Rost B:Using genetic algorithms to select most predictive
protein features.Proteins2009,75:75-88.
43. Nanni L, Lumini A:Using ensemble of classifiers for predicting HIV protease cleavage sites in proteins.Amino Acids2009,36(3):409-416. 44. Dubchak I, Muchnik I, Holbrook S, Kim S:Prediction of protein folding
class using global description of amino acid sequence.Proc Natl Acad Sci USA1995,92(19):8700-8704.
45. Thompson TB, Chou KC, Zheng C:Neural network prediction of the HIV-1 protease cleavage sites.Journal of theoretical biology1995,177(4):369-79. 46. Pánek J, Eidhammer I, Aasland R:Using hydropathy features for function
prediction of membrane proteins.Molecular membrane biology2007, 24(4):304-12.
47. Chowriappa P, Dua S, Kanno J, Thompson HW:Protein structure classification based on conserved hydrophobic residues.IEEE/ACM transactions on computational biology and bioinformatics/IEEE, ACM2008, 6(4):639-51.
48. Borschbach M, Hauke S, Pyka M, Heider D:Opportunities and limitations of a principal component analysis optimized machine learning approach for the identification and classification of cancer involved proteins. Communications of the SIWN2009,6:85-89.
49. Forsythe GE:Computer Methods for Mathematical ComputationsPrentice Hall; 1977.
50. Svetnik V, Liaw A, Tong C, Culberson JC, Sheridan RP, Feuston BP:Random forest: a classification and regression tool for compound classification and QSAR modeling.J Chem Inf Comput Sci2003,43:1947-1958. 51. Strobl C, Boulesteix AL, Kneib T, Augustin T, Zeileis A:Conditional variable
importance for random forests.BMC Bioinformatics2008,9:307. 52. Cawley GC:Leave-One-Out Cross-Validation Based Model Selection
Criteria for Weighted LS-SVMs.Proceedings of the IEEE World Congress on Computational Intelligence2006.
53. Fawcett T:An introduction to ROC analysis.Pattern Recognition Letters 2006,27:861-874.
54. Sing T, Sander O, Beerenwinkel N, Lengauer T:ROCR: visualizing classifier performance in R.Bioinformatics2005,21(20):3940-3941.
55. Wilcoxon F:Individual comparisons by ranking methods.Biometrics1945, 1:80-83.
56. Demsar J:Statistical comparisons of classifiers over multiple data sets. Journal of Machine Learning Research2006,7:1-30.
doi:10.1186/1756-0500-4-94
Cite this article as:Heideret al.:Machine learning on normalized protein sequences.BMC Research Notes20114:94.
Submit your next manuscript to BioMed Central and take full advantage of:
• Convenient online submission
• Thorough peer review
• No space constraints or color figure charges
• Immediate publication on acceptance
• Inclusion in PubMed, CAS, Scopus and Google Scholar
• Research which is freely available for redistribution
![Figure 1 Workflow of the applied procedurehydropathy values of Kyte and Doolittle [30]](https://thumb-us.123doks.com/thumbv2/123dok_us/8261336.278003/3.595.59.539.85.503/figure-workflow-applied-procedurehydropathy-values-kyte-doolittle.webp)