Open Access
Research article
Is theatre utilization a valid performance indicator for NHS
operating theatres?
Omar Faiz*
1, Paris Tekkis
2, Alistair Mcguire
3, Savvas Papagrigoriadis
4,
John Rennie
4and Andrew Leather
4Address: 1Department of Surgery, St Mark's Hospital, Harrow, Middlesex, HA1 3UJ, UK, 2Imperial College London, Department of Surgical Oncology and Technology, St Mary's Hospital, Praed Street, London W21NY, UK, 3Department of Health and Social Care, Cowdray House, London School of Economics and Political Science, Houghton Street WC2A 2AE, UK and 4Department of General Surgery, Kings College Hospital, Denmark Hill, London SE5 9RS, UK
Email: Omar Faiz* - [email protected]; Paris Tekkis - [email protected]; Alistair Mcguire - [email protected];
Savvas Papagrigoriadis - [email protected]; John Rennie - [email protected]; Andrew Leather - [email protected] * Corresponding author
Abstract
Background: Utilization is used as the principal marker of theatre performance in the NHS. This study investigated its validity as: a managerial tool, an inter-Trust indicator of efficient theatre use and as a marker of service performance for surgeons.
Methods: A multivariate linear regression model was constructed using theatre data comprising all elective general surgical operating lists performed at a NHS Teaching hospital over a seven-year period. The model investigated the influence of: operating list size, individual surgeons and anaesthetists, late-starts, overruns, session type and theatre suite on utilization (%).
Results: 7,283 inpatient and 8,314 day case operations were performed on 3,234 and 2,092 lists respectively. Multivariate analysis demonstrated that the strongest independent predictors of list utilization were the size of the operating list (p < 0.01) and whether the list overran (p < 0.01). Surgeons differed in their ability to influence utilization. Their overall influence upon utilization was however small.
Conclusion: Theatre utilization broadly reflects the surgical volume successfully admitted and operated on elective lists. At extreme values it can expose administrative process failure within individual Trusts but probably lacks specificity for meaningful use as an inter-Trust theatre performance indicator. Unadjusted utilization rates fail to reflect the service performance of surgeons, as their ability to influence it is small.
Background
Utilization has become the principal measure of NHS operating theatre service performance. In part, the current reliance on utilization has arisen from its historical use in foreign, often privatised, healthcare systems [1-5]. In
addition however, major recent Audit Commission [6,7] and Modernisation Agency [8] publications have served to enhance the profile of this performance indicator in the United Kingdom.
Published: 31 January 2008
BMC Health Services Research 2008, 8:28 doi:10.1186/1472-6963-8-28
Received: 6 April 2007 Accepted: 31 January 2008
This article is available from: http://www.biomedcentral.com/1472-6963/8/28
© 2008 Faiz et al; licensee BioMed Central Ltd.
Nearly seven million operations are performed each year in the NHS [9]. In the 2002/03 financial period the annual budget for main theatre departments in acute Trusts in England and Wales exceeded £1 billion [10]. As such, hospital theatres represent a significant expense. Efficient use of this costly resource is therefore economi-cally desirable. In addition to financial reasoning – the current political pressures on waiting lists serve to amplify the importance of effecting efficient theatre usage. At present, approximately 1 million people are awaiting NHS treatment [11]. In order to achieve the governments aim to progressively shorten total waiting times to less than 18 weeks by 2008 [12] – enhanced theatre capacity is required. To this end service change has involved vari-ous government initiatives including: a promotion of day case operating [13-15] as well as the development of inde-pendent Treatment Centres [12,16]. In addition to these measures however, a requirement to increase efficiency amongst theatre units within acute NHS Trusts is also rec-ognized.
Despite the widespread use of utilization rates in the pub-lic setting there has been little research to date investigat-ing its validity as a performance indicator. The purpose of this study was to investigate the factors that influence elec-tive general surgical theatre list utilization within an NHS hospital. As such, the study sought to assess the validity of utilization as a performance indicator that could be used to benchmark theatre performance between Trusts as well as a tool that could be used by individual Trusts to facili-tate managerial decision-making. In addition, this investi-gation aimed to explore the influence of individual surgeons on utilization and thereby assess its potential use as a marker of their service performance.
Methods
Data methodsThe study data comprised all elective day case (DC) and inpatient general surgical operations performed at a Teaching Hospital between April 1997 and April 2004. Prospectively entered data relating to the: procedure type, timings and personnel involved in operations were retrieved from the hospital theatre database (Surgiserver ©
McKennon systems). Operations were aggregated into oper-ating lists. Procedure durations were calculated through subtraction of the recorded time when anaesthetic admin-istration was commenced from the time of surgical drape removal at the end of the procedure. Database variables were consequently recoded into: list, session and person-nel factors (see below). The latter, in addition to operating list size, represented the utilization covariates investigated in this study.
Study endpoint
Operating list utilization rates represented the principal study outcome measure. These were calculated through division of the sum of total list procedure time by the allo-cated session duration. Utilization rates were expressed as percentages.
Study covariates
database variables were recoded into: operating list size as well as session, personnel and list factors.
a) Calculation of "operating list size"
A scoring system was developed from all operative proce-dures to quantify the size of general surgical operating lists. This system that was developed we termed the Oper-ative Score of Complexity index. It has been applied to the measurement of workload and productivity in inpatient and outpatient theatres separately (In Press). Specifically, a numerical case-score (measured in units) was assigned to each Office of Population Census and Statistics-4 (OPCS-4) code on the basis of the historical median case duration of all operative procedures that had been assigned to the cor-responding code. The actual numerical score represented the procedure median duration (in seconds)/30. The lat-ter calculation was performed to simplify the numerical score to a tangible figure. For example, the case-score of a day surgery primary inguinal hernia repair was 106 units. This numerical value represented the median duration (in seconds)/30 of all procedures that had been performed in the day surgery department during the study period and coded to the 'Primary Repair of Inguinal Hernia' OPCS-4 code. Case-score indices were calculated separately for the main theatre (MT) and day surgery (DS) databases to account for differences in complexity between operations performed in the respective departments. The sum of the case-scores of constituent list procedures derived the out-put of individual operating lists (i.e. list-scores). In MT's an adjustment was made to list-scores (i.e. list-score/hour of allocated session time) in order to overcome heterogene-ity of session duration. As 99.2% of all day surgery cases were performed on 4-hour operating lists, output was recorded as the list-score without adjustment.
b) Session factors
Operating lists were recoded according to whether they took place on 'morning', 'all-day' or 'afternoon' sessions. In addition, lists were classified according to the depart-mental theatre suites where surgery was undertaken (see Table 1).
c) Personnel factors
performed less than 100 cases were pooled into separate surgical and anaesthetic personnel categories respectively.
d) List factors
List factors describe the extent to which operating sessions started late or overran the allocated session time. An over-run was defined to have occurred when the last procedure on an operating list finished beyond the scheduled finish time. A binary approach to day surgery overruns (i.e. over-run, no-overrun) was used because even minor time infringements in this setting may have adverse staffing consequences. Late-starts in the day surgery setting were however categorised according to the time delay incurred. Overruns and late-starts in MT's were categorised accord-ing to the proportion of time infraccord-ingement as a function of session length. The latter was necessary to compensate for varying session length in MT's. The specific definitions
of late-start and overrun categories for the DS and MT data are described in Table 1.
Statistical Analysis
Unifactorial regression analysis was used to identify risk factors related to theatre utilization. Utilization outcome measures assumed a normal distribution and no data transformation was required. Operating list size (i.e. list-score units) was entered into the models as a continuous variable as it demonstrated a clear linear relationship with utilization in both DS and MT models. Other independ-ent risk factors (i.e. list, session and personnel factors) were entered into the models as categorical variables.
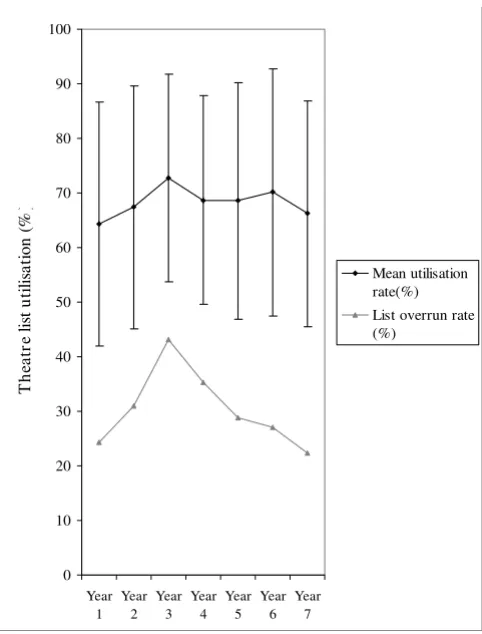
[image:3.612.55.555.97.511.2]In order to determine the adjusted relationship between list utilization and other variables including: the size of the list, list factors, (overruns and late-starts), personnel Table 1: A summary of general surgical operating list characteristics in the DS and MT departments between 1997 & 2004.
Operating list factors Day Surgery (DS) Main Theatres (MT)
Operating list volume
Mean list-score in units per hour (SD) 70.3(26.0) 86.86 (38.29)
Session factors Session type
Percentage of operations performed on Morning lists (n) 38.2%(3226) 15.9%(1156)
Percentage of operations performed on Afternoon lists (n) 61.1%(5083) 17.4%(1265)
Percentage of operations performed on 'All-day' lists (n) - 66.8%(4862)
No. of theatre suites 5 10
Personnel factors Surgeons
Total number of surgeons coded on database 133 125
No. of surgeons with >100 operative procedures 16 16
Percentage of total cases performed by surgeons with>100 cases (n) 79.3% (6594) 78.7% (5732)
Anaesthetists
Total no. of Anaesthetists' coded on database 246 238
No. of anaesthetists with >100 operative procedures 10 14
Percentage of total cases performed by anaesthetists with>100 cases (n) 23. 9% (1983) 65. 6%(5290)
List factors Overruns
Overrunning operating lists (%) 627/2092 (30.0%) 1079/3234 (33.3%)
Median list overrun (Q1-Q3,n) in minutes 50 (24 – 84, n = 627)
-Median list overrun (Q1-Q3,n) as a percentage of session duration (%) - 13.1(5.5–26.2, n = 1079)
Number.(%) of MT lists where no overrun occurred - 2262 (69.9%)
Number(%) of MT lists where overrun : session length = 0–0.1 - 403 (12.5%)
Number(%) of MT lists where overrun : session length = 0.11–0.2 - 215 (6.6%)
Number(%) of MT lists where overrun : session length = 0.21–0.3 - 150 (4.6%)
Number(%) of MT lists where overrun : session length >0.31 - 204 (6.3%)
Late-starts
Median (Q1-Q3, n) late-start in minutes 32 (17–48, 2087) 65 (41–90, 3229)
%(n). DSC operations on lists where Late start <30 minutes 996 (47.61%)
-%(n). DSC operations on lists where Late start is 30–60 minutes 870 (41.59%)
-%(n). DSC operations on lists where Late start is > 60 minutes 221 (10.56%)
-Number (%) of MT lists where no Late-start occurred - 103 (3.18%)
Number(%) of MT lists where Late-start: session length = 0–0.1 - 730 (22.57%)
Number(%) of MT lists where Late-start : session length = 0.11–0.2 - 1564 (48.36%)
Number(%) of MT lists where Late-start : session length = 0.21–0.3 - 522 (16.14%)
and session factors (session type and theatre suite), multi-ple linear regression models were constructed for the DS and MT departments respectively by entering influential univariate risk factors. Stepwise regression was used to evaluate individual predictors. Criteria were set so that variables were excluded from model if their probability of influence was low (p > 0.1). The mean ± Standard Devia-tions (SD) and median (interquartile range, n) values were recorded for outcomes as appropriate. For all tests of significance, P < 0.05 was considered statistically signifi-cant.
Results
Operating list characteristics
Throughout the study period 7283 operations were per-formed on 3234 general surgical operating lists in the MT department. Over the same period 8314 operations were carried out on 2,092 lists in the DS centre. Nearly all (97.6%) patients that were operated in MT's were per-formed under general anaesthesia (GA) whereas in the DS centre 61.6%, 29.8% and 7.7% operations were per-formed under GA, 'Local Infiltration' and 'Sedation' respectively.
The descriptive characteristics of the operating lists per-formed in the DS and MT departments throughout the study period are described in Table 1. The sub-categories of list, session and personnel factors are described in accordance with the categories entered in the regression analyses.
Theatre list utilization rates
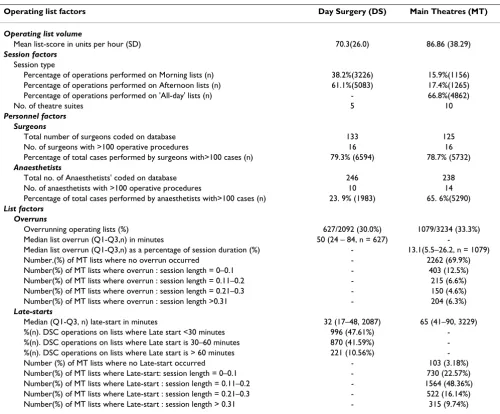
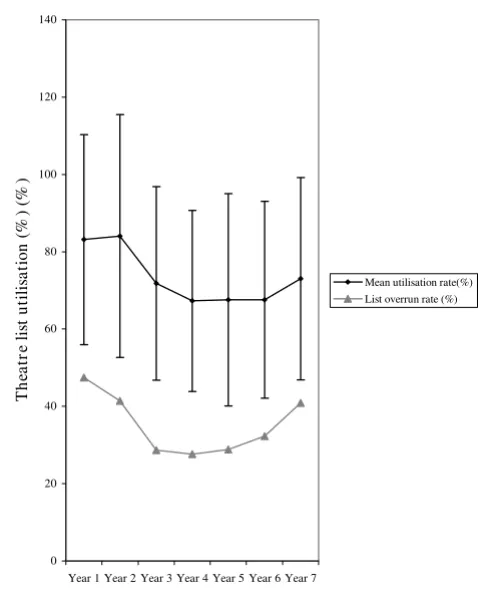
Throughout the study period the mean theatre list utiliza-tion rate was 73.2% (SD: 27.5%, n = 3234) and 68.2% (SD: 21.4, n = 2087) in the MT and DS departments respectively. Over the same time period 30% (n = 627) of day surgery lists and 33% (n = 1079) of main theatre lists overran. Figures 1 &2 demonstrate the annual mean thea-tre utilization rates and the corresponding annual overrun rates. An association between utilization rates and over-runs was observed in the MT and DS departments.
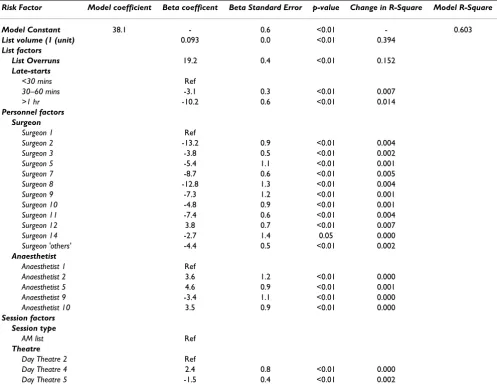
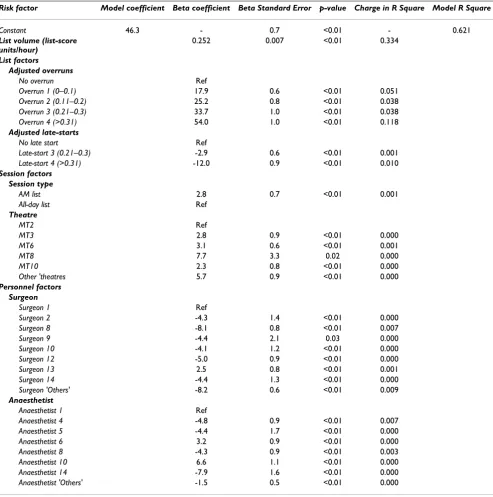
The results of the constructed regression models are shown in Tables 2 (DS) and 3 (MT). The latter tables can be used to predict list utilization rates by extrapolation from the regression equation y = a+b(x), where y = the predicted utilization rate, a = the model constant (or inter-cept) and b = the regression (Beta) coefficient of covari-ate(x). For example, a list utilization rate prediction can be made for a hypothetical scenario where a day surgery list with 300 list-score units are operated upon by surgeon 12 and all other session variables correspond to reference cat-egories (i.e. the list does not overrun and starts promptly and is carried out by anaesthetist 1). The predicted utiliza-tion rate for this scenario equates to the model constant
(38.1%) + (300 list-score units × Beta coefficient for list size i.e. 0.093)% + (1 × 3.8% i.e. the Beta coefficient for surgeon 12) + nil else (as all other covariates were the ref-erence categories). Therefore the predicted utilization rate for this list scenario = 69.8%.
The relative influence of the individual predictors within the model are summarised as the change in R-Square sta-tistic. This statistic represents the impact that exclusion of the considered cofactor has upon the models overall explanatory capability. In both the day surgery and main theatre models the principal determinants of theatre list utilization were: the size of the operating list (p < 0.01) and whether or not the list overran (p < 0.01). Specifically, in the DS department the change in R Square statistic asso-ciated with 'operative list size' and overruns were 0.394 and 0.152 respectively. Other DS model cofactors includ-ing; late starts > 1 hour (p < 0.01, change in R Square sta-tistic = 0.014), as well as individual surgeons and anaesthetists demonstrated a significant, but small, inde-pendent influence on the models explanatory power (see Table 2). In the DS model, session type demonstrated no independent relationship with utilization rates once adjusted for other factors. Similarly, only two of the five
Mean utilization (+SD) and annual overrun rates for main theatre general surgical lists between 1997 & 2004 Figure 1
Mean utilization (+SD) and annual overrun rates for main theatre general surgical lists between 1997 & 2004.
0 20 40 60 80 100 120 140
Year 1 Year 2 Year 3 Year 4 Year 5 Year 6 Year 7
T
he
at
re
lis
t u
tilis
at
ion
(%
) (%
)
[image:4.612.315.554.88.386.2]theatre suites used for surgery in the day unit demon-strated a small independent influence on utilization (see Table 2). In the MT model, operating list size (p < 0.01, change in R Square statistic = 0.334) and overrun catego-ries (p < 0.01, change in R Square statistic 0.038 – 0.118 for categories 'Overrun 1–4') demonstrated the greatest independent influence on list utilization rates of all model covariates (see Table 3). By comparison, the rela-tive influence of other covariates, including session type, individual theatre suites, as well as specific surgical and anaesthetic practitioners, was significant but modest (see Table 3).
Discussion
Theatre utilization represents a qualitative measure of the-atre time usage. Since the publication of the 'STEP Guide to Improving Operating Theatre Performance' by the Modernisation Agency [8] and two national Audit Com-mission reports on Operating Theatres [6,7], utilization has become the principal managerial measure of theatre performance across Trusts in the United Kingdom. Little investigation has however hitherto been conducted to
determine the validity of theatre utilization, as a marker of theatre performance, in the public sector setting.
The results of this study pertain to a single centre. Direct extrapolation of the study results to other Trusts, or even other specialties, is not possible. Many problems within NHS hospitals are however shared between centres. Although only data from one centre was used, the results and conclusions of this study are therefore, by proxy, of relevance to other units. The principal driver of theatre list utilization within this study was operating list size in both the DS and MT departments. In reality, the size of operat-ing lists is often determined by the availability of resources such as ward or high dependency beds. MT uti-lization in a public sector hospital is therefore possibly determined largely by bed capacity. Importantly, this can-not be directly substantiated in the current study as bed capacity data was not a collected variable. If however a relationship between bed capacity and main theatre utili-zation is accepted – then, in the context of declining num-bers of ward beds in NHS hospitals [17], utilization of MT units may decline also. In the DS department low operat-ing list volumes frequently arise due to late 'patient' or 'hospital' cancellations. As such, low theatre utilization rates in this context may require specific corrective meas-ures to ensure that all list patients attend, and are fit, for their operations. To this end the Modernisation Agency has issued specific practical advice on administrative and clinical measures aimed at reducing cancelled operations [18]. Despite this, using measures of surgical workload to measure: intended admissions, patient cancellations and eventual operative list volume might represent more use-ful managerial data than theatre utilization rates.
In our study a strong association between theatre utiliza-tion and list overruns was observed in both the DS and MT departments. This is understandable as, 'allocated ses-sion time' was used to calculate list utilization rates. The rationale for not adjusting the session time to include overtime is that it is not current standard managerial prac-tice to do so in NHS hospitals. Although dangers can arise from the extrapolation of the findings of a single centre study the relationship demonstrated here between utiliza-tion and overruns is logical when the basis of the equautiliza-tion used to calculate utilization is considered. Hence, over-running lists probably serve to inflate utilization rates reported by NHS Trusts. List overruns are however a sig-nificant source of inefficiency in NHS theatres as they are costly in terms of overtime payments and staff morale. Confusingly therefore, Trusts where theatre overruns occur commonly are likely to report high utilization rates also. Although there is evidence that some researchers investigating theatre time usage have adjusted utilization methodology to account for overtime [19] there is little evidence that this is being performed in NHS Trusts. In
Mean utilization (+SD) and annual overrun rates for day the-atre general surgical lists between 1997 & 2004
Figure 2
Mean utilization (+SD) and annual overrun rates for day the-atre general surgical lists between 1997 & 2004.
0 10 20 30 40 50 60 70 80 90 100
Year
1 Year2 Year3 Year4 Year5 Year6 Year7
T
he
at
re
lis
t u
tilis
at
io
n (%
)
[image:5.612.55.296.84.401.2]fact, the inclusion of units with reported utilization rates in excess of 100% in the latest Audit Commission report suggests that adjustment was not made by at least some centres.
In various units individualised theatre utilization rates are routinely sent to surgical and anaesthetic staff as a marker of service performance. The results of this study question the validity of this exercise. Specifically, surgeons dis-played significant independent differences in the determi-nation of list utilization in both the DS and MT settings where coefficients ranged from 3.8 to 13.2% and 0 to -8.2% between them in these differing contexts respec-tively. Although differences between individuals were sig-nificant their overall influence on utilization was modest compared to that of operative volume and whether, or not, list overruns occurred. As such, unadjusted individu-alised utilization rates are more likely to represent the influence of the latter factors rather than the specific
per-formance of theatre personnel. For this reason the use of unadjusted utilization rates could be misrepresentative if used for service activity monitoring of surgical personnel.
For the reasons cited above an optimal level of theatre uti-lization that is appropriate to NHS theatres is difficult to define. The Audit Commission reported that the average Trust utilizes 73% of their total planned session time but theatre utilization across Trusts varied between 41 per cent and 103 per cent. These figures compare broadly to estimates of utilization detected in other investigations into theatre time usage across a variety of specialties in the United Kingdom [19-22]. The Audit Commission meth-odology incorporates however the attrition of theatre time brought about by cancelled operating lists and national estimates suggest that these comprise approximately 10% of all planned Trust sessions [23]. As such, utilization rates that do not account for cancelled sessions will over-estimate utilization. The extent to which this methodol-Table 2: Multiple regression model for Day Surgery list utilization. (only reference categories and retained model variables listed).
Risk Factor Model coefficient Beta coefficent Beta Standard Error p-value Change in R-Square Model R-Square
Model Constant 38.1 - 0.6 <0.01 - 0.603
List volume (1 (unit) 0.093 0.0 <0.01 0.394
List factors
List Overruns 19.2 0.4 <0.01 0.152
Late-starts
<30 mins Ref
30–60 mins -3.1 0.3 <0.01 0.007
>1 hr -10.2 0.6 <0.01 0.014
Personnel factors Surgeon
Surgeon 1 Ref
Surgeon 2 -13.2 0.9 <0.01 0.004
Surgeon 3 -3.8 0.5 <0.01 0.002
Surgeon 5 -5.4 1.1 <0.01 0.001
Surgeon 7 -8.7 0.6 <0.01 0.005
Surgeon 8 -12.8 1.3 <0.01 0.004
Surgeon 9 -7.3 1.2 <0.01 0.001
Surgeon 10 -4.8 0.9 <0.01 0.001
Surgeon 11 -7.4 0.6 <0.01 0.004
Surgeon 12 3.8 0.7 <0.01 0.007
Surgeon 14 -2.7 1.4 0.05 0.000
Surgeon 'others' -4.4 0.5 <0.01 0.002
Anaesthetist
Anaesthetist 1 Ref
Anaesthetist 2 3.6 1.2 <0.01 0.000
Anaesthetist 5 4.6 0.9 <0.01 0.001
Anaesthetist 9 -3.4 1.1 <0.01 0.000
Anaesthetist 10 3.5 0.9 <0.01 0.000
Session factors Session type
AM list Ref
Theatre
Day Theatre 2 Ref
Day Theatre 4 2.4 0.8 <0.01 0.000
[image:6.612.57.554.101.491.2]ogy has previously been applied by Trusts is uncertain. In the short-term however, the Toolkit devised by the Mod-ernisation Agency [8] should facilitate standardisation of theatre utilization calculation. Overall, the Audit Com-mission suggests an optimal 'end utilization' performance target of 77% [6]. Presently however, this study suggests that – whilst unaccounted discrepancies exist between Trusts': overrun rates, inpatient bed facilities and their methodology used to calculate utilization – some scepti-cism regarding the validity of a 'target' utilization rate for
[image:7.612.60.553.110.606.2]NHS theatres should be maintained. In the future, quan-titative measures of surgical service workload, such as Human Resource Group (HRG) tariffs, are likely to pre-dominate over theatre utilization. Definition of an actual service 'output' in NHS Trusts has facilitated political, stra-tegic as well as operational decision-making. A possible extension of this to the operating theatre environment may be to use 'HRG output per theatre per time-period' as an efficiency measure. Irrespective however of the validity of a specific tool that quantifies theatre effectiveness; Table 3: Multiple regression analysis model and list utilization in Main Theatres (only reference categories and retained model variables listed).
Risk factor Model coefficient Beta coefficient Beta Standard Error p-value Charge in R Square Model R Square
Constant 46.3 - 0.7 <0.01 - 0.621
List volume (list-score units/hour)
0.252 0.007 <0.01 0.334
List factors
Adjusted overruns
No overrun Ref
Overrun 1 (0–0.1) 17.9 0.6 <0.01 0.051
Overrun 2 (0.11–0.2) 25.2 0.8 <0.01 0.038
Overrun 3 (0.21–0.3) 33.7 1.0 <0.01 0.038
Overrun 4 (>0.31) 54.0 1.0 <0.01 0.118
Adjusted late-starts
No late start Ref
Late-start 3 (0.21–0.3) -2.9 0.6 <0.01 0.001
Late-start 4 (>0.31) -12.0 0.9 <0.01 0.010
Session factors Session type
AM list 2.8 0.7 <0.01 0.001
All-day list Ref
Theatre
MT2 Ref
MT3 2.8 0.9 <0.01 0.000
MT6 3.1 0.6 <0.01 0.001
MT8 7.7 3.3 0.02 0.000
MT10 2.3 0.8 <0.01 0.000
Other 'theatres 5.7 0.9 <0.01 0.000
Personnel factors Surgeon
Surgeon 1 Ref
Surgeon 2 -4.3 1.4 <0.01 0.000
Surgeon 8 -8.1 0.8 <0.01 0.007
Surgeon 9 -4.4 2.1 0.03 0.000
Surgeon 10 -4.1 1.2 <0.01 0.000
Surgeon 12 -5.0 0.9 <0.01 0.000
Surgeon 13 2.5 0.8 <0.01 0.001
Surgeon 14 -4.4 1.3 <0.01 0.000
Surgeon 'Others' -8.2 0.6 <0.01 0.009
Anaesthetist
Anaesthetist 1 Ref
Anaesthetist 4 -4.8 0.9 <0.01 0.007
Anaesthetist 5 -4.4 1.7 <0.01 0.000
Anaesthetist 6 3.2 0.9 <0.01 0.000
Anaesthetist 8 -4.3 0.9 <0.01 0.003
Anaesthetist 10 6.6 1.1 <0.01 0.000
Anaesthetist 14 -7.9 1.6 <0.01 0.000
Publish with BioMed Central and every scientist can read your work free of charge
"BioMed Central will be the most significant development for disseminating the results of biomedical researc h in our lifetime."
Sir Paul Nurse, Cancer Research UK
Your research papers will be:
available free of charge to the entire biomedical community
peer reviewed and published immediately upon acceptance
cited in PubMed and archived on PubMed Central
yours — you keep the copyright
Submit your manuscript here:
http://www.biomedcentral.com/info/publishing_adv.asp
BioMedcentral improving elective theatre efficiency demands a broad
perspective over the entire surgical pathway.
Conclusion
Maximising theatre usage is obviously desirable in the NHS. Variation between Trusts, in terms of overrun rates and inconsistent methodologies used to calculate utiliza-tion, impede its meaningful use as a tool that can bench-mark theatre performance. Extreme utilization rates do however merit managerial investigation. Quantitative measures of theatre workload and efficiency are likely to be used for decision-making in the future.
Competing interests
In 2003 OF received a £30,000 contribution towards sal-ary from the South East London Strategic Health Author-ity whilst undertaking a period of research.
Authors' contributions
OF contributed to study design, data acquisition, statisti-cal data analysis and drafting of the manuscript. PT con-tributed to the multivariate statistics and data analysis as well as drafting of the manuscript. AMcG participated in study design, results appraisal and contributed towards the intellectual content of the discussion. SP and JR both were responsible for critical appraisal of the results as well as offering a contribution towards the intellectual content of the discussion. AL co-conceived the study and shared responsibility for its design. He also co-ordinated as well as critically appraised the results and helped with drafting of the manuscript. All authors read and approved the final manuscript.
References
1. O' Donnell DJ: Theatre utilization analysis. Med J Aust
2(17):650-1. 1976 Oct 23
2. Cranfield J, Soljak M: Use of time information to maximise the-atre utilization. Aust Health Rev 1989, 12(3):5-15.
3. McQuarrie DG: Limits to efficient operating room scheduling. Lessons from computer-use models. Arch Surg 1981,
116(8):1065-71.
4. Docherty J, McGinnes M: Optimised theatre utilization. NAT-NEWS 1987, 24(9):25-8.
5. Barr A, Rogers S: Operating theatre use. NATNEWS 1983,
20(3):14-7.
6. The Audit Commission, 2003. Operating Theatres [http://
www.audit-commission.gov.uk/reports/NATIONAL- REPORT.asp?CategoryID=&ProdID=6CDDBB00-9FEF-11d7-B304-0060085F8572]. [Accessed on 14th August 2007]
7. The Audit Commission, 2002. Operating Theatres
[http:www.audit-commission.gov.uk/Products/NATIONAL- REPOR49419FE0-6E68-11D6-80C3-00C04F240EA2/district-audit-operat ing-04.pdf]. [Accessed on 14th August 2007]
8. The Modernisation Agency, 2002. Step guide to improving operating theatre performance [http://www.modern.nhs.uk/ theatre/6547/6706/Complete%20Step%20Guide.pdf]. [Accessed on 13th July 2005]
9. Hospital Episode Statistics (HES) data 2003/4
[http:www.dh.gov.uk/PublicationsAndStatistics/Statistics/HospitalEpi sodeStatistics/fs/en]. [Accessed on 14th August 2007]
10. NHS Estates, Healthcare Capital Investment Supplement for Quart Volume 1, No.1 2002/NHS Estates 2003. .
11. Department of Health Waiting list falls below 1M for first time in a decade 2003 [http://www.dh.gov.uk/en/Publicationsandstatistics/ Pressreleases/DH_4046840]. London: Department of Health [Accessed on 14th August 2007]
12. The Department of Health The NHS Plan: a plan for investment – a plan for reform 2000 [http://www.dh.gov.uk/assetRoot/04/05/57/83/ 04055783.pdf]. London: Department of Health [Accessed on 14th August 2007]
13. Department of Health Thousands of NHS patients to benefit from day surgery expansion – Hutton 2002 [http://www.dh.gov.uk/en/Publica tionsandstatistics/Pressreleases/DH_4014344]. London: Department of Health [Accessed on 14th August 2007]
14. Department of Health Drive to boost day surgery in the NHS 2002 [http://www.dh.gov.uk/en/Publicationsandstatistics/Pressreleases/ DH_4013040]. London, Department of Health [Accessed 14th August 2007]
15. Department of Health Priority Areas: First Round. Implications of Day Case Surgery 2003 [http://www.dh.gov.uk/en/Policyandguidance/ Researchanddevelopment/A-Z/Primaryandsecondarycareinterface/ DH_4015535]. London, Department of Health [Accessed on 14th August 2007]
16. Department of Health Treatment Centres: Delivering Faster, Quality Care and Choice for NHS Patients 2005 [http://www.dh.gov.uk/en/Pub licationsandstatistics/Publications/PublicationsPolicyAndGuidance/ DH_4100523]. London, Department of Health [Accessed on 14th August 2007]
17. The Department of Health Shaping the Future NHS: Long Term Planning for Hospitals and Related Services: Consultation Document on the Findings of The National Beds Inquiry 2000 [http://www.dh.gov.uk/asset Root/04/02/04/69/04020469.pdf]. London: Department of Health [Accessed on 14th August 2007]
18. The NHS Modernisation Agency. In Tackling Cancelled Opera-tions. Published December 2001 London: Department of Health; 2001. 19. Durani P, Seagrave M, Neumann L: The Use of Theatre Time in Elective Orthopaedic Surgery. Ann R Coll Surg Engl 2005,
87(Suppl):170-172.
20. Iyer RV, Likhith AM, McLean JA, Perera S, Davis CH: Audit of oper-ating theatre time utilization in neurosurgery. Br J Neurosurg
2004, 18(4):333-7.
21. Haiart DC, Paul AB, Griffiths JM: AN audit of operating theatre time in a peripheral teaching surgical unit. Postgrad Med J 1990,
66(778):612-5.
22. Cole BO, Hislop WS: A grading system in day surgery: effective utilization of theatre time. J R Coll Surg Edinb 1998, 43(2):87-8. 23. Eaton L: Trusts cancel 10% of operating theatre sessions. BMJ
324(7347):1174. 2002 May 18
Pre-publication history
The pre-publication history for this paper can be accessed here: